. 2014 Apr;41(4):041912.
doi: 10.1118/1.4868510.

Image quality in thoracic 4D cone-beam CT: a sensitivity analysis of respiratory signal, binning method, reconstruction algorithm, and projection angular spacing

Affiliations

Image quality in thoracic 4D cone-beam CT: a sensitivity analysis of respiratory signal, binning method, reconstruction algorithm, and projection angular spacing

Chun-Chien Shieh et al. Med Phys. 2014 Apr.

Abstract

Purpose: Respiratory signal, binning method, and reconstruction algorithm are three major controllable factors affecting image quality in thoracic 4D cone-beam CT (4D-CBCT), which is widely used in image guided radiotherapy (IGRT). Previous studies have investigated each of these factors individually, but no integrated sensitivity analysis has been performed. In addition, projection angular spacing is also a key factor in reconstruction, but how it affects image quality is not obvious. An investigation of the impacts of these four factors on image quality can help determine the most effective strategy in improving 4D-CBCT for IGRT.

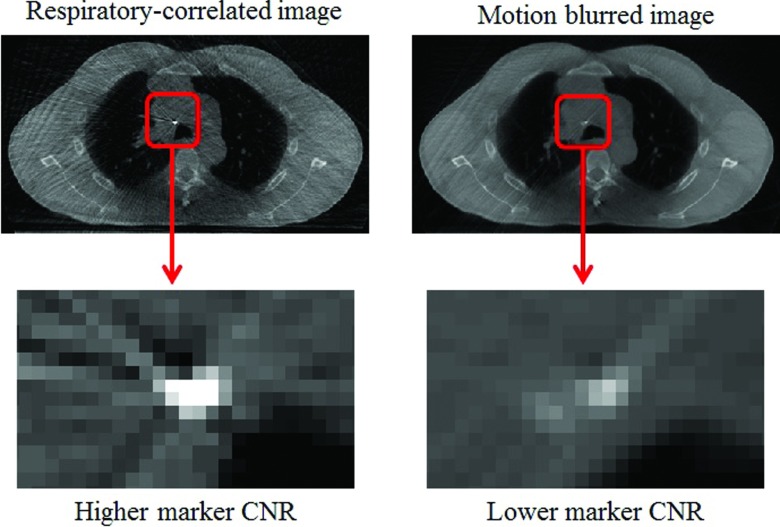
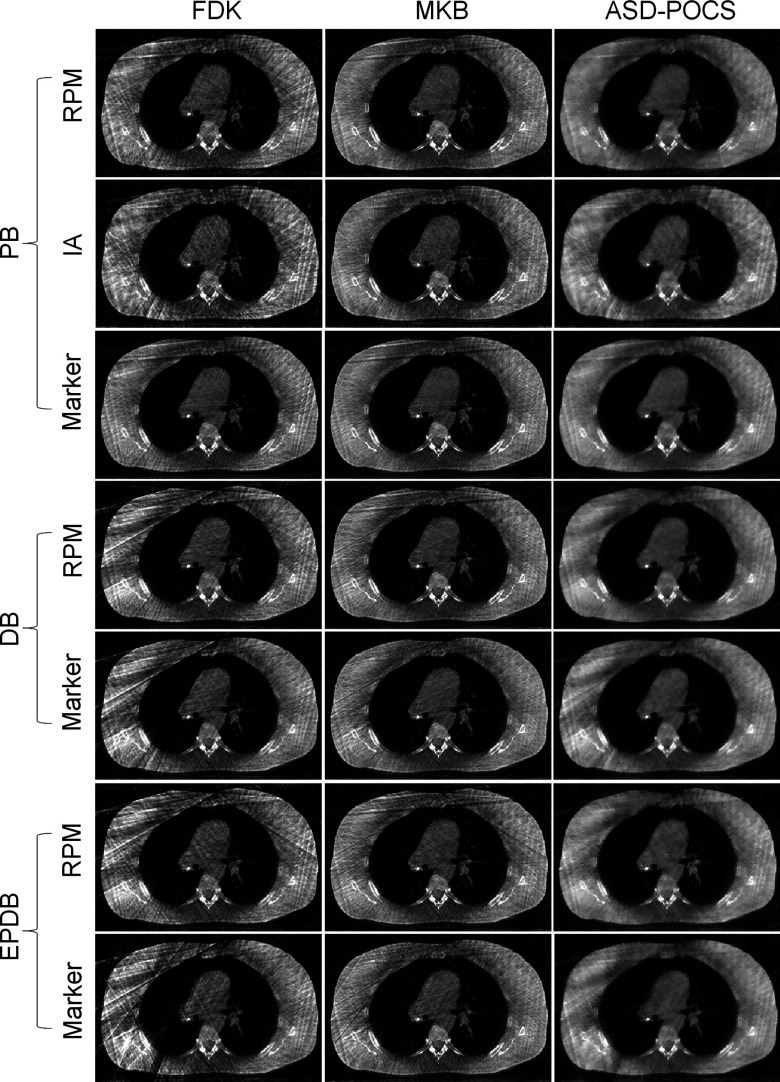
Methods: Fourteen 4D-CBCT patient projection datasets with various respiratory motion features were reconstructed with the following controllable factors: (i) respiratory signal (real-time position management, projection image intensity analysis, or fiducial marker tracking), (ii) binning method (phase, displacement, or equal-projection-density displacement binning), and (iii) reconstruction algorithm [Feldkamp-Davis-Kress (FDK), McKinnon-Bates (MKB), or adaptive-steepest-descent projection-onto-convex-sets (ASD-POCS)]. The image quality was quantified using signal-to-noise ratio (SNR), contrast-to-noise ratio, and edge-response width in order to assess noise/streaking and blur. The SNR values were also analyzed with respect to the maximum, mean, and root-mean-squared-error (RMSE) projection angular spacing to investigate how projection angular spacing affects image quality.

Results: The choice of respiratory signals was found to have no significant impact on image quality. Displacement-based binning was found to be less prone to motion artifacts compared to phase binning in more than half of the cases, but was shown to suffer from large interbin image quality variation and large projection angular gaps. Both MKB and ASD-POCS resulted in noticeably improved image quality almost 100% of the time relative to FDK. In addition, SNR values were found to increase with decreasing RMSE values of projection angular gaps with strong correlations (r ≈ -0.7) regardless of the reconstruction algorithm used.

Conclusions: Based on the authors' results, displacement-based binning methods, better reconstruction algorithms, and the acquisition of even projection angular views are the most important factors to consider for improving thoracic 4D-CBCT image quality. In view of the practical issues with displacement-based binning and the fact that projection angular spacing is not currently directly controllable, development of better reconstruction algorithms represents the most effective strategy for improving image quality in thoracic 4D-CBCT for IGRT applications at the current stage.


Figures

Figure 1
Figure 1
The (a) RPM, (b) intensity analysis, and (c) marker signals for scans 1–6 from patient 1, 2, and 3 (two scans per patient). The respiratory signals for scans 7–14 show similar variability, and are not displayed. All data were plotted with respect to projection number on the x-axis, with peaks representing end inhalation. The RPM and marker signals were plotted in millimeters. The intensity analysis signals do not represent absolute displacement, and were plotted in arbitrary units (AU). For each scan, 1 AU represents the standard deviation of the signal. The mean values of all the data were shifted to zero. The dotted lines in (a) and (c) represent the upper and lower boundaries in displacement binning defined in Sec. 2B2B.
Figure 2
Figure 2
The homogeneous region R over which SNR was defined, and the fiducial marker used for CNR calculation.
Figure 3
Figure 3
CBCT axial image slices illustrating the effect of motion blur on marker CNR values. The respiratory-correlated image (left) was reconstructed with marker signal, displacement binning, and FDK reconstruction. The motion blurred image (right) was reconstructed using FDK with all the projection images. In each case, the axial slice with the best marker visibility was selected. It can be seen clearly that the contrast of the marker in the motion blurred image is much worse than that in the respiratory-correlated image. The window level was set to [0, 0.04] mm−1 (attenuation coefficient) in order to show the difference between marker intensities.
Figure 4
Figure 4
CBCT axial image slice and linear intensity profile showing the definition of ERW used in this study: the 25%–75% width of the linear intensity profile across the lung boundary.
Figure 5
Figure 5
CBCT axial image slices and linear intensity profiles illustrating the effect of motion artifacts on ERW values of the lung boundary. The respiratory-correlated image (left) was reconstructed with marker signal, displacement binning, and FDK reconstruction. The motion blurred image (right) was reconstructed using FDK with all the projection images. An axial slice with clear lung motion was selected. It can be seen clearly that the lung boundary in the motion blurred image is less sharp than that in the respiratory-correlated image, resulting in a larger ERW value. The window level was set to [0, 0.02] mm−1 (attenuation coefficient).
Figure 6
Figure 6
Axial views of end inhalation images (scan 1, patient 1) reconstructed using different respiratory signals, respiratory binning methods, and reconstruction algorithms. The marker was located near the inner side of the right lung. The window level was set to [0, 0.02] mm−1 (attenuation coefficient). (PB: phase binning; DB: displacement binning; EPDB: equal-projection-density displacement binning; IA: intensity analysis).
Figure 7
Figure 7
Mean (a) SNR, (b) CNR, and (c) ERW values over ten respiratory bins for scans 1–6 plotted against different respiratory signals and binning methods using different reconstruction algorithms. The error bars represent the RMSE of the metric values over ten respiratory bins. The black dashed lines separate results obtained from different binning methods. Note that higher SNR, CNR values, and lower ERW values represent better image quality. Therefore, (c) ERW values were plotted on an inverted axis such that an upward trend represents better image quality on all of the graphs. (PB: phase binning; DB: displacement binning; EPDB: equal-projection-density displacement binning; IA: intensity analysis.)
Figure 8
Figure 8
(a) Stacked bar charts showing percentages of 4D reconstruction cases in which DB and EPDB performed better, similar, or worse compared to PB in terms SNR, CNR, and ERW. (b) Stacked bar charts showing percentages of 4D reconstruction cases in which MKB and ASD-POCS performed better, similar, or worse compared to FDK in terms SNR, CNR, and ERW. It should be noted that better image quality corresponds to higher SNR, higher CNR, and lower ERW values. The comparisons were conducted using Student's t-tests on every 4D reconstruction from all 14 scans. The reader is referred to Appendix D for more details on the Student's t-tests.
Figure 9
Figure 9
SNR values of images reconstructed using FDK plotted with respect to (a) max(Δθ), (b) mean(Δθ), and (c) RMSE(Δθ) for scans 1–6. Results for scans 7–14 show similar trends and are not displayed. Different respiratory signals and binning methods are represented by different shapes (RPM: circle; intensity analysis: square; marker: cross) and gray levels (phase: black; displacement: dark gray; equal-projection-density displacement: light gray), respectively. The correlation coefficient r for each case is also displayed.
Figure 10
Figure 10
A FDK image reconstructed with marker signal and equal-project-density displacement binning. This particular image corresponds to the right most light gray cross [EPDB (marker)] in Fig. 9a for patient 1, scan 2, and has a maximum angular gap of 78°, causing major loss of image details. This is the worst case example. The window level is set to [0, 0.02] mm−1 (attenuation coefficient).
Figure 11
Figure 11
The coronal views of the fiducial marker in all ten respiratory bins from patient 3, scan 5, reconstructed using: (a) PB and FDK algorithm; (b) DB and FDK algorithm; and (c) DB and ASD-POCS algorithm. All the images were reconstructed using the marker signal. The window level was set to [0, 0.04] mm−1 (attenuation coefficient). Two dashed lines were plotted to align with the top and bottom most positions of the marker in its motion trajectory in the displacement binning (FDK) case. The same dashed lines were plotted for phase binning (FDK) and displacement binning (ASD-POCS) to assist comparison between the three cases.
Figure 12
Figure 12
The axial views of FDK reconstructed images with a maximum angular gap of 8.8° (left) and 18.5° (right) from patient 1, scan 1. The window level was set to [0, 0.02] mm−1 (attenuation coefficient).
Figure 13
Figure 13
A flow chart illustrating how the two-tailed paired t-tests were employed to determine whether a particular alternative practice (DB, EPDB; MKB, ASD-POCS) performed similarly, better, or worse compared to the corresponding current clinical practice (PB; FDK).

References

    1. Sonke J.-J., Zijp L., Remeijer P., and van Herk M., “Respiratory correlated cone beam CT,” Med. Phys. 32(4), 1176–1186 (2005).10.1118/1.1869074 - DOI - PubMed
    1. Gierga D. P., Brewer J., Sharp G. C., Betke M., Willett C. G., and Chen G. T. Y., “The correlation between internal and external markers for abdominal tumors: Implications for respiratory gating,” Int. J. Radiat. Oncol., Biol., Phys. 61(5), 1551–1558 (2005).10.1016/j.ijrobp.2004.12.013 - DOI - PubMed
    1. Seppenwoolde Y. et al., “Precise and real-time measurement of 3D tumor motion in lung due to breathing and heartbeat, measured during radiotherapy,” Int. J. Radiat. Oncol., Biol., Phys. 53(4), 822–834 (2002).10.1016/S0360-3016(02)02803-1 - DOI - PubMed
    1. Poulsen P. R. et al., “A method for robust segmentation of arbitrarily shaped radiopaque structures in cone-beam CT projections,” Med. Phys. 38(4), 2151–2156 (2011).10.1118/1.3555295 - DOI - PMC - PubMed
    1. Nelson C., Starkschall G., Balter P., Morice R. C., Stevens C. W., and Chang J. Y., “Assessment of lung tumor motion and setup uncertainties using implanted fiducials,” Int. J. Radiat. Oncol., Biol., Phys. 67(3), 915–923 (2007).10.1016/j.ijrobp.2006.10.033 - DOI - PubMed

LinkOut - more resources