. 2014 Jun;25(11):1793-807.
doi: 10.1091/mbc.E13-10-0599. Epub 2014 Apr 2.

The Ca2+-activated Cl- channel ANO1/TMEM16A regulates primary ciliogenesis

Affiliations

The Ca2+-activated Cl- channel ANO1/TMEM16A regulates primary ciliogenesis

Chelsey Chandler Ruppersburg et al. Mol Biol Cell. 2014 Jun.

Abstract

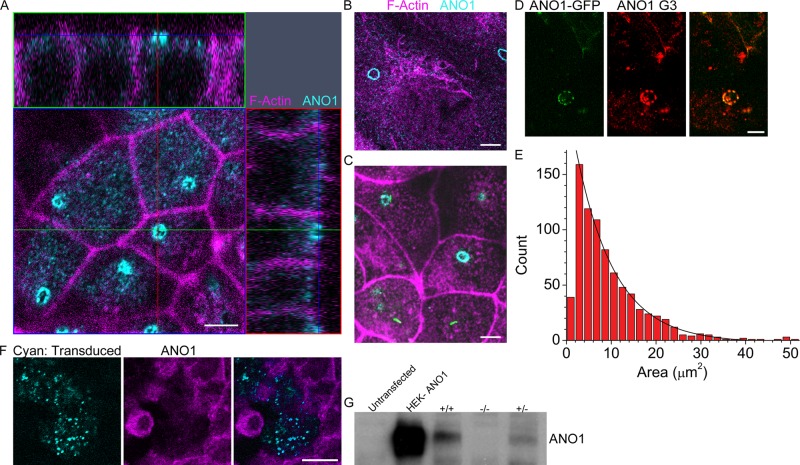
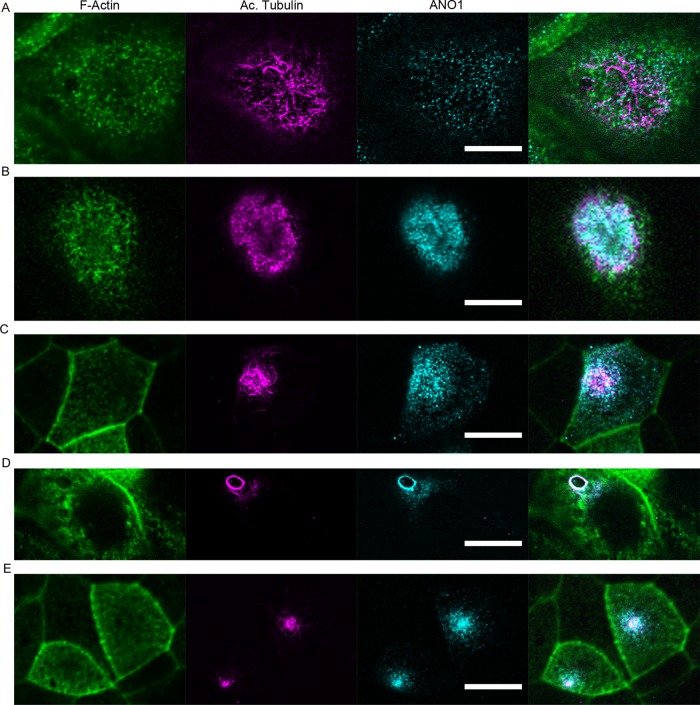
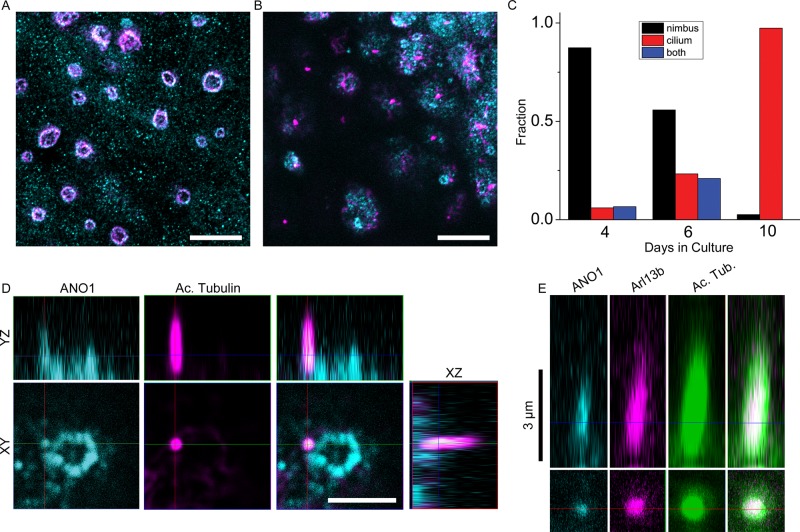
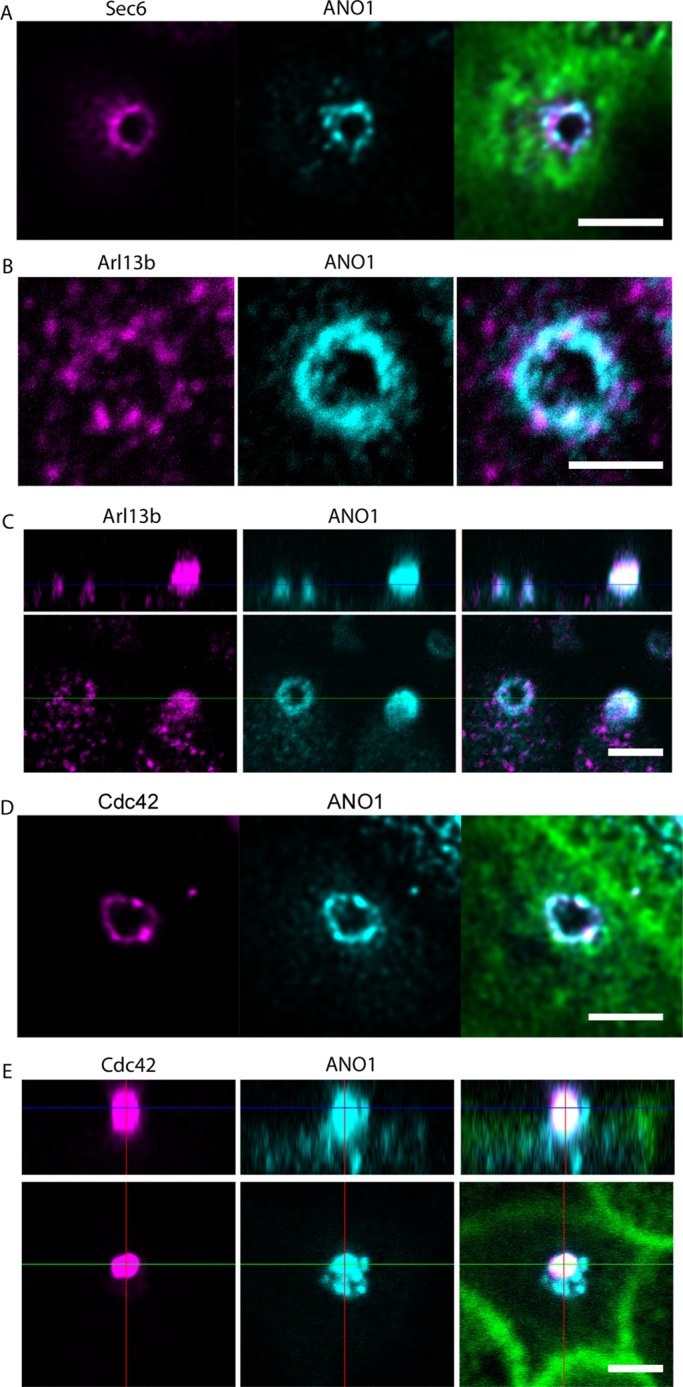
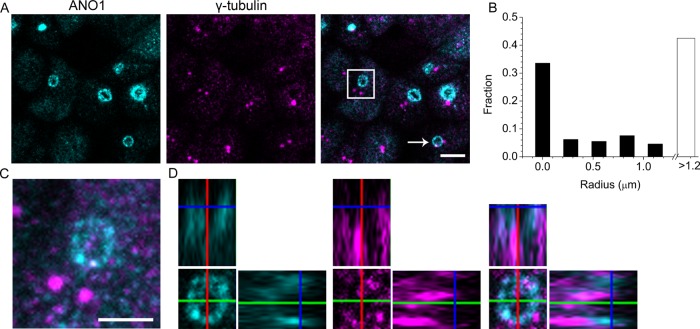
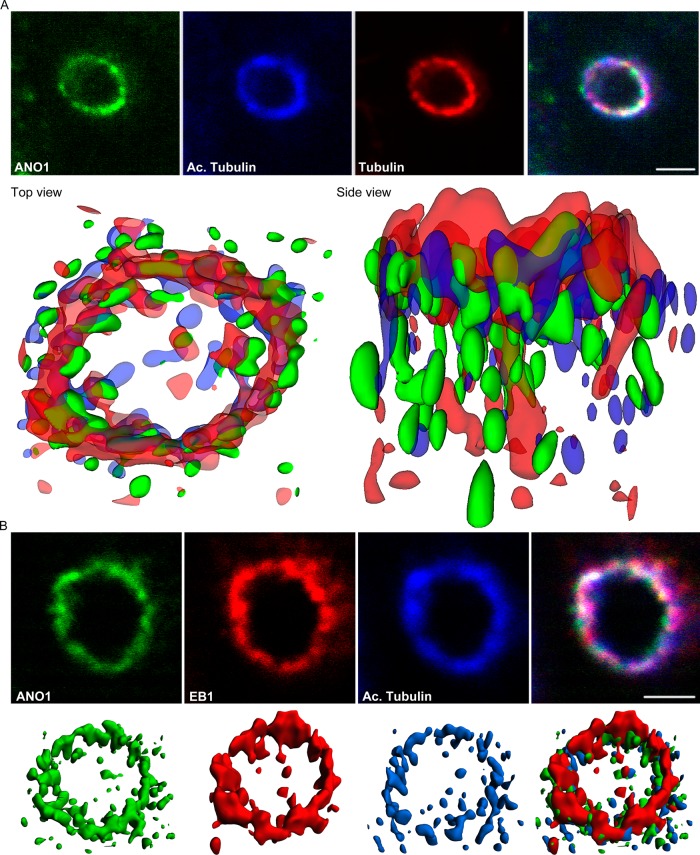
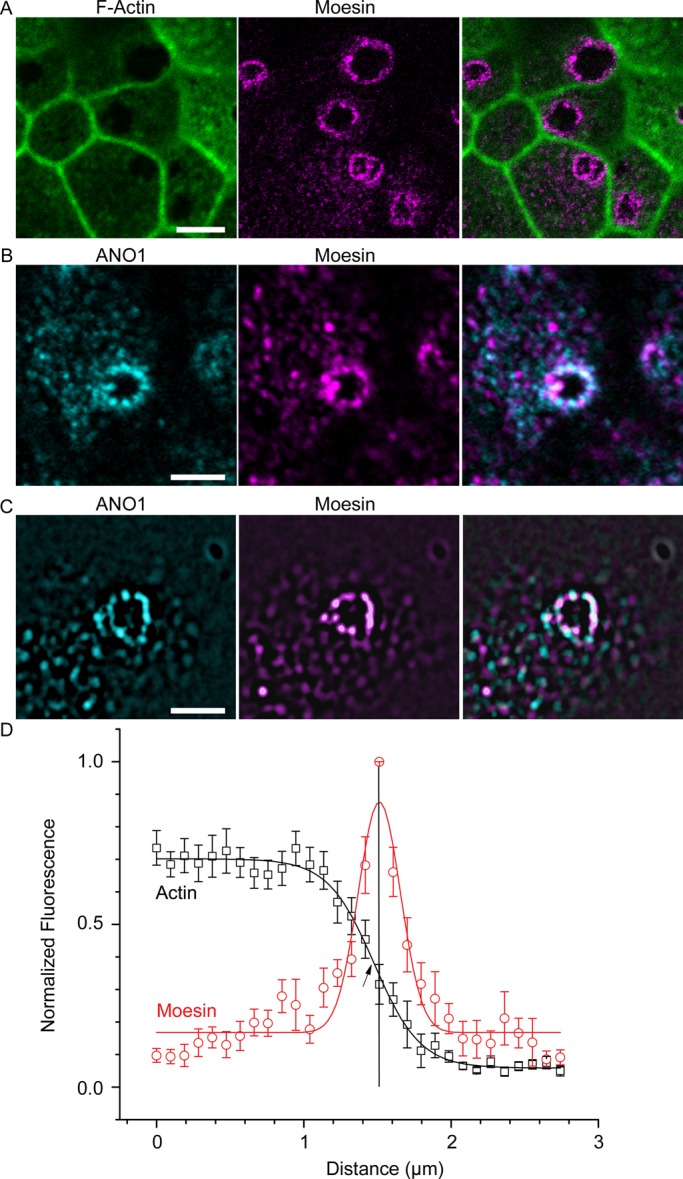
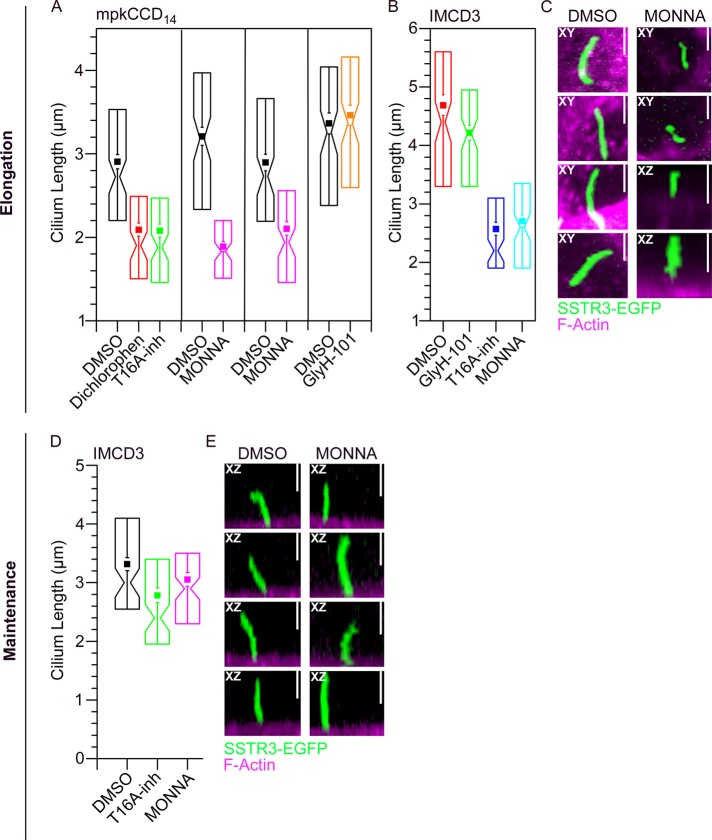
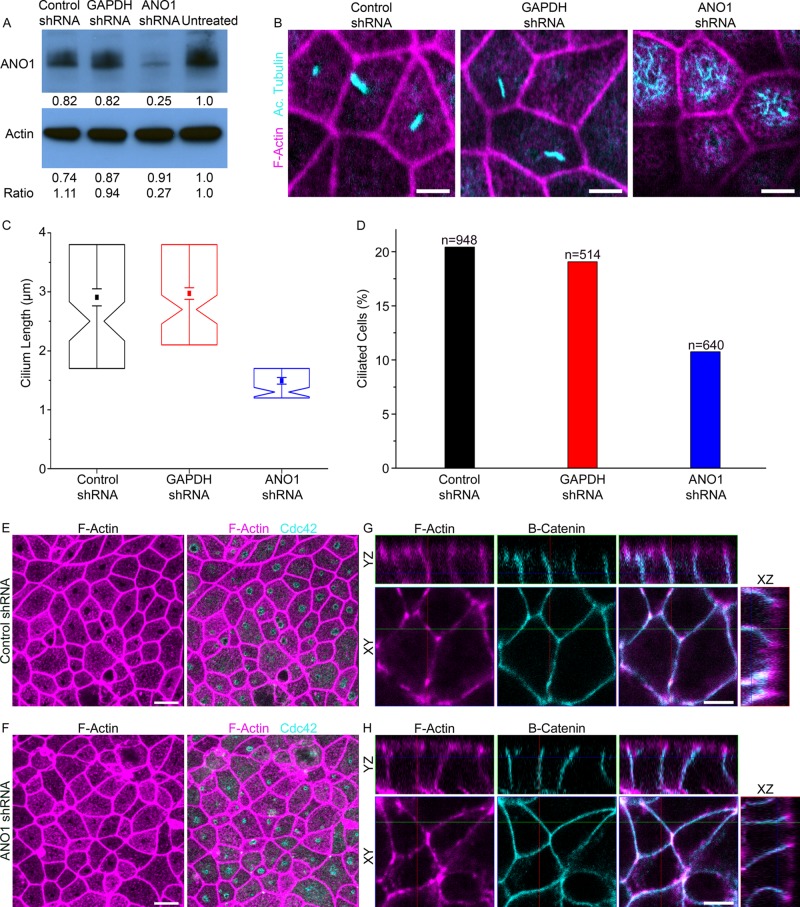
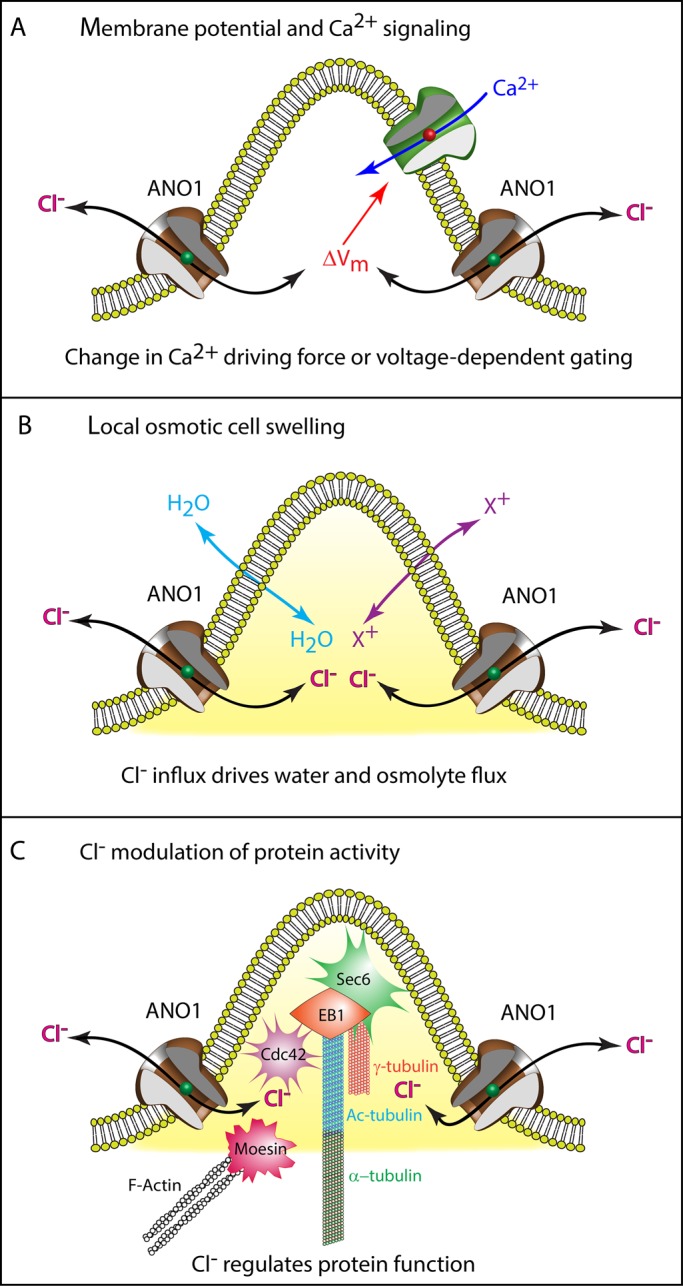
Many cells possess a single, nonmotile, primary cilium highly enriched in receptors and sensory transduction machinery that plays crucial roles in cellular morphogenesis. Although sensory transduction requires ion channels, relatively little is known about ion channels in the primary cilium (with the exception of TRPP2). Here we show that the Ca(2+)-activated Cl ((-)) channel anoctamin-1 (ANO1/TMEM16A) is located in the primary cilium and that blocking its channel function pharmacologically or knocking it down with short hairpin RNA interferes with ciliogenesis. Before ciliogenesis, the channel becomes organized into a torus-shaped structure ("the nimbus") enriched in proteins required for ciliogenesis, including the small GTPases Cdc42 and Arl13b and the exocyst complex component Sec6. The nimbus excludes F-actin and coincides with a ring of acetylated microtubules. The nimbus appears to form before, or independent of, apical docking of the mother centriole. Our data support a model in which the nimbus provides a scaffold for staging of ciliary components for assembly very early in ciliogenesis and chloride transport by ANO1/TMEM16A is required for the genesis or maintenance of primary cilia.


Figures

FIGURE 1:
FIGURE 1:
An annulus of ANO1 is located at the apical aspect of cultured epithelial cells. (A) Confocal image of mpkCCD14 cells grown on permeable supports in the presence of serum. The xy-plane is an optical section taken near the apical surface (faint blue line in the z-sections) showing ANO1 (cyan) concentrated in an annular structure. The yz-plane (top, green line in xy image) and xz-plane (right, red line in xy image) show that the nimbus is located at the apical surface of the cell. Fluorescent phalloidin was used to label F-actin (magenta). (B) ANO1 (cyan) nimbus in RPE-J cells grown on glass coverslips. Acetylated tubulin (magenta). (C) ANO1 (cyan) nimbi in IMCD3 cells grown on permeable supports. Maximum intensity projection (MIP) of a z-stack. Acetylated tubulin (magenta). IMCD3 cells were stably transfected with SSTR3-EGFP, and some cells in the lower part of image have short cilia (green). Scale bars, 5 μm. (D) HEK cells were transfected with ANO1-EGFP (green) and stained with ANO1 antibody (red). Signal from the mANO1-EGFP overlaps with G3 antibody labeling. Scale bar, 5 μm. (E) Size distribution of ANO1 rings. MIPs were made from z-stacks using Zeiss Zen software. The MIPs were then thresholded using robust background subtraction in Cell Profiler (Materials and Methods; Jiang et al., 2012; Wang et al., 2012). The size distribution histogram was fitted to an exponential (black line, count = 223earea/8.9). For the fit, the smallest-size bin was ignored because the thresholding procedure discarded the smallest ANO1 clusters. (F) Specificity of ANO1 antibody. Representative image of mpkCCD14 cells before nimbus formation (Figure 2) treated with lentivirus encoding ANO1 shRNA and EGFP (Figure 9A). Lentivirus-infected cells are identified by EGFP expression (cyan). ANO1 G3 antibody (magenta) shows a decrease in labeling in shRNA-transduced cells. Scale bar, 10 μm. (G) Western blot showing the level of ANO1 in untransfected HEK cells, ANO1-transfected HEK cells, and embryo lysate from wild-type (+/+), ANO1 knockout (−/−), and heterozygous (+/−) mice.
FIGURE 2:
FIGURE 2:
ANO1 localization and nimbus formation before formation of the primary cilium. mpkCCD14 cells were plated onto permeable supports, fixed at various times after plating, and stained with fluorescent phalloidin for F-actin (green) and antibodies against acetylated tubulin (magenta) and ANO1 (cyan). In this and subsequent figures, the rightmost image is a merged image of those to the left. (A) At 24 h after seeding, cells are spread out, and ANO1 is visualized as puncta throughout the cell. Acetylated tubulin is found as microtubules distributed throughout the cell. At 2 d (B) and 3 d (C) after seeding, ANO1 and acetylated tubulin become concentrated in a patch at the apical membrane. (D) At 4 d after seeding, ANO1 and acetylated tubulin are visualized in the ring structure we term the nimbus. (E) At 5 d after seeding, as cells continue to polarize and form primary cilia, ANO1 and acetylated tubulin are localized to a discrete spot at the apical portion of the cell. Scale bars, 10 μm.
FIGURE 3:
FIGURE 3:
The ANO1 nimbus precedes primary cilium formation and localization of ANO1 in the nascent cilium. (A) Maximum intensity projection of mpkCCD14 cells grown under conditions (high serum, 4 d in culture) at which few cells develop cilia. Under these conditions most cells have a nimbus composed of both ANO1 (cyan) and acetylated tubulin (magenta). (B) Maximum intensity projection of cells grown under conditions (10 d in culture) at which most cells have cilia, labeled by acetylated tubulin (magenta), but very few nimbi (ANO1, cyan). (C) Quantification of the number of cells with well-defined nimbi (black), cilia (red), or both (blue) as a function of days in culture showing that ciliated cells rarely have a well-defined nimbus. Nimbi were defined as annular ANO1-staining structures 2–4 μm in diameter. Cilia were defined as acetylated tubulin-staining projections >2 μm in length. n = 325. (D) The primary cilium (magenta) develops as a projection from the side of a nimbus (cyan). In the few cells that have both a nimbus and a cilium, the cilium usually (74% of the time) projects from the side of the nimbus. Bottom, xy-plane. Top, yz-plane. (E) Primary cilium labeled with ANO1 (cyan), Arl13b (magenta), and acetylated tubulin (green). Scale bars, 10 μm (A, B), 2.5 μm (D), 3 μm (E).
FIGURE 4:
FIGURE 4:
Location of key ciliary proteins in the nimbus. mpkCCD14 cells were grown on permeable supports to a nimbiated stage and labeled with the indicated antibodies. (A) Sec6 (magenta), ANO1 (cyan), and F-actin (green) labeled with Alexa Fluor 633–conjugated phalloidin. (B) Intense puncta of Arl13b (magenta) colocalize with ANO1 (cyan) in the nimbus. (C) Bottom, xy-plane. Top, yz-plane. The left cell has a nimbus containing both ANO1 (cyan) and Arl13b (magenta). The right cell contains a bleb that labels for both ANO1 and Arl13b. (D) Cdc42 (magenta), ANO1 (cyan), F-actin (green). (E) Bottom, xy-plane; top, yz-plane. A bleb of Cdc42 (magenta) also labels positive for ANO1 (cyan) and is presumably a nascent cilium. F-actin (green). Scale bars, 2.5 μm.
FIGURE 5:
FIGURE 5:
Relationship of the centriole to the ANO1 nimbus. (A) A maximum-intensity projection of a z-stack of confocal images of mpkCCD14 cells, showing that the spatial relationship of nimbi (ANO1, cyan) to centrioles (γ-tubulin, magenta) is variable. Some nimbi have centrioles within their boundary (white arrow), whereas others do not (white box). (B) Quantification of the distance of centrioles from ANO1 nimbi. ANO1 nimbi and centrioles were identified by thresholding using Cell Profiler. The leftmost bar indicates the fraction of ANO1 nimbi having at least one centriole completely contained within the perimeter in the maximum intensity projection (33%). Another 24% of the ANO1 nimbi had centrioles within <1.2 μm. Forty-three percent of rings did not have a centriole within 1.2 μm. (C) High-magnification image of the nimbus boxed in A. Puncta of γ-tubulin (magenta) are evident in the nimbus (ANO1, cyan), despite the remote location of the centrioles to the nimbus. (D) Individual ortho slices through the nimbus show that γ-tubulin in the nimbus partially overlaps with ANO1. Scale bar, 5 μm (A), 2.5 μm (C).
FIGURE 6:
FIGURE 6:
The nimbus is a hub of the microtubule cytoskeleton. (A) The ANO1 (green) nimbus contains both acetylated (blue) and nonacetylated (red) α-tubulin. Top, representative confocal xy-planes of a z-stack of a nimbus that was subjected to deconvolution. Bottom, the z-stack was deconvolved using Huygens Essential software, and isosurfaces were then constructed from the deconvolved image using Imaris software. Top view, from the apical surface of the cell. Side view, from a plane near the apical surface. (B) EB1 (red) is located at the tips of the microtubules (blue) in the nimbus and commingles with ANO1 (green). Top, representative confocal xy-plane images of a z-stack used for deconvolution. Bottom, isosurfaces constructed from deconvolved images. Scale bars, 2.5 μm.
FIGURE 7:
FIGURE 7:
Moesin marks the boundary of an F-actin–free zone that coincides with the ANO1 nimbus. (A) F-actin (green) concentration is lower in the center of the nimbus, and the interface between F-actin–free and F-actin–rich zones is defined by moesin (magenta) labeling. (B) Confocal image of mpkCCD14 cell nimbus showing that ANO1 (cyan) and moesin (magenta) occupy overlapping locations in the nimbus. (C) Structured illumination microscopy of ANO1 (cyan) and moesin (magenta) shows that the ANO1 and moesin rings comprise distinct puncta that are irregularly superimposed. (D) Quantification of moesin distribution relative to F-actin. To measure the relationship between moesin and F-actin labeling, pixel intensities along a line starting near the center of the cell and ending at the approximate center of a nimbus were recorded and normalized to the highest intensity in each channel. These measurements for 12 nimbi were then aligned on the x-axis to the moesin pixel with the highest intensity (= 1, vertical line) and the actin (black data points) and moesin (red data points) intensities averaged at each position on the x-axis. The moesin data were fitted to a Gaussian function (red line), and the actin was fitted to a Boltzmann equation (black line). Because the moesin channels were aligned to the highest moesin pixel intensity in order to calculate the average of multiple nimbi, the peak moesin intensity is 1, whereas variation in actin intensities around each nimbus resulted in a maximum intensity <1. Scale bars, 5 μm (A), 2.5 μm (B, C).
FIGURE 8:
FIGURE 8:
Inhibitors of ANO1 channel activity have a negative effect on cilium length. (A) Quantification of the effect of ANO1 inhibitors on ciliary length in mpkCCD14 cells. (B) Quantification of the effect of ANO1 inhibitors on ciliary length in IMCD3 cells. Solid squares, mean. Whiskers, 1 SEM. Box, 25th and 75th percentiles. Notch, median and 1–99% confidence intervals of the median. *p < 0.001 by two-tailed t test compared with the matched DMSO control. Each data point is the mean of 84–110 cilia measured in randomly selected fields. (C) Representative images of DMSO (control) and MONNA-treated IMCD3 cells labeled for F-actin (magenta) and expressing EGFP-tagged somatostatin receptor 3 (SSTR3-EGFP, green). In C, MONNA was added to the medium at the same time serum starvation was initiated. This protocol tested the effect of ANO1 inhibitors on cilium formation, elongation, and maintenance (labeled “elongation”). (D) Quantification of the effect of ANO1 inhibitors added for 6 h after 24 h of serum starvation. This protocol tested the potential effect of ANO1 inhibitors on maintenance of ciliary length (labeled “maintenance”). (E) Representative image of DMSO (control) and MONNA-treated IMCD3 cells labeled for F-actin (magenta) and expressing EGFP-tagged somatostatin receptor 3 (SSTR3-EGFP, green). Under both conditions of ANO1 inhibitor exposure (C, E) the somatostatin receptor continues to localize to the primary cilium. Vertical scale bars, 2.5 μm (C, E).
FIGURE 9:
FIGURE 9:
Effects of shRNA knockdown of ANO1. (A) Western blot showing the level of ANO1 and β-actin in untreated mpkCCD14 cells and cells treated with lentiviral particles encoding shRNA against ANO1 or GAPDH or a nonsilencing control sequence as indicated. The numbers below the lanes represent the densitometric measurement of the respective bands. The row of numbers labeled “ratio” is the ratio of the ANO1 band to the β-actin band normalized to the untreated control. (B) Representative images of ciliated mpkCCD14 cells that were treated with lentivirus encoding ANO1 or GAPDH shRNA or a nonsilencing control shRNA. Cyan, acetylated tubulin. Magenta, phalloidin. Scale bars, 5 μm. (C) Cilium length in cells treated with shRNA as indicated. Box plot as in Figure 8. (D) Percentage of ciliated cells. (E, F) Nimbi of Cdc42 (cyan) are observed in cultures treated with either (E) control shRNA or (F) ANO1 shRNA. Magenta, F-actin labeled with phalloidin. Scale bars, 10 μm. (G, H) Overall cell polarity appears unperturbed and similar in cells treated with (G) control shRNA and (H) ANO1 shRNA as assessed by β-catenin (cyan) and F-actin (magenta) organization. Scale bars, 5 μm.
FIGURE 10:
FIGURE 10:
Possible mechanisms of ANO1 function in ciliogenesis. See Discussion for more information. Although the figure depicts ANO1 in the plasma membrane at the base of a nascent cilium as suggested by Figure 3E, we have no firm evidence that ANO1 is located in the plasma membrane. In addition, the proximity of Sec6, EB1, Cdc42, moesin, tubulin, and actin in the illustration is not meant to imply that they form a complex.

Similar articles

Cited by

References

    1. Albertson DG. Gene amplification in cancer. Trends Genet. 2006;22:447–455. - PubMed
    1. Andersen NJ, Yeaman C. Sec3-containing exocyst complex is required for desmosome assembly in mammalian epithelial cells. Mol Biol Cell. 2010;21:152–164. - PMC - PubMed
    1. Avasthi P, Marshall WF. Stages of ciliogenesis and regulation of ciliary length. Differentiation. 2012;83:S30–S42. - PMC - PubMed
    1. Ayoub C, Wasylyk C, Li Y, Thomas E, Marisa L, Robe A, Roux M, Abecassis J, de Reynies A, Wasylyk B. ANO1 amplification and expression in HNSCC with a high propensity for future distant metastasis and its functions in HNSCC cell lines. Br J Cancer. 2010;103:715–726. - PMC - PubMed
    1. Badano JL, Mitsuma N, Beales PL, Katsanis N. The ciliopathies: an emerging class of human genetic disorders. Annu Rev Genom Hum Genet. 2006;7:125–148. - PubMed

Publication types

MeSH terms