. 2014 Jun;25(11):1808-18.
doi: 10.1091/mbc.E14-03-0788. Epub 2014 Apr 2.

Protein tyrosine phosphatases ε and α perform nonredundant roles in osteoclasts

Affiliations

Protein tyrosine phosphatases ε and α perform nonredundant roles in osteoclasts

Eynat Finkelshtein et al. Mol Biol Cell. 2014 Jun.

Abstract

Female mice lacking protein tyrosine phosphatase ε (PTP ε) are mildly osteopetrotic. Osteoclasts from these mice resorb bone matrix poorly, and the structure, stability, and cellular organization of their podosomal adhesion structures are abnormal. Here we compare the role of PTP ε with that of the closely related PTP α in osteoclasts. We show that bone mass and bone production and resorption, as well as production, structure, function, and podosome organization of osteoclasts, are unchanged in mice lacking PTP α. The varying effects of either PTP on podosome organization in osteoclasts are caused by their distinct N-termini. Osteoclasts express the receptor-type PTP α (RPTPa), which is absent from podosomes, and the nonreceptor form of PTP ε (cyt-PTPe), which is present in these structures. The presence of the unique 12 N-terminal residues of cyt-PTPe is essential for podosome regulation; attaching this sequence to the catalytic domains of PTP α enables them to function in osteoclasts. Serine 2 within this sequence regulates cyt-PTPe activity and its effects on podosomes. We conclude that PTPs α and ε play distinct roles in osteoclasts and that the N-terminus of cyt-PTPe, in particular serine 2, is critical for its function in these cells.


Figures

FIGURE 1:
FIGURE 1:
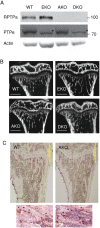
Bone structure of PTPa-deficient mice. (A) RPTPa is expressed in osteoclasts. Lysates prepared from osteoclasts differentiated in vitro from bone marrow precursors of WT, EKO, AKO, and DKO mice were probed with anti-PTPe/a antibodies. Molecular mass markers are in kilodaltons. Asterisk denotes a nonspecific background band in the PTPe blot. (B) Micro-CT images of tibiae of WT, EKO, AKO, and DKO female mice. Bar, 500 µm. (C) Top, section of tibiae from 7-wk-old WT and AKO male mice stained for TRAP. Bar, 500 μm. Bottom, higher magnification of bone section stained for TRAP (red, OCLs marked with asterisks) and counterstained with hematoxylin/eosin.
FIGURE 2:
FIGURE 2:
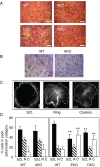
Properties of PTP α-deficient osteoclasts. (A) Bone marrow cells from WT, AKO, EKO, and DKO female mice were cultured with M-CSF and RANKL for 6 d and then stained for TRAP (red). Bar, 200 μm. (B) Bone marrow cells from WT and AKO female mice were seeded on fragments of bovine bone and grown for 8 d in the presence of M-CSF and RANKL. Cells were then removed and the bone fragments stained with Coomassie brilliant blue to highlight resorption pits. Bar, 400 μm. (C) WT OCLs prepared from 7-wk-old female mice were grown on glass coverslips, fixed, stained with phalloidin–Alexa 488, and examined by cell imaging. Shown are examples of the three podosomal arrangement types: sealing zone–like structure (SZL, large single belt at the cell periphery), rings (mixture of small rings and individual, scattered podosomes), and clusters (individual or grouped podosomes, no rings). Bar, 10 μm. Dashed line marks outer perimeter of the cell shown. (D) Percentages (mean ± SD) of OCLs of the four genotypes in which the actin-rich podosomal cores were arranged in SZL-like structures (SZL), rings (R), or clusters (C). n = 317–638 OCLs/genotype. **p < 0.05 vs. WT by Student's t test.
FIGURE 3:
FIGURE 3:
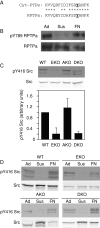
Phosphorylation of RPTPa and Src in OCLs. (A) C-terminal sequences of cyt-PTPe and RPTPa. The phosphorylatable tyrosine (Y789 in RPTPa, Y638 in cyt-PTPe) is highlighted. (B) Primary OCLs prepared from bone marrow of WT mice were grown on plastic plates (Ad), serum-starved, lifted, maintained in suspension for 30 min (Sus), and then seeded on plates coated with fibronectin (FN). Cells were lysed, and pY789 RPTPa was detected by protein blotting. (C) Phosphorylation of Src at its activating Y416 in adherent OCLs from WT, EKO, AKO, and DKO female mice. Top, representative protein blot. Bottom, bar diagram summarizing two to seven independent repeats per genotype (each compared with pY416 Src levels in WT OCLs processed in parallel; mean ± SE). (D) Src undergoes integrin-dependent phosphorylation in the absence of PTP α and/or ε. Adherent, suspended, and readherent OCLs from the four genotypes were analyzed for pY416 Src by protein blotting. Note that in all cases, Src is hypophosphorylated in suspended cells (Sus) and rephosphorylated when cells readhere for fibronectin-covered surface (FN). Intensity of pY416 Src phosphorylation varies among genotypes as in C; exposure of pY416 Src images was adjusted for each genotype to allow visualization of phosphorylation.
FIGURE 4:
FIGURE 4:
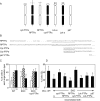
Nonreceptor forms of PTPs ε and α can rescue the podosomal organization phenotype of EKO osteoclasts. (A) Schematic representation of various constructs of PTP ε and PTP α used in this study. Dashed horizontal lines, cell membrane; oval, unique N-terminus from cyt-PTPe; small rectangle, Lck myristoylation motif; large vertical rectangles, PTP domains of PTP α (black) or PTP ε (white). (B) N-terminal sequences of RPTPa/e, cyt-PTPa/e, and p67 PTPe. Dashed underline marks membrane-spanning regions of RPTPe and RPTPa. Solid underline marks the 12 N-terminal residues of cyt-PTPe, which are unique to this isoform (and were included as the N-terminus of the artificial cyt-PTPa protein). (C) Expression of cyt-PTPe in OCLs from PTPe-deficient mice rescues their podosomal organization phenotype. Cultures of OCLs prepared from bone marrow of WT or EKO mice, some expressing exogenous cyt-PTPe as indicated, were examined as described in Figure 2D. *p ≤ 0.03, **p ≤ 0.006 vs. WT by Student's t test. n = 199–918 OCLs per genotype and treatment. (D) Rescue of the EKO OCL podosome organization phenotype by various PTP ε and PTP α molecules. WT and EKO OCLs prepared from 7-wk-old female mice infected with adenoviruses expressing the indicated constructs and then processed as in Figure 2D. Percentage of cells (mean ± SD) in which podosomes are arranged as a podosomal belt (SZL) for clarity of presentation. The complete distributions of SZL, R, and C cells in this experiment are shown in Supplemental Figure S2. *p ≤ 0.04, **p ≤ 0.008 vs. WT. n = 199–918 osteoclasts analyzed per treatment.
FIGURE 5:
FIGURE 5:
Effects of the N-terminus on podosomal localization of PTPs α and ε. (A) Cultures of WT and EKO osteoclasts, some expressing exogenous cyt-PTPe, p67 PTPe, or cyt-PTPa, were fractionated into podosome-enriched and nonpodosomal fractions. Shown are both fractions at the same exposure (top) and at different exposures (second from top; nonpodosomal is less exposed and podosome enriched is more exposed than in the top). Tubulin (fourth from top), which is not found in podosomes, and Src and actin (third from top, and bottom, respectively), which are found in both fractions, serve as controls for the fractionation process. The podosomal and nonpodosomal fractions were prepared in distinct buffers, which accounts for their slightly different electrophoretic migration patterns. Size markers are in kilodaltons.
FIGURE 6:
FIGURE 6:
Serine 2 of cyt-PTPe regulates its function in osteoclasts. (A) Sequence of the 12 N-terminal residues of cyt-PTPe. Arrows mark S2, S3, S8, and T11. (B) S2A cyt-PTPe fails to rescue the EKO podosomal phenotype. Cultures of WT and EKO OCLs were infected with adenoviruses expressing S2A cyt-PTPe or S2D cyt-PTPe as indicated, and the organization of their podosomes was analyzed as in Figure 2D. Percentage of cells (mean ± SD) in which podosomes are arranged as a belt at the cell periphery. *p = 0.02, **p = 0.0006 vs. WT. n = 370–709 osteoclasts analyzed per genotype and treatment. (C) Serine 2 inhibits cyt-PTPe activity. A total of 293 cells expressing empty vector (mock) or cyt-PTPe proteins as indicated were lysed, and total phosphatase activity toward PNPP in the lysates was measured with or without presence of PTP inhibitor (0.5 mM sodium pervanadate; +v). Values represent mean ± SE; *p < 0.03 by Student's t test vs. cyt-PTPe. This experiment is representative of four to eight separate experiments. In all, fold increases in activities of S2A and S2D cyt-PTPe relative to WT cyt-PTPe were 1.53 ± 0.23 and 1.76 ± 0.37, respectively. (D) Src kinase activity is similar in EKO OCLs expressing WT, S2A or S2D cyt-PTPe (mean ± SE of five experiments). Activity in EKO OCLs devoid of PTP ε (unpublished data) was 0.67 ± 0.11 of cells expressing WT cyt-PTPe. (E) OCLs prepared from female EKO mice were infected with adenoviral vectors expressing S2A cyt-PTPe, S2D cyt-PTPe, or RPTPa as indicated. (–), mock-infected cells. Cells were fractionated and analyzed as described in Figure 5. Size markers are in kilodaltons.

Similar articles

Cited by

References

    1. Amoui M, Sheng MH, Chen ST, Baylink DJ, Lau KH. A transmembrane osteoclastic protein-tyrosine phosphatase regulates osteoclast activity in part by promoting osteoclast survival through c-Src-dependent activation of NFkappaB and JNK2. Arch Biochem Biophys. 2007;463:47–59. - PubMed
    1. Andersen JN, Elson A, Lammers R, Romer J, Clausen JT, Moller KB, Moller NP. Comparative study of protein tyrosine phosphatase-epsilon isoforms: membrane localization confers specificity in cellular signalling. Biochem J. 2001;354:581–590. - PMC - PubMed
    1. Aoki K, Didomenico E, Sims NA, Mukhopadhyay K, Neff L, Houghton A, Amling M, Levy JB, Horne WC, Baron R. The tyrosine phosphatase SHP-1 is a negative regulator of osteoclastogenesis and osteoclast resorbing activity: increased resorption and osteopenia in me(v)/me(v) mutant mice. Bone. 1999;25:261–267. - PubMed
    1. Arias-Salgado EG, Lizano S, Sarkar S, Brugge JS, Ginsberg MH, Shattil SJ. Src kinase activation by direct interaction with the integrin beta cytoplasmic domain. Proc Natl Acad Sci USA. 2003;100:13298–13302. - PMC - PubMed
    1. Bauler TJ, Kamiya N, Lapinski PE, Langewisch E, Mishina Y, Wilkinson JE, Feng GS, King PD. Development of severe skeletal defects in induced SHP-2-deficient adult mice: a model of skeletal malformation in humans with SHP-2 mutations. Dis Model Mech. 2011;4:228–239. - PMC - PubMed

Publication types

MeSH terms

LinkOut - more resources