

Habitat stress initiates changes in composition, CO2 gas exchange and C-allocation as life traits in biological soil crusts
- PMID: 24694713
- PMCID: PMC4184013
- DOI: 10.1038/ismej.2014.47
Habitat stress initiates changes in composition, CO2 gas exchange and C-allocation as life traits in biological soil crusts
Abstract
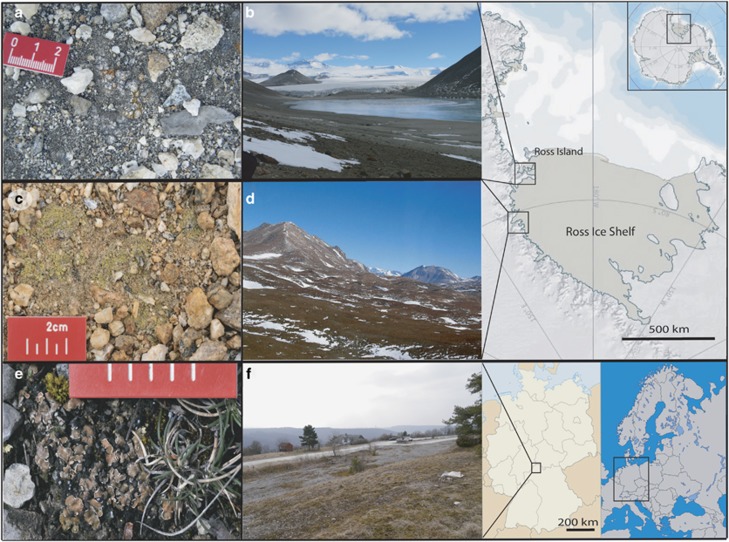
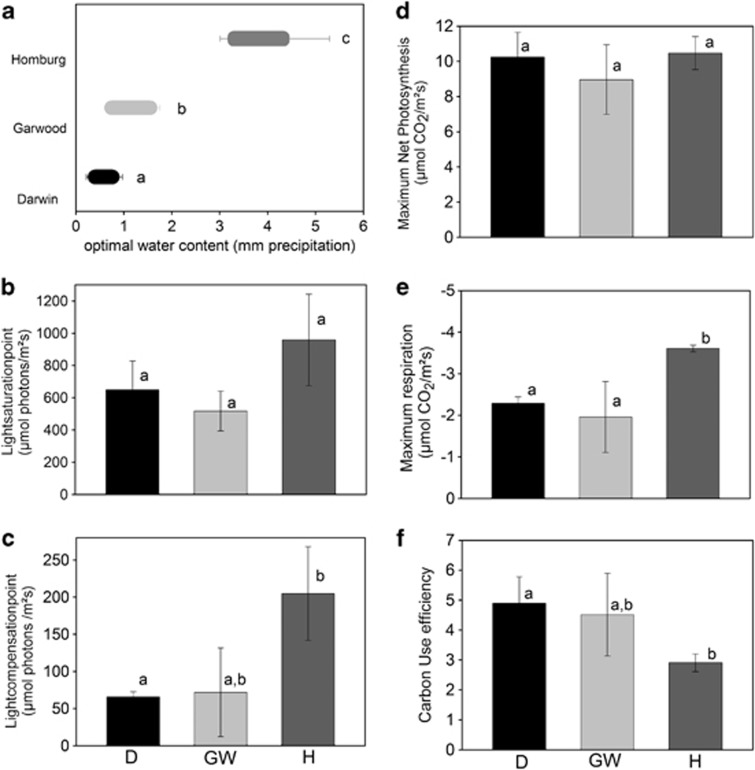
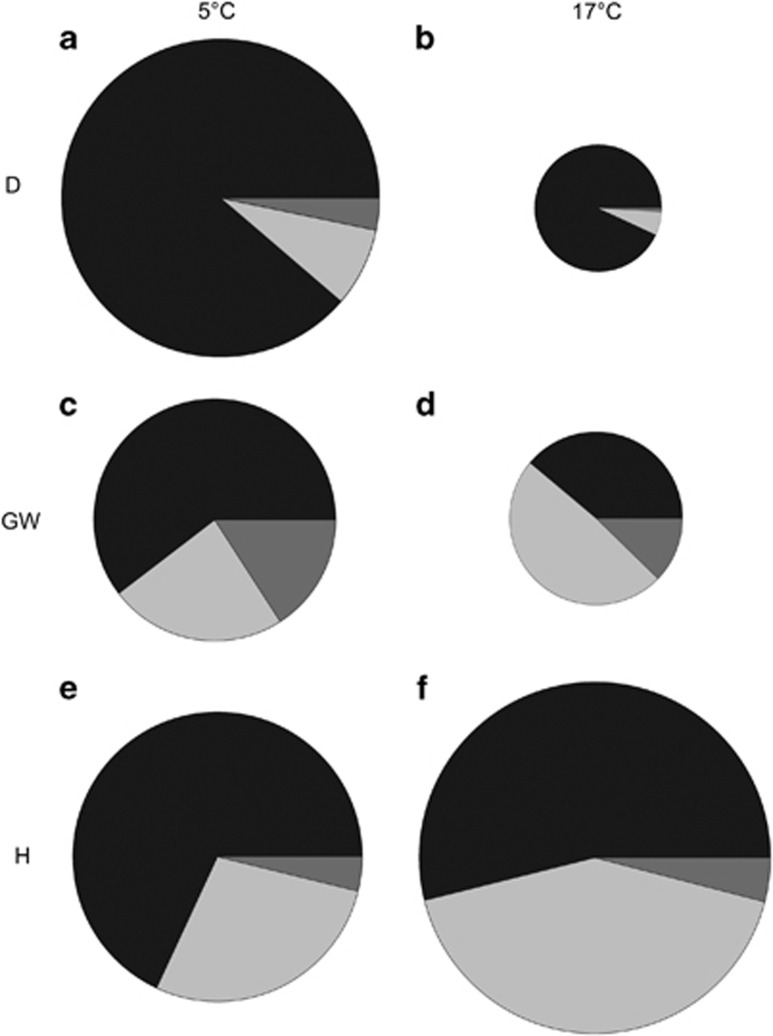
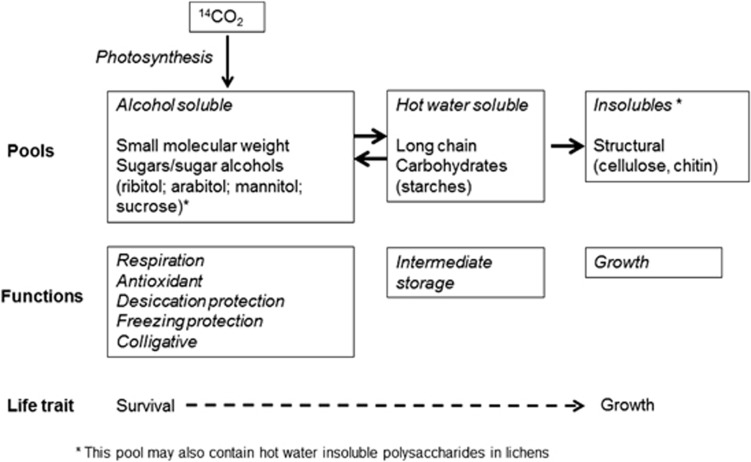
Biological soil crusts (BSC) are the dominant functional vegetation unit in some of the harshest habitats in the world. We assessed BSC response to stress through changes in biotic composition, CO2 gas exchange and carbon allocation in three lichen-dominated BSC from habitats with different stress levels, two more extreme sites in Antarctica and one moderate site in Germany. Maximal net photosynthesis (NP) was identical, whereas the water content to achieve maximal NP was substantially lower in the Antarctic sites, this apparently being achieved by changes in biomass allocation. Optimal NP temperatures reflected local climate. The Antarctic BSC allocated fixed carbon (tracked using (14)CO2) mostly to the alcohol soluble pool (low-molecular weight sugars, sugar alcohols), which has an important role in desiccation and freezing resistance and antioxidant protection. In contrast, BSC at the moderate site showed greater carbon allocation into the polysaccharide pool, indicating a tendency towards growth. The results indicate that the BSC of the more stressed Antarctic sites emphasise survival rather than growth. Changes in BSC are adaptive and at multiple levels and we identify benefits and risks attached to changing life traits, as well as describing the ecophysiological mechanisms that underlie them.
Figures
References
-
- Baur A, Baur B, Fröberg L. Herbivory on calcicolous lichens: different food preferences and growth rates in two co-existing land snails. Oecologia. 1994;98:313–319. - PubMed
-
- Belnap J, Büdel B, Lange OL.2003Biological soil crusts: characteristics and distributionIn: Belnap J, Lange OL, (eds)Biological soil crusts: structure, function, and management. Ecological Studies Vol. 1502nd ednSpringer: Berlin, Heidelberg; 3–30.
-
- Belnap J, Prasse R, Harper KT.2003Influence of biological soil crusts on soil environment and vascular plantsIn: Belnap J, Lange OL (eds)Biological soil crusts: structure, function, and management. Ecological Studies Vol. 150,2nd edn.Springer: Berlin, Heidelberg; 281–302.
-
- Bewley JD, Krochko JE.1982Desiccation-ToleranceIn: Lange OL, Nobel PS, Osmond CB, Ziegler H, (eds)Physiological Plant Ecology 2, Water relations and carbon assimilation, Encyclopedia of Plant Physiology Springer: Berlin; 325–378.
-
- Brodo IM, Sharnoff SD, Sharnoff S.2001PsoraIn: Brodo IM, Sharnoff SD, Láurie-Borque S, (eds)Lichens of North America Yale University Press: New Haven; 597–604.
Publication types
MeSH terms
Substances
LinkOut - more resources
Full Text Sources
Other Literature Sources
Miscellaneous
