. 2014 Jun;4(6):688-701.
doi: 10.1158/2159-8290.CD-13-0593. Epub 2014 Apr 2.

Inflammation-induced NFATc1-STAT3 transcription complex promotes pancreatic cancer initiation by KrasG12D

Affiliations

Inflammation-induced NFATc1-STAT3 transcription complex promotes pancreatic cancer initiation by KrasG12D

Sandra Baumgart et al. Cancer Discov. 2014 Jun.

Abstract

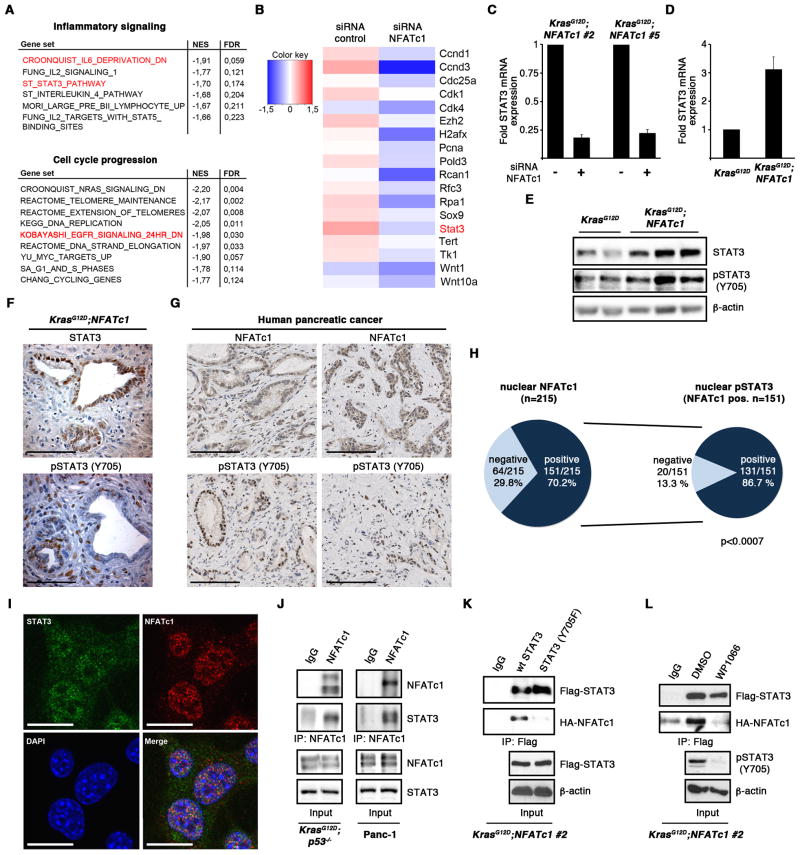
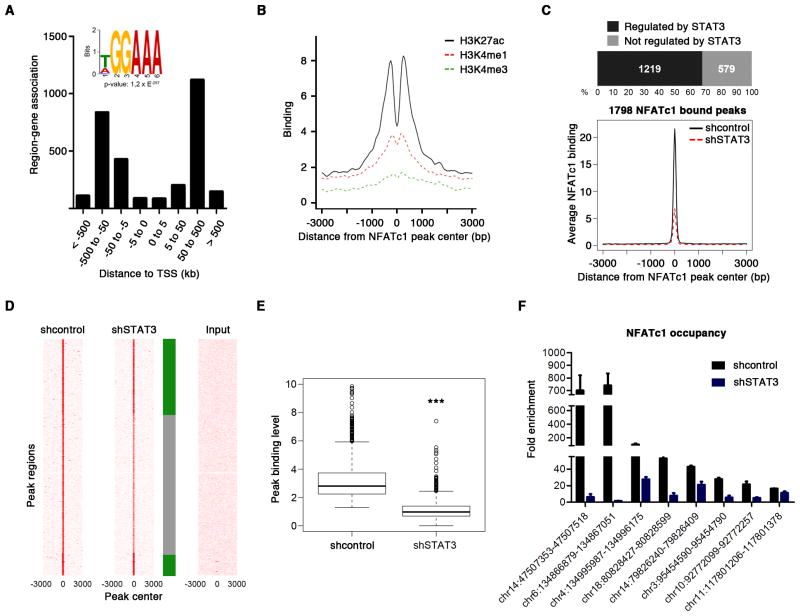
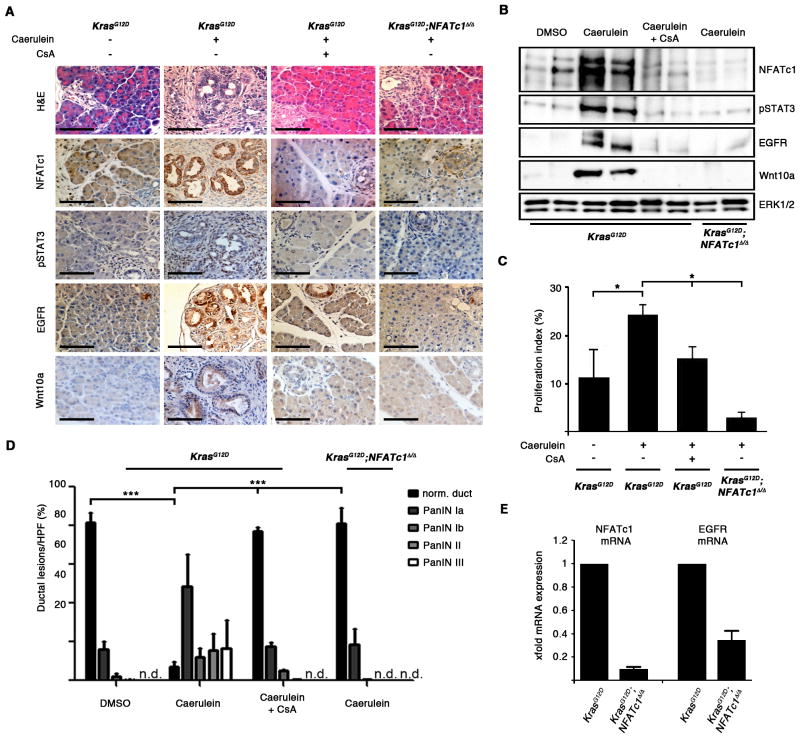
Cancer-associated inflammation is a molecular key feature in pancreatic ductal adenocarcinoma. Oncogenic KRAS in conjunction with persistent inflammation is known to accelerate carcinogenesis, although the underlying mechanisms remain poorly understood. Here, we outline a novel pathway whereby the transcription factors NFATc1 and STAT3 cooperate in pancreatic epithelial cells to promote Kras(G12D)-driven carcinogenesis. NFATc1 activation is induced by inflammation and itself accelerates inflammation-induced carcinogenesis in Kras(G12D) mice, whereas genetic or pharmacologic ablation of NFATc1 attenuates this effect. Mechanistically, NFATc1 complexes with STAT3 for enhancer-promoter communications at jointly regulated genes involved in oncogenesis, for example, Cyclin, EGFR and WNT family members. The NFATc1-STAT3 cooperativity is operative in pancreatitis-mediated carcinogenesis as well as in established human pancreatic cancer. Together, these studies unravel new mechanisms of inflammatory-driven pancreatic carcinogenesis and suggest beneficial effects of chemopreventive strategies using drugs that are currently available for targeting these factors in clinical trials.

Significance: Our study points to the existence of an oncogenic NFATc1-STAT3 cooperativity that mechanistically links inflammation with pancreatic cancer initiation and progression. Because NFATc1-STAT3 nucleoprotein complexes control the expression of gene networks at the intersection of inflammation and cancer, our study has significant relevance for potentially managing pancreatic cancer and other inflammatory-driven malignancies.


Conflict of interest statement

Conflict of interest:

The authors have no conflict of interest to declare.

Figures

Figure 1
Figure 1. NFATc1 accelerates KrasG12D-driven pancreatic carcinogenesis
(A) Generation of Pdx1/p48-Cre-NFATc1 and Pdx1/p48-Cre;KrasG12D;NFATc1 mice after Pdx1/p48-Cre-mediated excision-recombination. (B) Kaplan-Meier curves displaying survival of Pdx1/p48-Cre;KrasG12D;NFATc1 mice compared to Pdx1/p48-Cre;KrasG12D and Pdx1/p48-Cre;NFATc1 mice. (***p < 0.0001 for KrasG12D;NFATc1 versus Pdx1/p48-Cre;KrasG12D cohorts, log-rank test, for pairwise combination) C) Gross anatomy of Pdx1/p48-Cre;KrasG12D;NFATc1 mice before (upper panel) and after (lower panel) pancreatic tumor extraction. (D) H&E stained section from Pdx1/p48-Cre;KrasG12D;NFATc1 mice demonstrating the presence of ADM (1I), PanIN lesion (1II–III, 2II–III), AFL (2I), invasive cancer (3I–III) and liver metastases (3III). Scale bars equal 200 μm(1I, 3I) and 100 μm (1II–III, 2I–III, 3II–III).
Figure 2
Figure 2. Characteristic features of KrasG12D;NFATc1 mice tumors
(A) Tumor onset in cohorts of p48-Cre;KrasG12D;NFATc1 and p48-Cre;KrasG12D mice. Note that 100% of p48-Cre;KrasG12D;NFATc1 mice develop PDA at 36 weeks. ***p< 0,001. (B) H&E (top panel) and corresponding CK-19 stainings (bottom panel) of representative KrasG12D;NFATc1 mice tumors illustrating G2, G3 and anaplastic PDAs. (C) NFATc1 staining in PanIN precursor and invasive pancreatic cancer lesions from p48-Cre;KrasG12D;NFATc1 mice and human PDA samples. (D) Proliferation index was measured in Ki67-stained pancreatic sections (n ≥ 3, Means ± SE). P-values are * p < 0.05. (E) Pancreas lysates from 4- and 8-week old p48-Cre;KrasG12D;NFATc1 mice were tested for p16INK4A and CDK4 expression. Scale bars in all images equal 100 μm.
Figure 3
Figure 3. Existence of a nuclear NFATc1-STAT3 complex in pancreatic cancer
(A) Genome-wide expression and GSEA analysis in p48-Cre;KrasG12D;NFATc1 tumor cells. Negative normalized enrichment score (NES) indicates loss of gene enrichment upon NFATc1 knockdown (additional information in Supplementary Table 1). (B) Heatmap showing selection of differentially regulated genes in p48-Cre;KrasG12D;NFATc1 tumor cells depending on NFATc1 expression. Fold change relative to control cells is displayed in a blue–white–red pseudo color scheme for selected genes with FClog2 < 1.5 or FClog2 > −1.5. STAT3 expression changes are highlighted in red (details in Supplementary Table 2). (C) Quantitative RT-PCR displaying STAT3 expression upon NFATc1 depletion in p48-Cre;KrasG12D;NFATc1 derived tumor cell clones. (D, E) Pancreatic lysates from p48-Cre;KrasG12D;NFATc1 and p48-Cre;KrasG12D mice were assessed for (D) STAT3 mRNA expression, or (E) total STAT3 protein expression and phosphorylation of STAT3 at Y705 (pSTAT3 (Y705)). (F, G) Immunohistochemical analysis for (F) STAT3 and pSTAT3 (Y705) in p48-Cre;KrasG12D;NFATc1 mice tumors and (G) NFATc1 and pSTAT3 (Y705) in human PDA. Scale bars equal 100 μm. (H) Statistical illustration of TMA analysis (n=215 patients) demonstrating high correlative expression levels of nuclear NFATc1 and p-STAT3 in human PDA tissues. (I) Immunofluorescence staining displays intracellular localization of STAT3 (green) and NFATc1 (red) in p48-Cre;KrasG12D;NFATc1 tumor cells. Nuclei are visualized by Hoechst staining (blue). (J) Co-immunoprecipitation of endogenous NFATc1 and STAT3 was performed in murine KrasG12D;p53−/− PDA cells and human Panc1 cells upon TGF-β and IL-6 treatment. (K, L) Co-immunoprecipitation for NFATc1 and STAT3 in p48-Cre;KrasG12D;NFATc1 derived cells transfected with Flag-tagged wt-STAT3 and (K) Flag-STAT3 (Y705F) or (L) treated with 1 μM WP1066 for 3 h (blocking STAT3 (Y705) phosphorylation).
Figure 4
Figure 4. STAT3-dependent NFATc1 binding at enhancer-specific target sites
(A) ChIP-seq analysis and region-gene association studies revealed preferential NFATc1 long distance binding from annotated transcriptional start sites with particular enrichment between 50 and 500 kb up- and downstream of transcription start site (TSS). De novo identification of overrepresented motifs using the MEME algorithm revealed the published NFAT consensus site GGAAA (displayed in insert) as best hit. (http://meme.sdsc.edu/meme/cgi-bin/meme-chip.cgi). (B) Superposition for enhancer-specific (H3K27ac and H3K4me1) and promoter-specific (H3K4me3) histone modifications shows enrichment of enhancer marks peaking with a typical bimodal distribution centered on NFATc1 peak positions. (C) DESeq statistics reveals STAT3 dependence of genome-wide NFATc1 binding (bar chart). The average binding across the 1798 NFATc1 peak intervals was determined in KrasG12D;NFATc1 and KrasG12D;NFATc1-shSTAT3 cells. Significance for lost NFATc1 binding in STAT3-depleted cells is demonstrated by Wilcoxon signed rank test: p= 0. (D) A region map of a 10-kb window is shown displaying genomic NFATc1 binding derived from ChIP sequencing in stable KrasG12D;NFATc1 scramble and shSTAT3 tumor cells. K-means clustering identified a large group of STAT3-dependent NFATc1 binding sites (grey bar). (E) The average binding across the 1798 NFATc1 peak intervals was determined in KrasG12D;NFATc1 scramble and shSTAT3 cells. Overall, NFATc1 binding is significantly reduced in cells with decreased STAT3 levels (Wilcoxon signed rank test: p=2.225074×10−308). (F) ChIP analysis displays NFATc1 binding at randomly selected enhancer regions in STAT3-depleted cells. Means ± SD are shown from one out of three independent experiments.
Figure 5
Figure 5. NFATc1-STAT3 complexes regulate gene networks involved in cancer progression
(A, B) ChIP analysis determines (A) NFATc1 binding or (B) H3K4me1 and H3K27ac at identified enhancer regions of selected target genes. Means ± SD are shown from one out of three independent experiments. (C) Histograms of ChIP fragment coverage for STAT3 dependent NFATc1 binding at the EGFR genomic region (chromosome 7:92436000-92444000). (D) KrasG12D;NFATc1 cells stably depleted for STAT3 expression were transfected with wt-STAT3 or STAT3 (Y705F) and ChIP was performed to assess NFATc1 binding at selected targets. (E) KrasG12D;NFATc1 cells were transfected with increasing amounts of STAT3 (200 to 500ng) along with a RCAN1 promoter + enhancer reporter construct which harbors a wild-type or mutant NFATc1 binding site within the enhancer (as illustrated in the upper cartoon). Note that disruption of the NFAT enhancer binding sequence abolishes STAT3 mediated transactivation. Results in (D, E) are shown as means ± SD from triplicates. (F) Murine p48-Cre;KrasG12D;NFATc1 and human PDA tissues were analysed for EGFR expression. Scale bars equal 100 μM. (G) Western Blot demonstrating time-dependent decrease of EGFR expression in KrasG12D;NFATc1 PDA cells upon CsA treatment. Displayed are measured expression intensities (%) related to the untreated control. (H) Relative expression of respective mRNAs in KrasG12D;NFATc1 tumor cells with and without transient NFATc1 knockdown. Data are shown as fold change compared with controls. Representative results from at least three independent experiments are shown. Means ± SD. (I) Reduced EGFR protein expression levels in murine KrasG12D;p53−/− PDA cells upon genetic NFATc1 depletion. Means ± SD. (J) Effect of NFAT inhibition by CsA (24h) on mRNA expression of target genes in human Panc1 cells. Data are shown as fold change compared with controls. Representative results from at least three independent experiments are shown. Means ± SD.
Figure 6
Figure 6. NFATc1 activation is required for pancreatitis-promoted carcinogenesis
(A) Immunohistochemical H&E, NFATc1, pSTAT3, EGFR and Wnt10a staining in Pdx-1;KrasG12D and Pdx1-KrasG12D;NFATc1Δ/Δ mice after indicated treatment showing an NFAT-dependent target gene induction during KrasG12D-driven carcinogenesis. Scale bars in all images equal 100 μM. (B) Western Blot analysis of Pdx-1;KrasG12D and Pdx1-KrasG12D;NFATc1Δ/Δ mice tissues for NFATc1, pSTAT3, EGFR and Wnt10a expression upon treatment with caerulein and CsA as indicated. ERK1/2 serves as loading control. (C) Proliferation index was measured in Ki67-stained pancreatic sections (n ≥ 3). Means ± SE. p-values are related to Pdx1-KrasG12D control cohorts or treated KrasG12D cohorts as indicated. *p < 0.05. (D) Quantification of normal and pre-neoplastic ducts in Pdx1-KrasG12D and Pdx1-KrasG12D;NFATc1Δ/Δ mice upon treatment as indicated. Means ± SD (n ≥ 4), p-values are calculated in relation to untreated KrasG12D control cohorts or treated KrasG12D mice as indicated. *** p< 0.0001. n.d., not detectable. (E) Quantitative real-time PCR illustrating reduced EGFR mRNA expression in cultured acinar cell explants with NFATc1 inactivation (KrasG12D;NFATc1Δ/Δ versus KrasG12D).

References

    1. Warshaw AL, Fernández-del Castillo C. Pancreatic carcinoma. N Engl J Med. 1992;326:455–65. - PubMed
    1. Hidalgo M. Pancreatic cancer. N Engl J Med. 2010;362:1605–17. - PubMed
    1. Maitra A, Hruban RH. Pancreatic cancer. Annu Rev Pathol. 2008;3:157–88. - PMC - PubMed
    1. Hingorani SR, Petricoin EF, Maitra A, Rajapakse V, King C, Jacobetz MA, et al. Preinvasive and invasive ductal pancreatic cancer and its early detection in the mouse. Cancer Cell. 2003;4:437–50. - PubMed
    1. Pylayeva-Gupta Y, Lee KE, Hajdu CH, Miller G, Bar-Sagi D. Oncogenic Kras-induced GM-CSF production promotes the development of pancreatic neoplasia. Cancer Cell. 2012;21:836–47. - PMC - PubMed

Publication types

MeSH terms