

Integrated analysis of copy number variation and genome-wide expression profiling in colorectal cancer tissues
- PMID: 24694993
- PMCID: PMC3973632
- DOI: 10.1371/journal.pone.0092553
Integrated analysis of copy number variation and genome-wide expression profiling in colorectal cancer tissues
Abstract
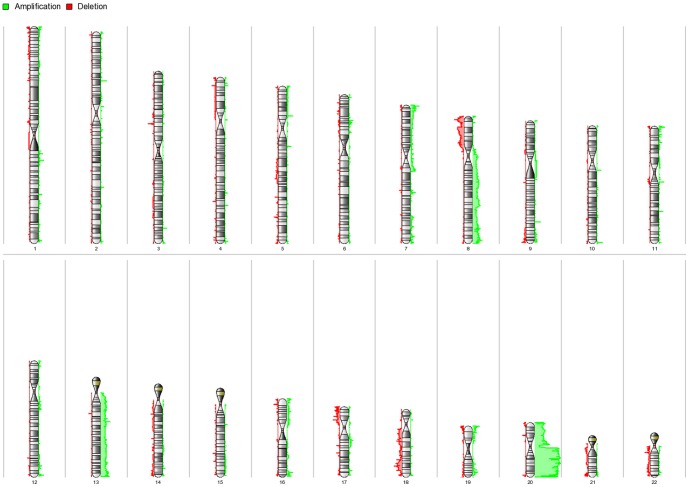
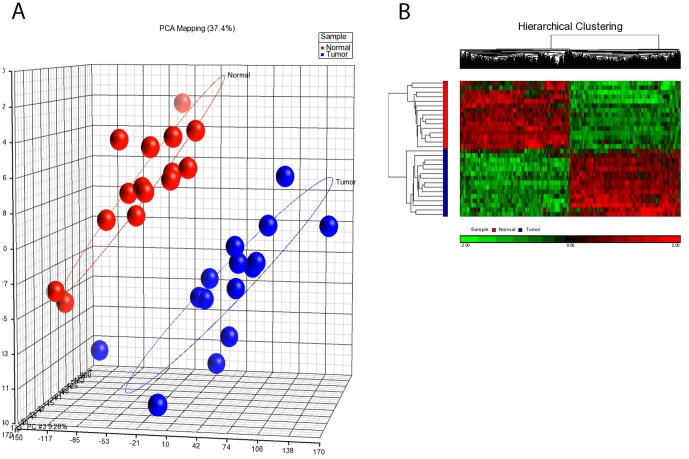
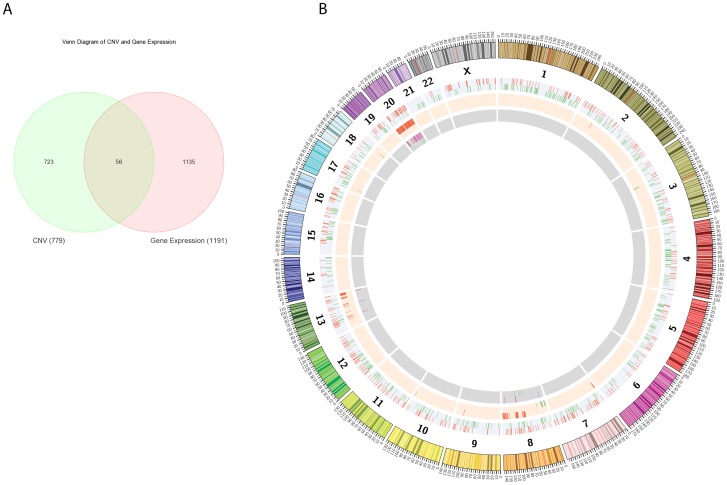
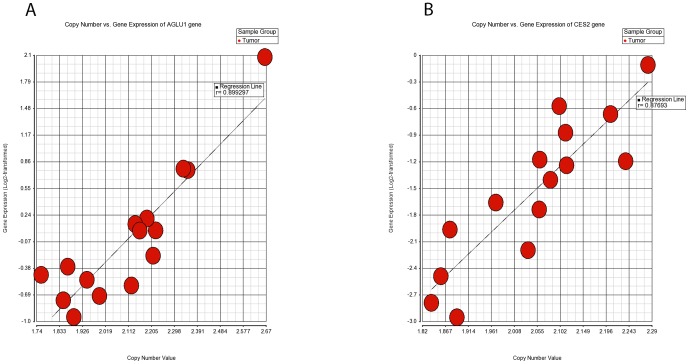
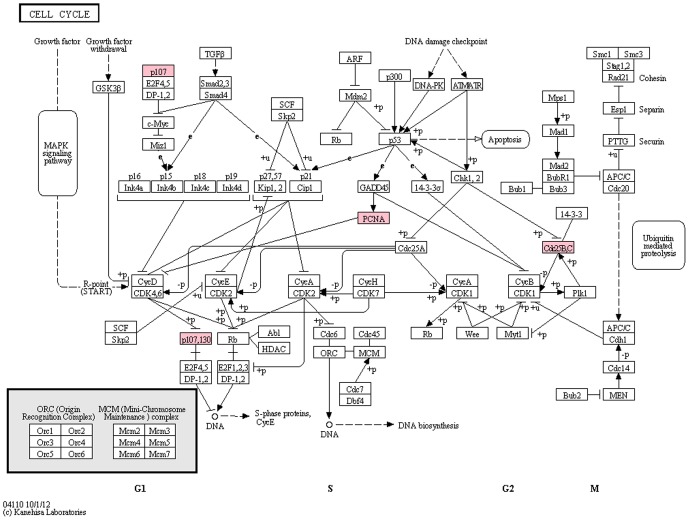
Integrative analyses of multiple genomic datasets for selected samples can provide better insight into the overall data and can enhance our knowledge of cancer. The objective of this study was to elucidate the association between copy number variation (CNV) and gene expression in colorectal cancer (CRC) samples and their corresponding non-cancerous tissues. Sixty-four paired CRC samples from the same patients were subjected to CNV profiling using the Illumina HumanOmni1-Quad assay, and validation was performed using multiplex ligation probe amplification method. Genome-wide expression profiling was performed on 15 paired samples from the same group of patients using the Affymetrix Human Gene 1.0 ST array. Significant genes obtained from both array results were then overlapped. To identify molecular pathways, the data were mapped to the KEGG database. Whole genome CNV analysis that compared primary tumor and non-cancerous epithelium revealed gains in 1638 genes and losses in 36 genes. Significant gains were mostly found in chromosome 20 at position 20q12 with a frequency of 45.31% in tumor samples. Examples of genes that were associated at this cytoband were PTPRT, EMILIN3 and CHD6. The highest number of losses was detected at chromosome 8, position 8p23.2 with 17.19% occurrence in all tumor samples. Among the genes found at this cytoband were CSMD1 and DLC1. Genome-wide expression profiling showed 709 genes to be up-regulated and 699 genes to be down-regulated in CRC compared to non-cancerous samples. Integration of these two datasets identified 56 overlapping genes, which were located in chromosomes 8, 20 and 22. MLPA confirmed that the CRC samples had the highest gains in chromosome 20 compared to the reference samples. Interpretation of the CNV data in the context of the transcriptome via integrative analyses may provide more in-depth knowledge of the genomic landscape of CRC.
Conflict of interest statement
Figures
References
-
- Cunningham D, Atkin W, Lenz HJ, Lynch HT, Minsky B, et al. (2010) Colorectal cancer. Lancet 375: 1030–1047. - PubMed
-
- Jemal A, Bray F, Center MM, Ferlay J, Ward E, et al. (2011) Global cancer statistics. CA: a cancer journal for clinicians 61: 69–90. - PubMed
-
- Zainal Ariffin O, Nor Saleha IT (2011) National Cancer Registry Report 2007. Kuala Lumpur: Ministry of Health.
-
- Issa JP (2008) Colon cancer: it's CIN or CIMP. Clinical cancer research : an official journal of the American Association for Cancer Research 14: 5939–5940. - PubMed
-
- Gordon DJ, Resio B, Pellman D (2012) Causes and consequences of aneuploidy in cancer. Nature reviews Genetics 13: 189–203. - PubMed
Publication types
MeSH terms
LinkOut - more resources
Full Text Sources
Other Literature Sources
Medical
Molecular Biology Databases
Research Materials
