. 2014 Apr 2;9(4):e93269.
doi: 10.1371/journal.pone.0093269. eCollection 2014.

Full genome virus detection in fecal samples using sensitive nucleic acid preparation, deep sequencing, and a novel iterative sequence classification algorithm

Affiliations

Full genome virus detection in fecal samples using sensitive nucleic acid preparation, deep sequencing, and a novel iterative sequence classification algorithm

Matthew Cotten et al. PLoS One. .

Abstract

We have developed a full genome virus detection process that combines sensitive nucleic acid preparation optimised for virus identification in fecal material with Illumina MiSeq sequencing and a novel post-sequencing virus identification algorithm. Enriched viral nucleic acid was converted to double-stranded DNA and subjected to Illumina MiSeq sequencing. The resulting short reads were processed with a novel iterative Python algorithm SLIM for the identification of sequences with homology to known viruses. De novo assembly was then used to generate full viral genomes. The sensitivity of this process was demonstrated with a set of fecal samples from HIV-1 infected patients. A quantitative assessment of the mammalian, plant, and bacterial virus content of this compartment was generated and the deep sequencing data were sufficient to assembly 12 complete viral genomes from 6 virus families. The method detected high levels of enteropathic viruses that are normally controlled in healthy adults, but may be involved in the pathogenesis of HIV-1 infection and will provide a powerful tool for virus detection and for analyzing changes in the fecal virome associated with HIV-1 progression and pathogenesis.


Conflict of interest statement

Competing Interests: The authors have declared that no competing interests exist.

Figures

Figure 1
Figure 1. An overview of the ViSeq process.
Figure 2
Figure 2. An overview of the SLIM read classification process.
Figure 3
Figure 3. Detection of norovirus by real-time PCR vs the ViSeq process.
Total ViSeq identified norovirus reads were compared to the Real time PCR determined norovirus viral loads. Pearson's correlation coefficient for all samples (−0.69), for all samples with Ct values below 35 (0.63) and for all samples with ViSeq reads above 10, (−0.59), indicate a strong negative correlation between the two methods of measurements.
Figure 4
Figure 4. Taxonomy of reads in each sample.
100,000 random reads from each sample dataset were subject to a nucleotide BLASTN search and hits with e values less than 0.001 were collected, and processed with MEGAN4 (see Materials and Methods). The Megan output was processed using Python script to generate a heat map of total reads in each sample in each category. Values were grouped into 5 categories and depicted with the following colors: less than 0 reads, white; 1–50 reads, grey; 51–500 reads, dark grey; 501 to 5000 reads, light green; 5001 to 50,000 reads, green, >50,000 reads, dark green (also see color bar scale to right of figure).
Figure 5
Figure 5. A demonstration of SLIM function.
100,000 random reads reads from sample 17 were processed with SLIM. For each cycle, the number of reads classified as virus, non-virus and mystery, the number of reads removed and the number of reads remaining are plotted. The cycle number and elapsed time is indicated below the graph, the cycle of identification of specific viruses is marked in the upper (virus_reads) graph.
Figure 6
Figure 6. Quantitation of specific virus reads in each of the 20 samples.
All reads for each sample (see Table 1 for total number of reads per samples) were mapped to the indicated viral genomes using MUMmer . The number of reads mapped to each virus (normalized for total reads in each sample) is depicted by color (see color bar scale to right of figure).
Figure 7
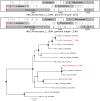
Figure 7. Open reading frame structure and phylogenetic analysis of the adenovirus genomes identified in this study.
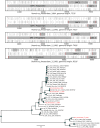
The ORF pattern of the full genomes grey (for all ORFs >100 amino acids in length), with the initial ATG in each ORF (vertical red bar) and all stop codons (vertical black bars) are indicated. For clarity the stop codon positions were not marked in the adenovirus genomes. Also shown are the maximum likelihood trees inferred using PhyML version 3.0 under the general-time reversible substitution model. Among-site heterogeneity was considered through a discrete-gamma distribution model, and the robustness of the phylogeny assessed through bootstrap analysis of 1000 pseudo-replicates. The trees are marked with green node circles indicating the bootstrap support, (small green circle at 70% support, larger green circle at 100% support, black nodes indicate support below 70%). The genomes identified in this study are marked in red.
Figure 8
Figure 8. Open reading frame structure and phylogenetic analysis of the human cosavirus genome identified in this study.
Analysis and graphical presentation was performed as described in the legend to Figure 7.
Figure 9
Figure 9. Open reading frame structure and phylogenetic analysis of the hepatitis B virus genomes identified in this study.
Analysis and graphical presentation was performed as described in the legend to Figure 7. The HBV reference genome set was from reference .
Figure 10
Figure 10. Open reading frame structure and phylogenetic analysis of the human papillomavirus genome identified in this study.
Analysis and graphical presentation was performed as described in the legend to Figure 7. The HPV reference genomes are from reference , For the phylogenetic analysis, the ORFS for E6-E7-E1-E2-L2-L1 were concatenated.
Figure 11
Figure 11. Open reading frame structure and phylogenetic analysis of the norovirus genomes identified in this study.
Analysis and graphical presentation was performed as described in the legend to Figure 7.
Figure 12
Figure 12. Open reading frame structure and phylogenetic analysis of the Torque teno virus genomes identified in this study.
Analysis and graphical presentation was performed as described in the legend to Figure 7. The TTV reference set was from reference .

References

    1. Woolhouse M, Scott F, Hudson Z, Howey R, Chase-Topping M (2012) Human viruses: discovery and emergence. Philos Trans R Soc Lond B Biol Sci 367: 2864–2871. - PMC - PubMed
    1. Ge X, Li Y, Yang X, Zhang H, Zhou P, et al. (2012) Metagenomic analysis of viruses from bat fecal samples reveals many novel viruses in insectivorous bats in China. J Virol 86: 4620–4630. - PMC - PubMed
    1. Donaldson EF, Haskew AN, Gates JE, Huynh J, Moore CJ, et al. (2010) Metagenomic analysis of the viromes of three North American bat species: viral diversity among different bat species that share a common habitat. J Virol 84: 13004–13018. - PMC - PubMed
    1. Li L, Victoria JG, Wang C, Jones M, Fellers GM, et al. (2010) Bat guano virome: predominance of dietary viruses from insects and plants plus novel mammalian viruses. J Virol 84: 6955–6965. - PMC - PubMed
    1. Phan TG, Kapusinszky B, Wang C, Rose RK, Lipton HL, et al. (2011) The fecal viral flora of wild rodents. PLoS Pathog 7: e1002218. - PMC - PubMed

Publication types