. 2014 Apr 10;508(7495):199-206.
doi: 10.1038/nature13185. Epub 2014 Apr 2.

Transcriptional landscape of the prenatal human brain

Jeremy A Miller  1 Song-Lin Ding  1 Susan M Sunkin  2 Kimberly A Smith  2 Lydia Ng  2 Aaron Szafer  2 Amanda Ebbert  2 Zackery L Riley  2 Joshua J Royall  2 Kaylynn Aiona  2 James M Arnold  2 Crissa Bennet  2 Darren Bertagnolli  2 Krissy Brouner  2 Stephanie Butler  2 Shiella Caldejon  2 Anita Carey  2 Christine Cuhaciyan  2 Rachel A Dalley  2 Nick Dee  2 Tim A Dolbeare  2 Benjamin A C Facer  2 David Feng  2 Tim P Fliss  2 Garrett Gee  2 Jeff Goldy  2 Lindsey Gourley  2 Benjamin W Gregor  2 Guangyu Gu  2 Robert E Howard  2 Jayson M Jochim  2 Chihchau L Kuan  2 Christopher Lau  2 Chang-Kyu Lee  2 Felix Lee  2 Tracy A Lemon  2 Phil Lesnar  2 Bergen McMurray  2 Naveed Mastan  2 Nerick Mosqueda  2 Theresa Naluai-Cecchini  3 Nhan-Kiet Ngo  2 Julie Nyhus  2 Aaron Oldre  2 Eric Olson  2 Jody Parente  2 Patrick D Parker  2 Sheana E Parry  2 Allison Stevens  4 Mihovil Pletikos  5 Melissa Reding  2 Kate Roll  2 David Sandman  2 Melaine Sarreal  2 Sheila Shapouri  2 Nadiya V Shapovalova  2 Elaine H Shen  2 Nathan Sjoquist  2 Clifford R Slaughterbeck  2 Michael Smith  2 Andy J Sodt  2 Derric Williams  2 Lilla Zöllei  6 Bruce Fischl  4 Mark B Gerstein  7 Daniel H Geschwind  8 Ian A Glass  3 Michael J Hawrylycz  2 Robert F Hevner  9 Hao Huang  10 Allan R Jones  2 James A Knowles  11 Pat Levitt  12 John W Phillips  2 Nenad Sestan  5 Paul Wohnoutka  2 Chinh Dang  2 Amy Bernard  2 John G Hohmann  2 Ed S Lein  2
Affiliations

Transcriptional landscape of the prenatal human brain

Jeremy A Miller et al. Nature. .

Abstract

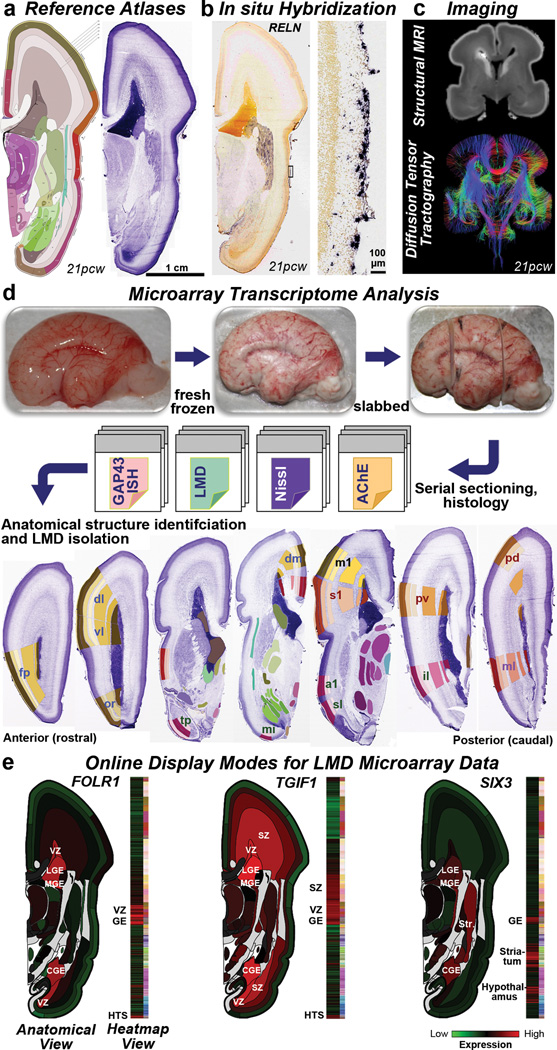
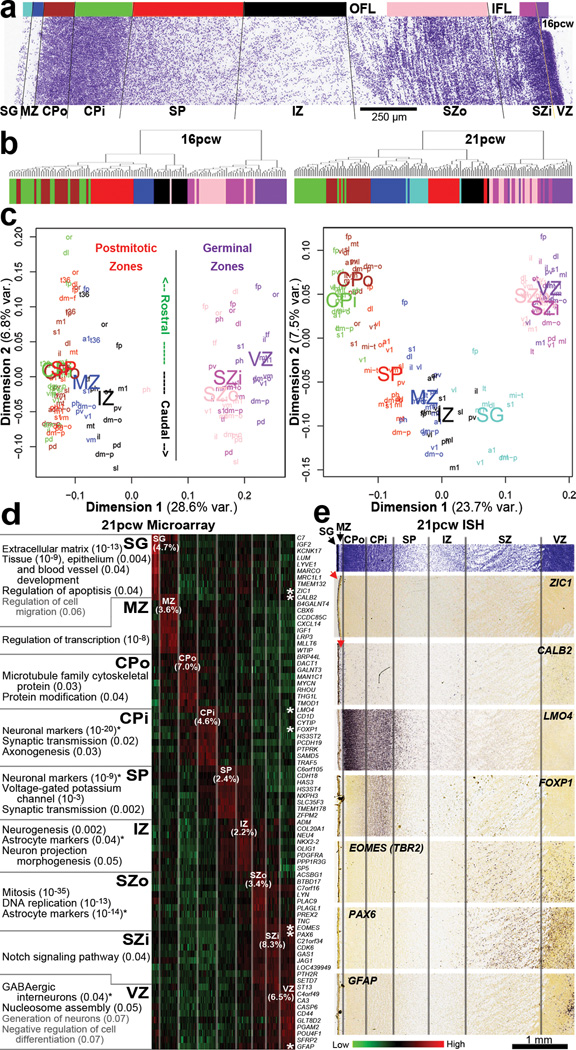
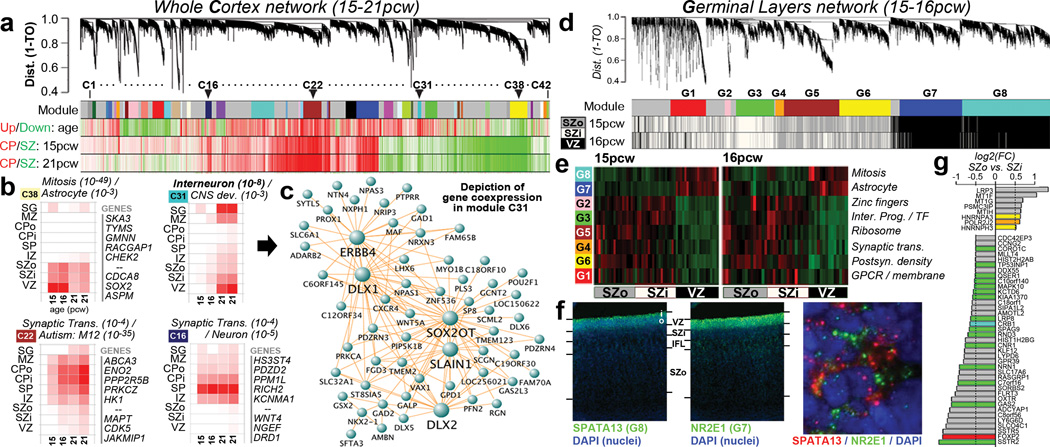
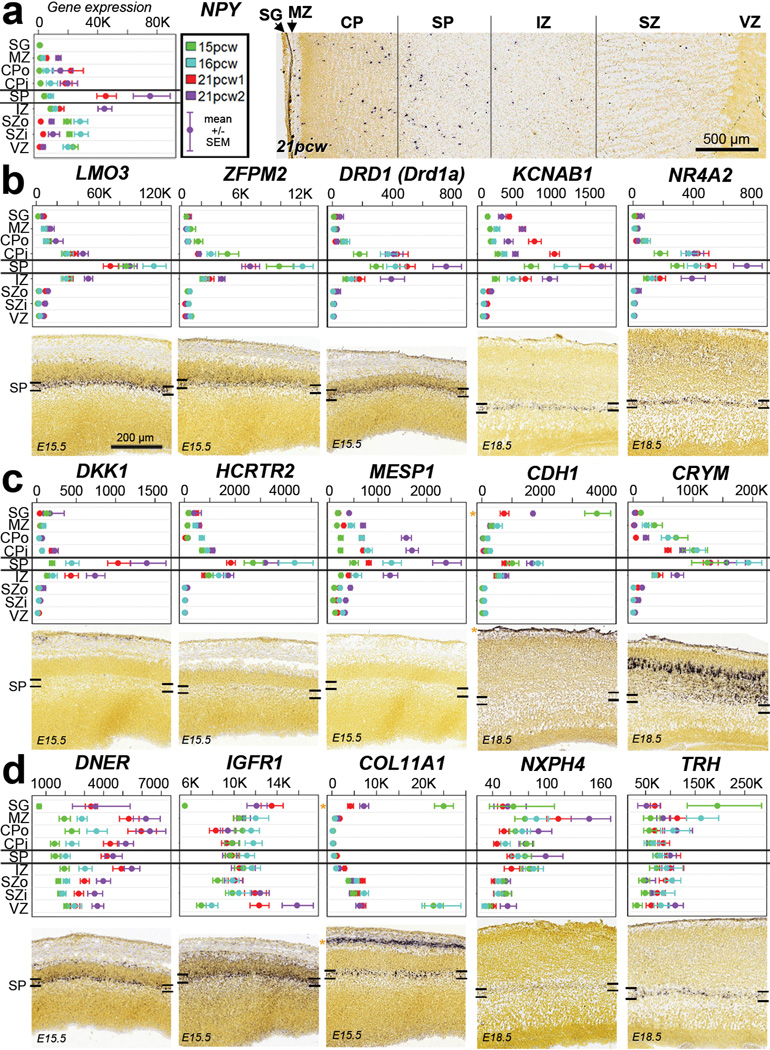
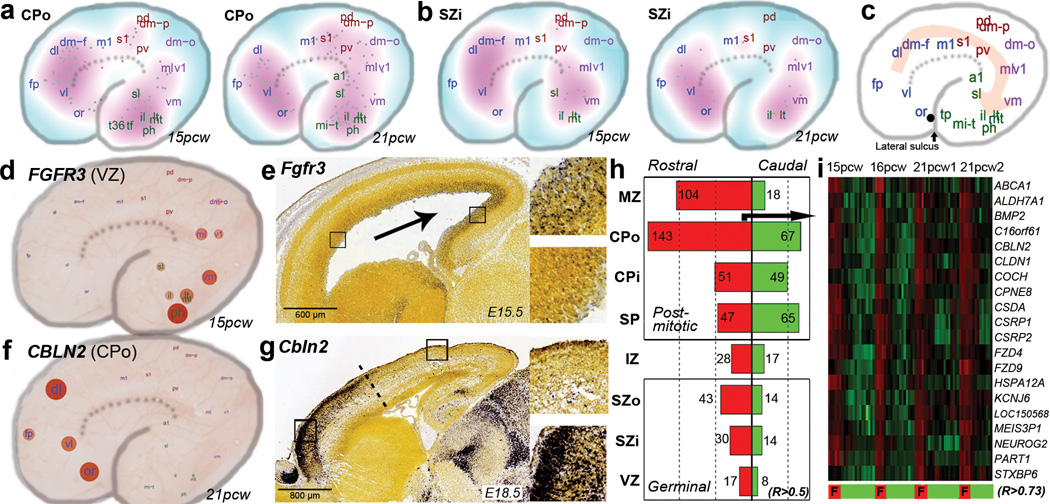
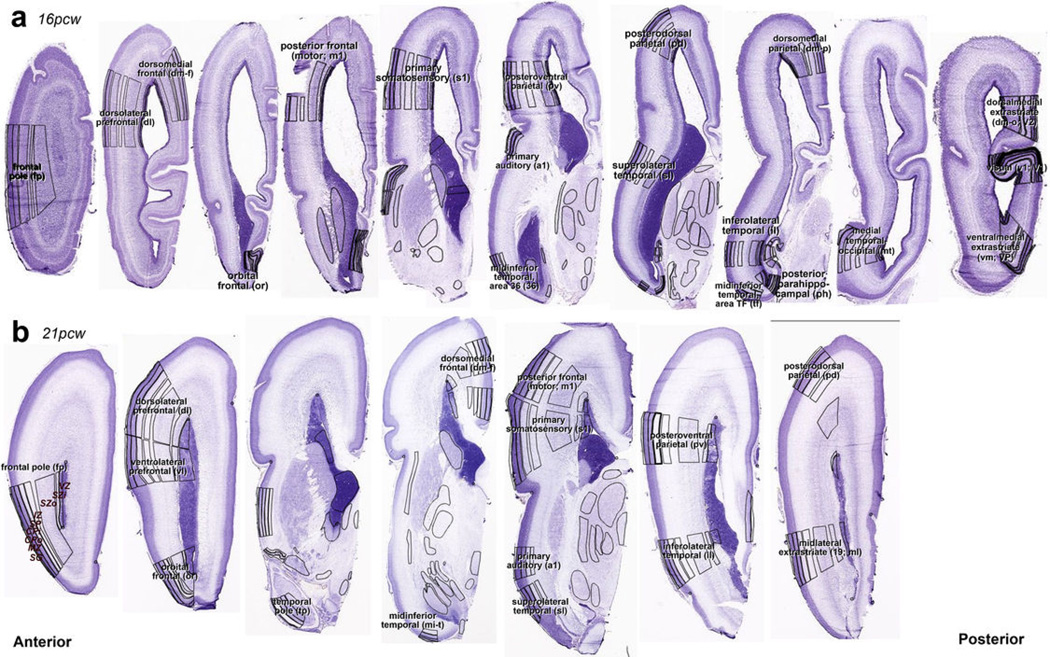
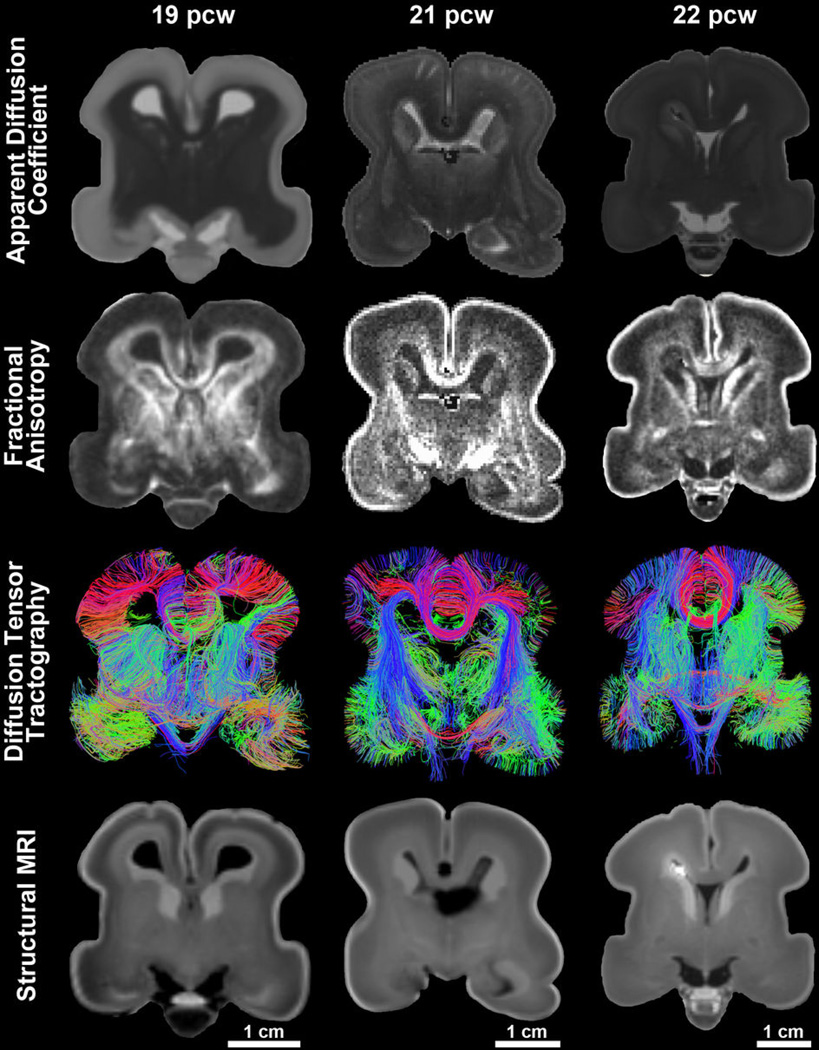
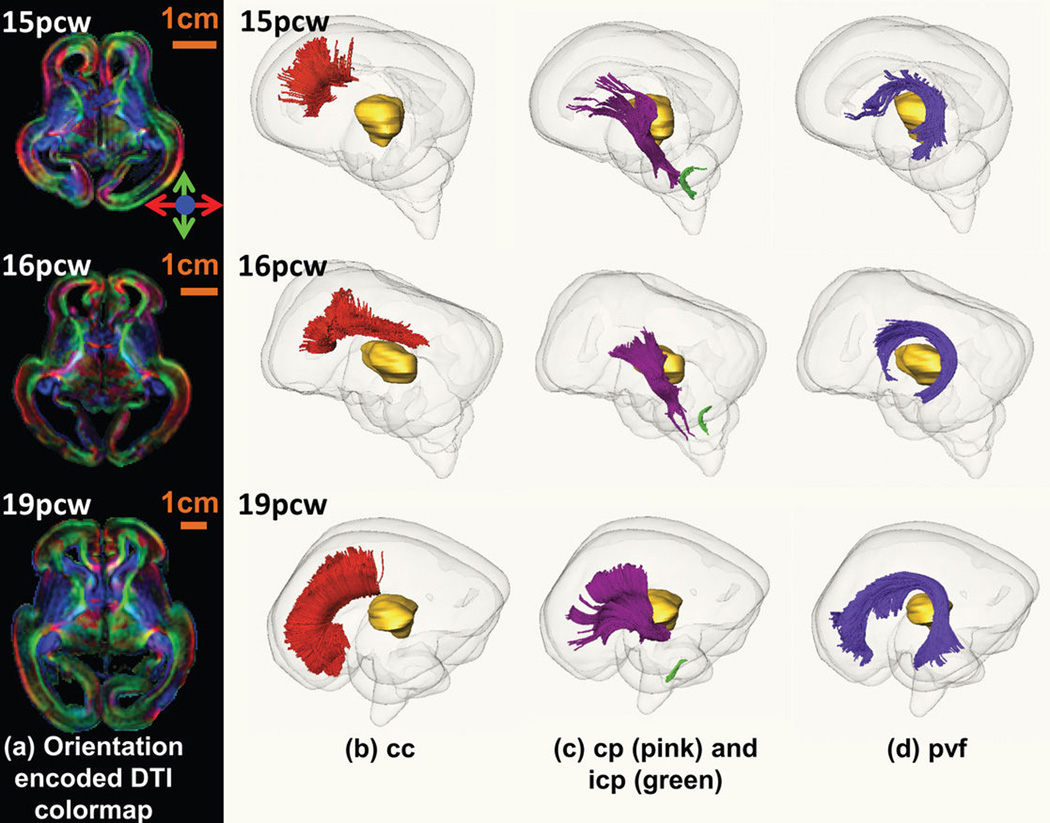
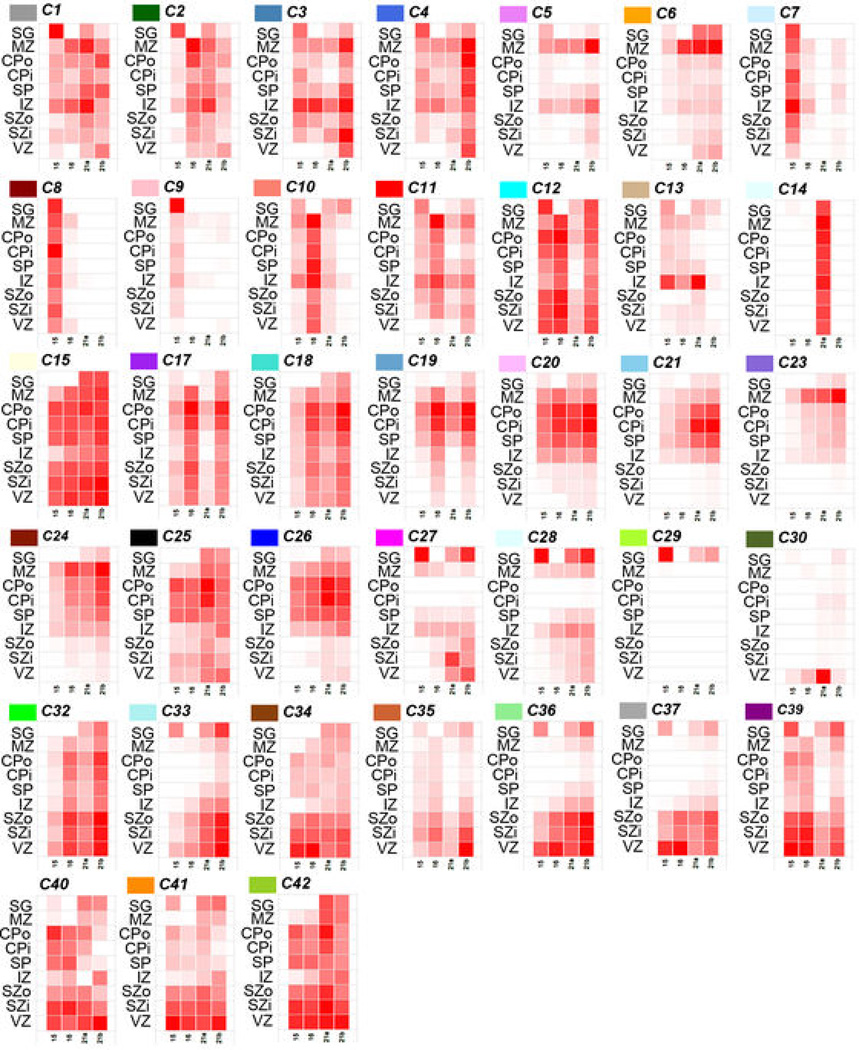
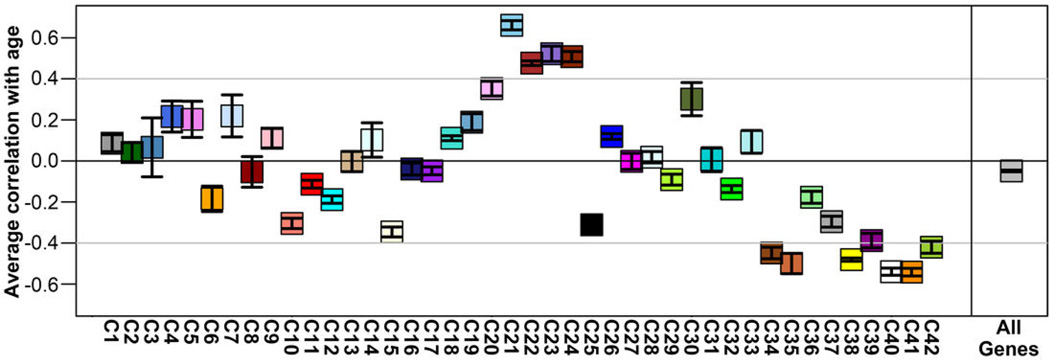
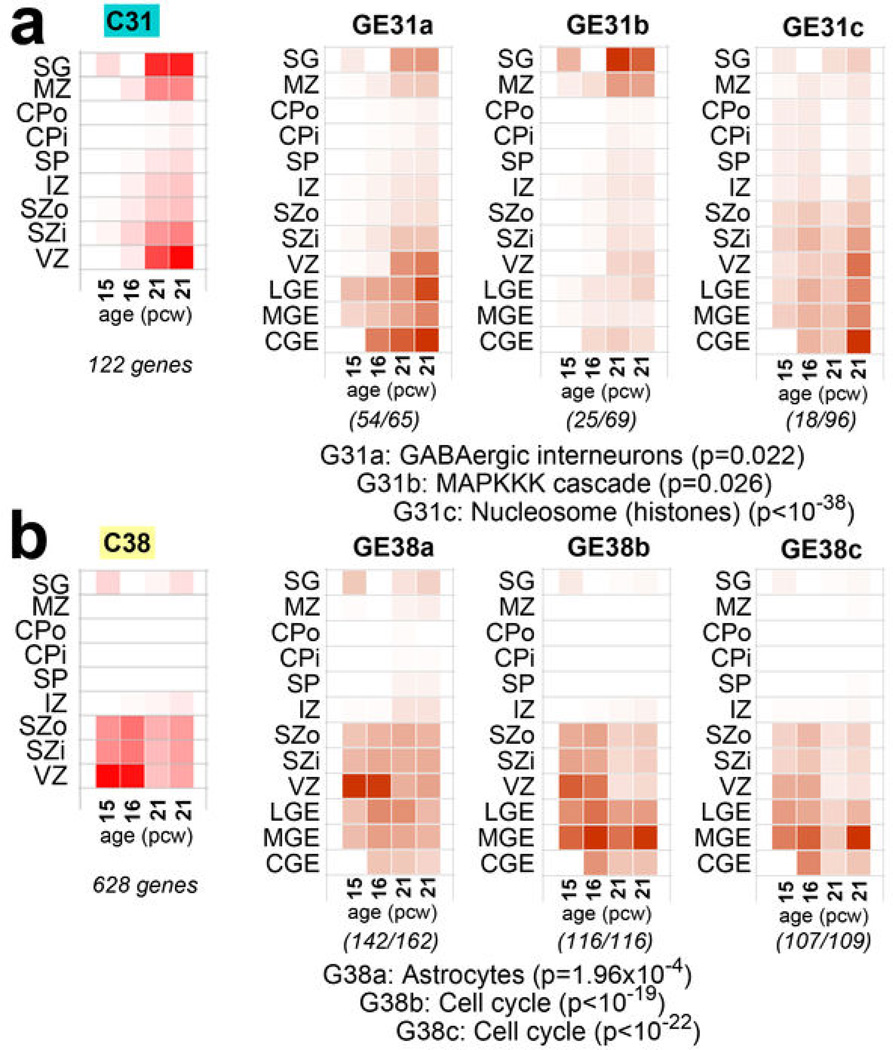
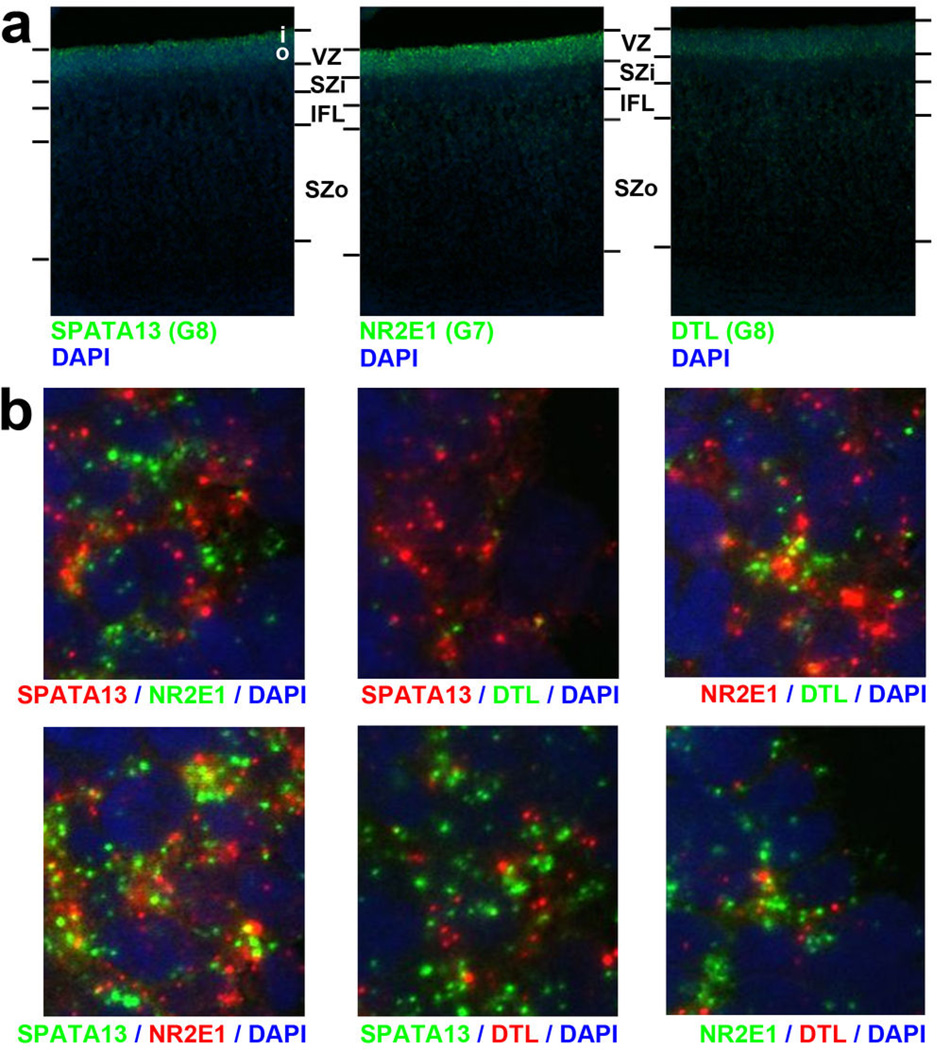
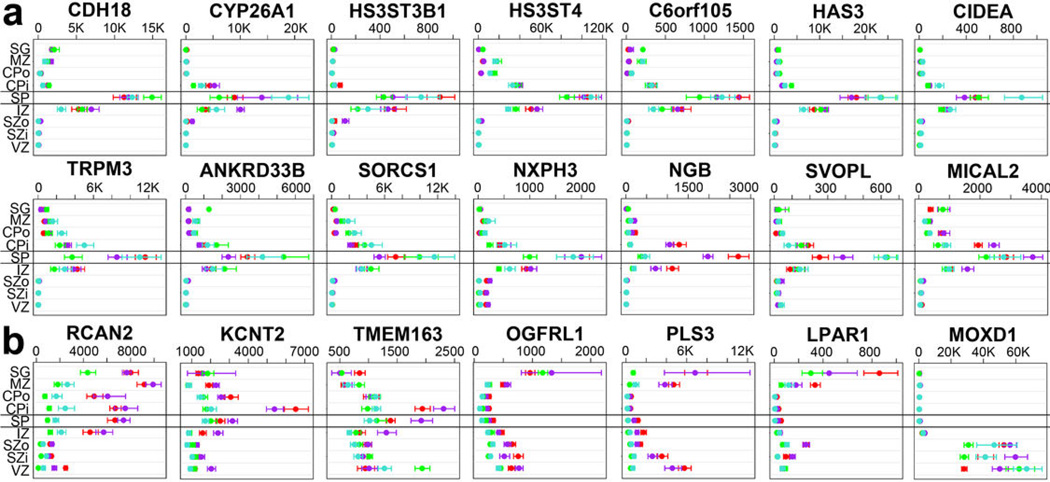
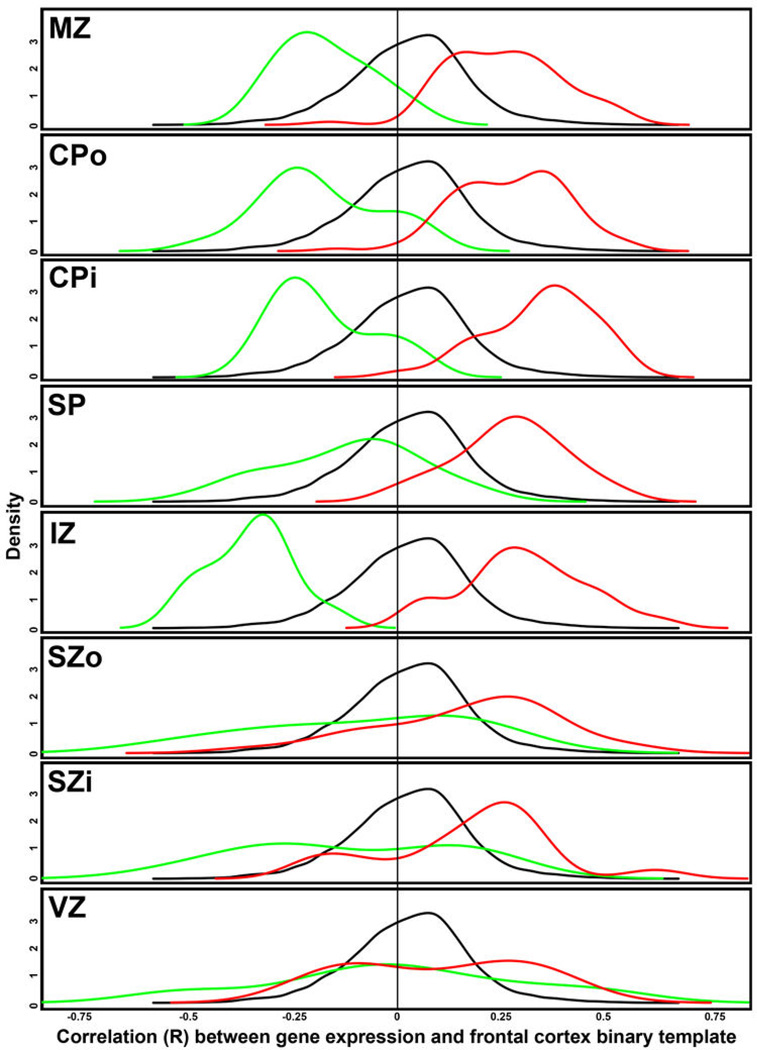
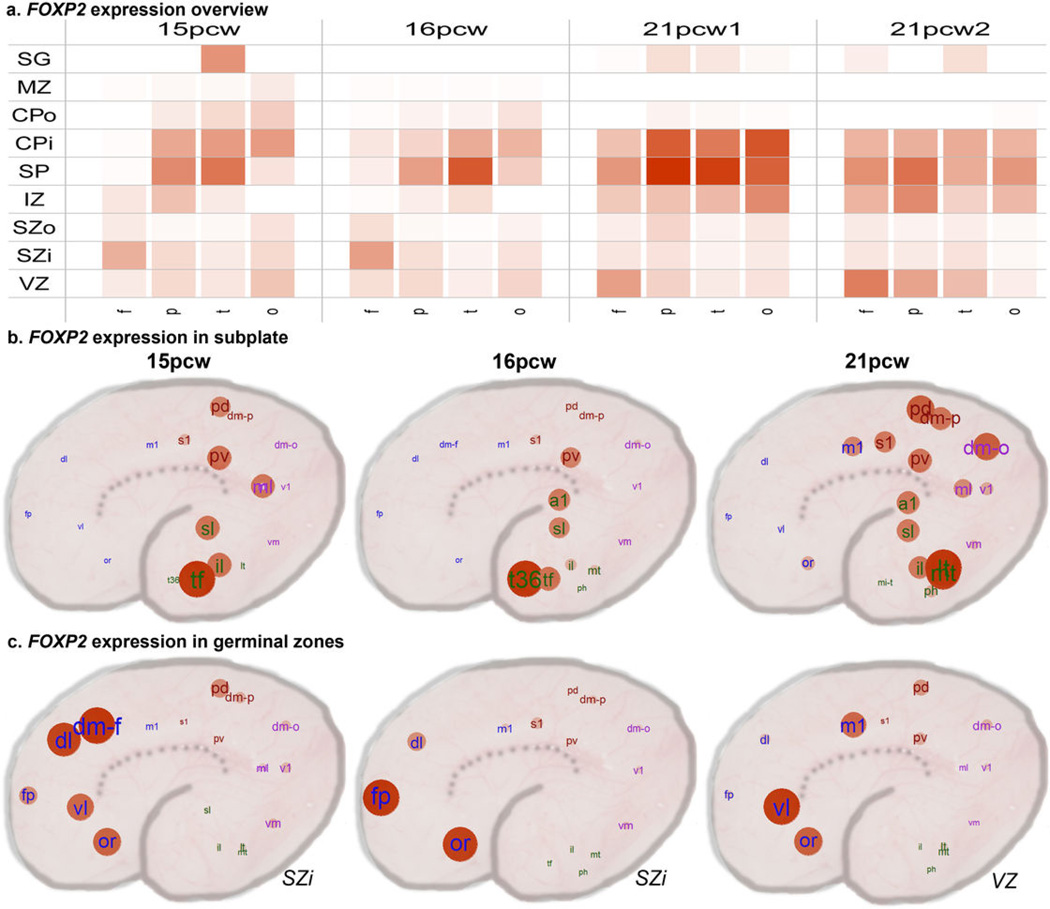
The anatomical and functional architecture of the human brain is mainly determined by prenatal transcriptional processes. We describe an anatomically comprehensive atlas of the mid-gestational human brain, including de novo reference atlases, in situ hybridization, ultra-high-resolution magnetic resonance imaging (MRI) and microarray analysis on highly discrete laser-microdissected brain regions. In developing cerebral cortex, transcriptional differences are found between different proliferative and post-mitotic layers, wherein laminar signatures reflect cellular composition and developmental processes. Cytoarchitectural differences between human and mouse have molecular correlates, including species differences in gene expression in subplate, although surprisingly we find minimal differences between the inner and outer subventricular zones even though the outer zone is expanded in humans. Both germinal and post-mitotic cortical layers exhibit fronto-temporal gradients, with particular enrichment in the frontal lobe. Finally, many neurodevelopmental disorder and human-evolution-related genes show patterned expression, potentially underlying unique features of human cortical formation. These data provide a rich, freely-accessible resource for understanding human brain development.


Figures

Figure 1
Figure 1. Prenatal human brain atlas components
a. Nissl stained (right) and corresponding annotated reference atlas (left) plate, color coded by structure. b. ISH for RELN showing expression in Cajal-Retzius cells at low (left) and high (right) magnification in MZ. c. High resolution MRI and tract DWI of fixed ex cranio brain. d. Experimental strategy for systematic histology, anatomical delineation and LMD-based isolation of discrete anatomical structures for microarray analysis. Nissl, acetylcholinesterase (AChE) and GAP43 ISH were used to identify structures. e. Quantitative representation of microarray data for FOLR1, TGIF1, and SIX3. GE: ganglionic eminence. See Supplemental Table 2 for other anatomical abbreviations.
Figure 2
Figure 2. Laminar gene expression mirrors developmental processes in prenatal neocortex
a. Nissl section from 16pcw cortex showing layers dissected for analysis (represented by color bar). The outer and inner fiber layers (OFL, IFL) were omitted from the dissection. b. Sample clustering based on 100 most significant genes differentiating layers by ANOVA (p<10−29) groups samples by layer at both timepoints. c. MDS using all genes demonstrates clustering of postmitotic versus germinal zones (Dimension 1) and to a lesser extent by rostrocaudal position (Dimension 2). d. Layer-enriched gene expression, based on correlation to binary templates at 21pcw (Methods). Enriched genes in each layer relate to cellular makeup and developmental maturity of those cells. e. Validation of laminar enrichment by ISH for genes with asterisks in (d). See Supplemental Table 2 for anatomical abbreviations.
Figure 3
Figure 3. Co-expression analyses of prenatal cortex
a. WGCNA cluster dendrogram on all 526 neocortical samples groups genes into 42 distinct modules (First row). Rows 2–4: Strong differential expression relationships are seen between module genes and age or cortical layer. b. Module eigengene (ME) expression of four notable modules in (a), averaged across brain and layer. Modules are biologically characterized with significant category enrichments and representative genes. Many top gene-gene connections for module C31 are shown in (c), including several known GABAergic interneuron genes. d. Cluster dendrogram for consensus network focused on germinal layers identifies modules (Row 1) enriched in each layer (Rows 2,3). e. ME heatmap shows differential VZ/SZ expression for 8 modules, along with enriched gene sets. f. FISH on 15pcw frontal cortex shows enrichment of SPATA13 and NR2E1 in mutually exclusive subcellular localization in VZ. g. Genes enriched in SZ, and differentially expressed between SZo and SZi. Genes color-coded by module (gray = unassigned).
Figure 4
Figure 4. Common and distinct subplate markers in human and mouse
a. NPY is enriched in SP at 21pcw but not 15–16pcw based on microarray (left) and ISH (right). Microarray data is plotted as the average +/− standard error of the mean (SEM) for each layer in each brain. b. Genes with SP enrichment in both species, based on microarray data in human (upper row) and ISH data at E15.5 or E18.5 mouse (lower row). c. Genes with SP enrichment in human but either no expression (DKK1, CRTR2 and MESP1) or no SP enrichment (CHD1 and CRYM) in mouse. d. Genes with SP enrichment in developing mouse, but not human, SP. Asterisks indicate common expression between human and mouse in other layers (i.e., SG/pia mater). Mouse ISH images taken from the Allen Developing Mouse Brain Atlas.
Figure 5
Figure 5. Areal patterning in developing neocortex
a–b. Density plot showing the location of highest expression for genes with gradient-like expression in CPo (a) or SZi (b) in each brain. c. Schematic illustrating the predominant direction of gene gradients, which follow a fronto-temporal trajectory. d. FGFR3 shows caudal enrichment in germinal zones of developing human cortex. Samples are plotted on a schematic of the prenatal cortex, with expression level indicated by circle size and color. e. Similar enrichment is seen in developing mouse cortex. f–g. CBLN2 shows rostral enrichment in CP of both human (f) and mouse (g). h. Barplot showing common rostrally- (red) and caudally- (green) enriched genes across brains for each layer. i. Heatmap representation of the top 20 rostral-enriched in the CPo shows selective enrichment in frontal lobe (F).
Extended Data Figure 1
Extended Data Figure 1. Representative Nissl sections for laser microdissection (LMD) of 16 pcw and 21 pcw brains
Nissl-stained sections were annotated and used to determine LMD region boundaries for 16 pcw (a) and 21 pcw (b) brains. Regions from adjacent sections on PEN membrane slides were captured using these annotations as guidelines. Labels show full name and abbreviation for representative planes of section through presumptive neocortical regions. (b) is a higher resolution modified version of the bottom row in Figure 1c of the main manuscript.
Extended Data Figure 2
Extended Data Figure 2. Overview of magnetic resonance imaging data acquired from the post-mortem, formalin-fixed human fetal brain samples
Diffusion-weighted MRI were acquired for each sample using a steady state free precession sequence (b= 730s/mm^2; 44 directions), yielding maps of apparent diffusion coefficient (ADC) (1st row) and of fractional anisotropy (FA) (2nd row). Whole-brain deterministic tractography results (3rd row) represent visualization of tractography output data filtered by a coronal slice filter. Structural data were acquired for each sample using a multi-echo flash sequence with images acquired at alpha = 40 providing optimal contrast to identify cortical and subcortical structures of interest (4th row).
Extended Data Figure 3
Extended Data Figure 3. White matter fiber tracts in fetal human brain
Orientation-encoded diffusion tensor imaging (DTI) colormaps in the left panel (a) and the three-dimensionally reconstructed fetal white matter fibers in the right panels (b, c and d) for fetal brains at 15pcw (upper row), 16pcw (middle row) and 19pcw (lower row). The orientation-encoded DTI colormaps are in axial planes at the anterior commissure level. The red, pink, green and purple fibers in the right panels are cc in (b), cp and icp in (c), and pvf in (d), respectively. The transparent whole brain and yellow thalamus are also shown as anatomical guidance in (b), (c) and (d). The scale bars are shown in the left panel (a). The fiber name abbreviations are as follows. cc: corpus callosum; cp: cerebral peduncle; icp: inferior cerebellar peduncle; pvf: periventricular fibers (transient fibers coursing around the germinal matrix and only existing in the prenatal fetal brain).
Extended Data Figure 4
Extended Data Figure 4. Module eigengene expression of remaining modules in the cortical network
Module eigengene expression of remaining 38 modules averaged across brain and layer. Each box corresponds to average module eigengene expression of all samples in that layer (rows) and brain (columns). Red = higher expression.
Extended Data Figure 5
Extended Data Figure 5. Temporal patterning of whole cortex WGCNA modules across early to mid-gestational periods in BrainSpan RNA-seq cortical data
RNA-seq RPKM values for 8–22pcw specimens in the BrainSpan database for genes assigned to WGCNA modules (Figure 3 in main manuscript) were correlated with age. For each module (Fig. 3a–c; x-axis), the average correlation (+/− standard error of the mean) between expression of genes in that module and age (y-axis) is plotted. Many of the modules show increases (positive correlation) or decreases (negative correlation) with age. In particular, modules C38 (increasing with age) and C22 (decreasing with age) presented in the main manuscript (see Fig. 3b, left column) show consistent trends with age in both datasets.
Extended Data Figure 6
Extended Data Figure 6. Gene sets corresponding to GABAergic interneurons and proliferating layers also are highly expressed in the ganglionic eminences
To examine the relationship between genes enriched in the cortical VZ, including gene modules associated with GABAergic interneurons and mitotically active proliferative cells, WGCNA was performed on the combined cortical and GE samples (referred to as the "GE network"). a. Genes from module C31 in the whole cortex WGNCA (GABA neurons) are assigned primarily to three modules in the GE network. GE31a has a similar pattern in cortex as C31, is highly expressed in GE and is enriched in genes associated with GABAergic interneurons. Other genes from C31 were assigned to modules with other cortical patterns and functional ontological associations (GE31b, GE31c). b. Genes from module C38 in the whole cortex WGNCA also divide primarily into three GE modules that are enriched in both the cortical germinal layers and the GE. These modules are enriched for genes expressed in astrocytes, potentially reflecting expression in radial glia, and are associated with cell cycle. For all plots, module eigengene (ME) expression is averaged across brain and layer (as in Fig. 3b of the main manuscript), also including LGE, MGE, and CGE (referred to here collectively as GE). Numbers in parentheses below each plot show the number of genes from module C31 in a, or C38 in b, out of the total number of module genes in the newly-generated network. One representative enrichment category for each module is shown with enrichment p-value.
Extended Data Figure 7
Extended Data Figure 7. FISH of hub genes in VZ-enriched modules shows expected laminar enrichment and largely non-overlapping subcellular distributions
a. Fluorescent in situ hybridization (FISH) in proliferative layers of 15 post-conceptual week human cortex for three genes in modules G7 and G8 in the germinal layers network shown in Figure 3 of the manuscript (see Fig. 3d–f)—SPATA13, NR2E1, and DTL. All three genes show enrichment in the VZ compared to the SZ as expected based on microarray data. Nuclei are labeled with DAPI (blue). b. High magnification images in the VZ show double labeling for each pair of genes (with fluor reversal, lower row) and show complex subcellular distributions. SPATA13, NR2E1, and (to a lesser extent) DTL appear to be expressed in most cells in the VZ, but these genes are typically expressed in non-overlapping punctate cytoplasmic locations (excluded from DAPI-stained nuclei in blue). b is at 50× magnification relative to a.
Extended Data Figure 8
Extended Data Figure 8. Laminar gene expression of putative SP markers for human and mouse in prenatal human cortex
(a) Novel human subplate-enriched genes showing at least 8-fold enrichment in SP in all four prenatal human brains. CDH18, a known SP marker in mouse, is presented as a positive control. (b) Genes with differences in subplate expression between mouse and human. These genes have been reported as subplate-enriched in mouse studies but do not show human subplate enrichment. Labeling as in Figure 4a of the main manuscript. Microarray data is plotted as the average +/− standard error of the mean (SEM) for each layer in each of the four brains analyzed (colors).
Extended Data Figure 9
Extended Data Figure 9. Areal gradients are consistent with patterns in BrainSpan RNA-seq cortical data, particularly for postmitotic layers
RNA-seq RPKM values for 8–22pcw specimens in the BrainSpan database were used to assess rostral caudal patterning for all genes in prenatal development. Specifically, gene expression was correlated with a template of frontal cortex samples (1) vs. samples from other cortical layers (0), such that positive correlations correspond to rostral enrichment. The same density plot of the resulting correlations is plotted for each layer in black. For each layer (except SG), density plots for the subset of rostral (red) and caudal (green) genes identified in this study (Fig. 5h) are shown. Note the significant offset of density curves for rostral and caudal genes in MZ, CPo, CPi, and IZ (and other layers to a lesser extent), indicating good agreement in areal gradient genes between studies.
Extended Data Figure 10
Extended Data Figure 10. Areal and laminar expression patterning of FOXP2
a. Summarized expression levels of FOXP2 across each lobe, layer, and brain. b. FOXP2 shows enrichment in parietal and temporal regions overlapping Wernicke's area in SP at all three time points. c. FOXP2 shows enrichment in frontal cortex in germinal zones. Red = higher expression.

References

    1. Colantuoni C, et al. Temporal dynamics and genetic control of transcription in the human prefrontal cortex. Nature. 2011;478:519–523. - PMC - PubMed
    1. Fietz S, et al. Transcriptomes of germinal zones of human and mouse fetal neocortex suggest a role of extracellular matrix in progenitor self-renewal. Proceedings of the National Academy of Sciences of the United States of America. 2012;109:11836–11841. - PMC - PubMed
    1. Johnson M, et al. Functional and evolutionary insights into human brain development through global transcriptome analysis. Neuron. 2009;62:494–509. - PMC - PubMed
    1. Kang HJ, et al. Spatio-temporal transcriptome of the human brain. Nature. 2011;478:483–489. - PMC - PubMed
    1. Lambert N, et al. Genes expressed in specific areas of the human fetal cerebral cortex display distinct patterns of evolution. PLoS ONE. 2011;6:e17753. - PMC - PubMed

References (for online methods)

    1. Johnson WE, Li C, Rabinovic A. Adjusting batch effects in microarray expression data using empirical Bayes methods. Biostatistics (Oxford, England) 2007;8:118–127. - PubMed
    1. Langfelder P, Horvath S. WGCNA: an R package for weighted correlation network analysis. BMC Bioinformatics. 2008;9:559–559. - PMC - PubMed
    1. Langfelder P, Horvath S. Eigengene networks for studying the relationships between co-expression modules. BMC Systems Biology. 2007;1:54–54. - PMC - PubMed
    1. Huang DW, Sherman B, Lempicki R. Systematic and integrative analysis of large gene lists using DAVID bioinformatics resources. Nat. Protocols. 2009;4:44–57. - PubMed
    1. Cahoy J, et al. A transcriptome database for astrocytes, neurons, and oligodendrocytes: a new resource for understanding brain development and function. The Journal of neuroscience : the official journal of the Society for Neuroscience. 2008;28:264–278. - PMC - PubMed

Publication types