. 2014 Apr 3;508(7494):113-7.
doi: 10.1038/nature13187.

Tumour cell heterogeneity maintained by cooperating subclones in Wnt-driven mammary cancers

Affiliations

Tumour cell heterogeneity maintained by cooperating subclones in Wnt-driven mammary cancers

Allison S Cleary et al. Nature. .

Abstract

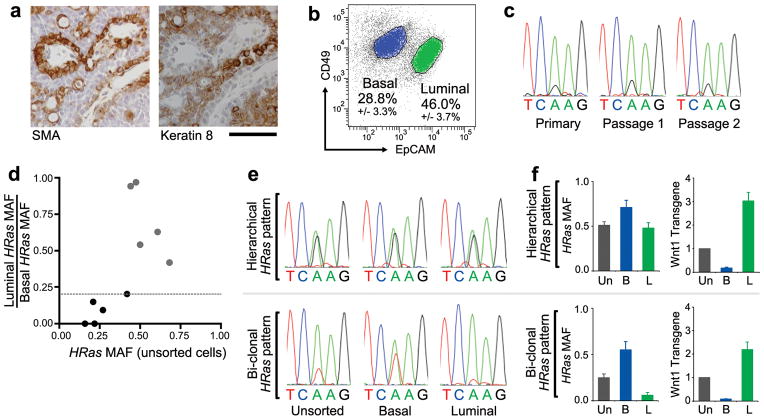
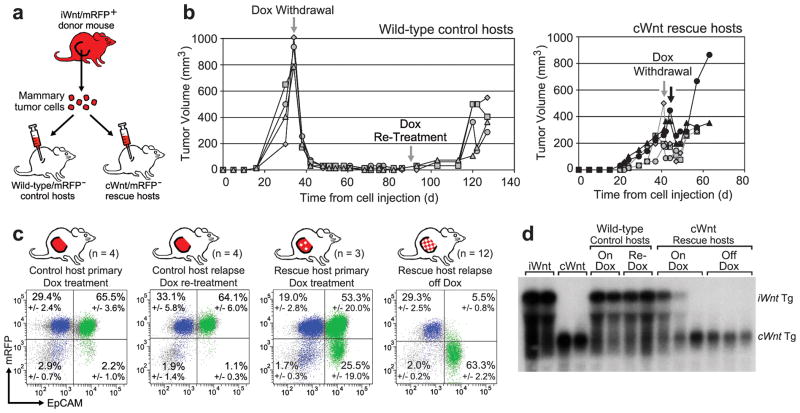
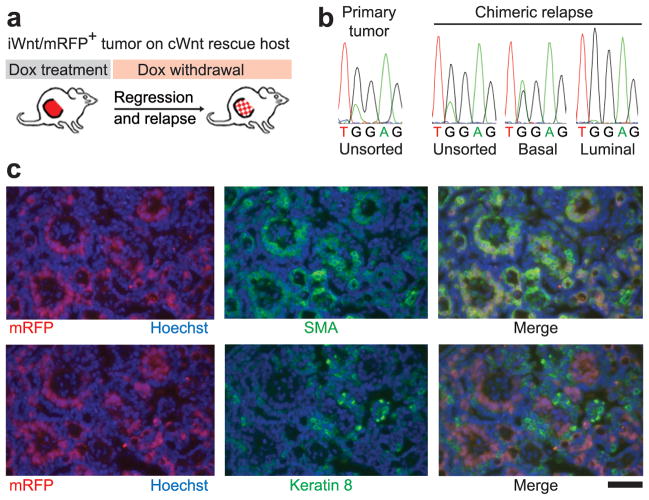
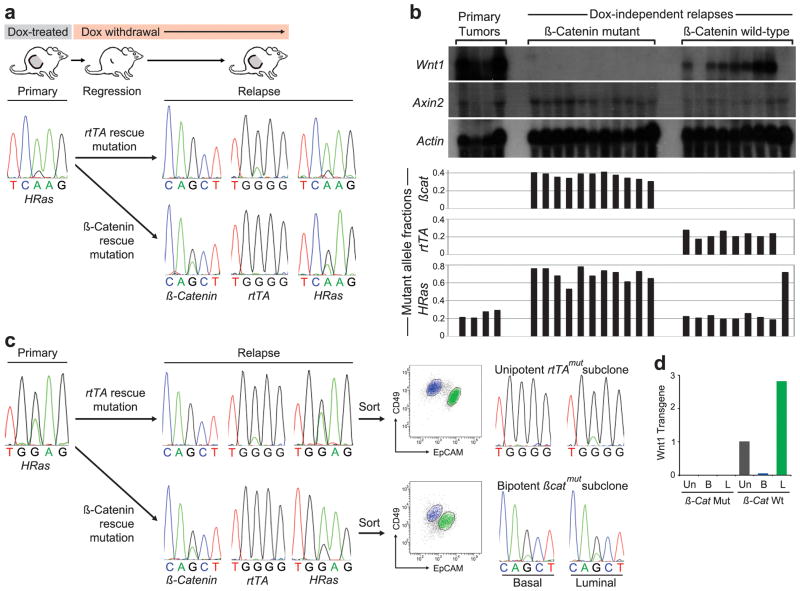
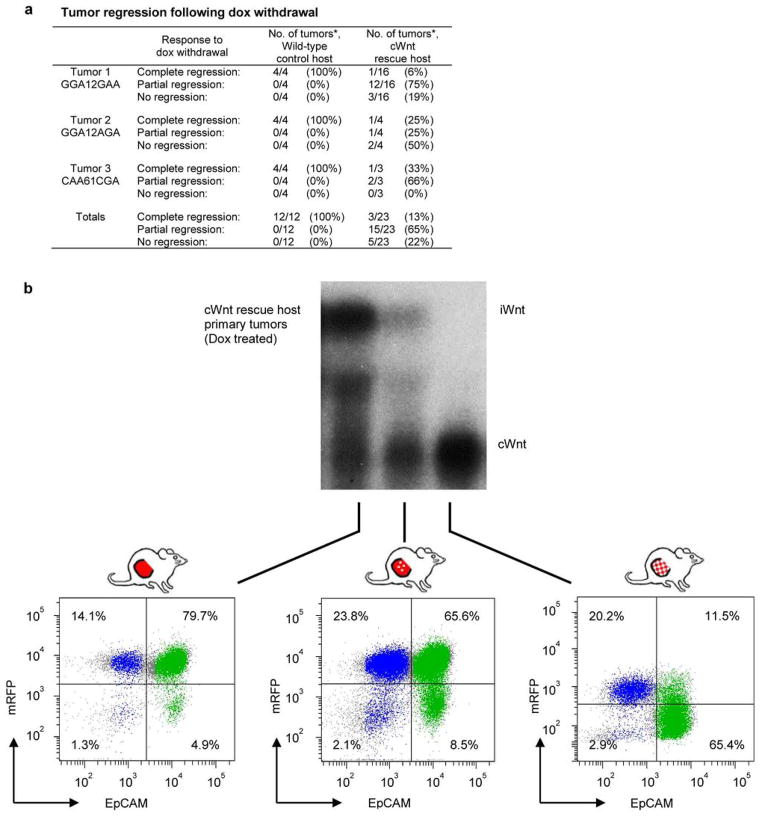
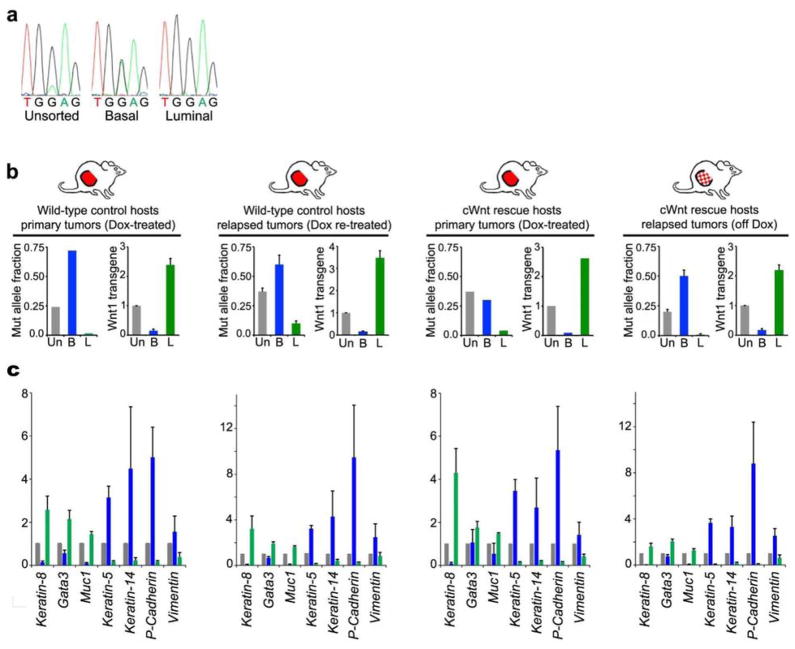
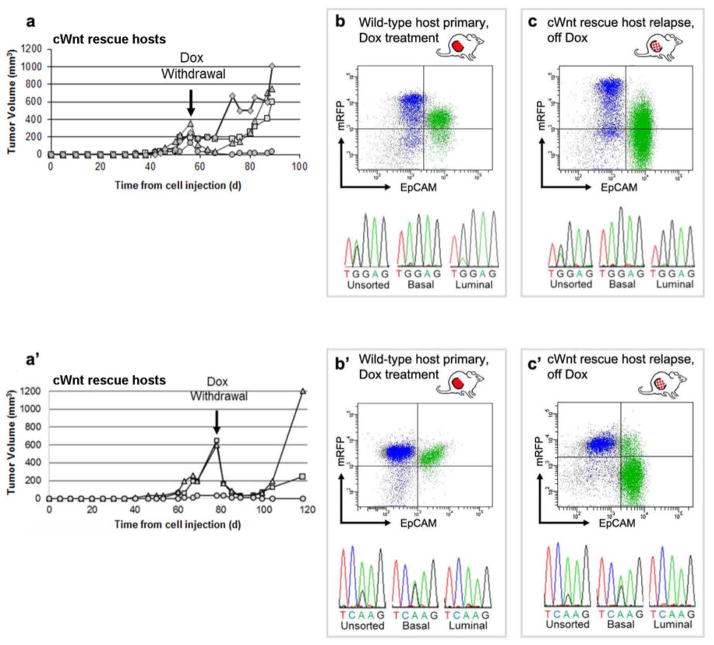
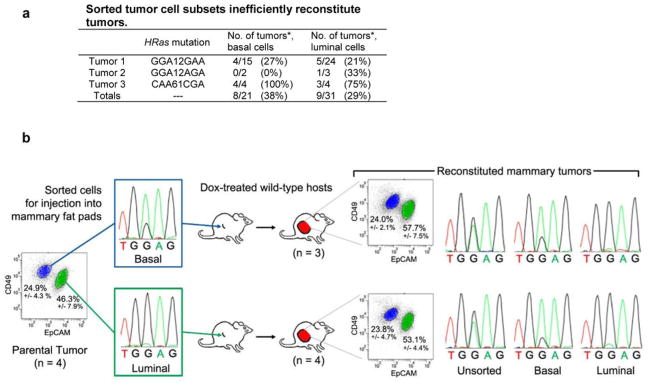
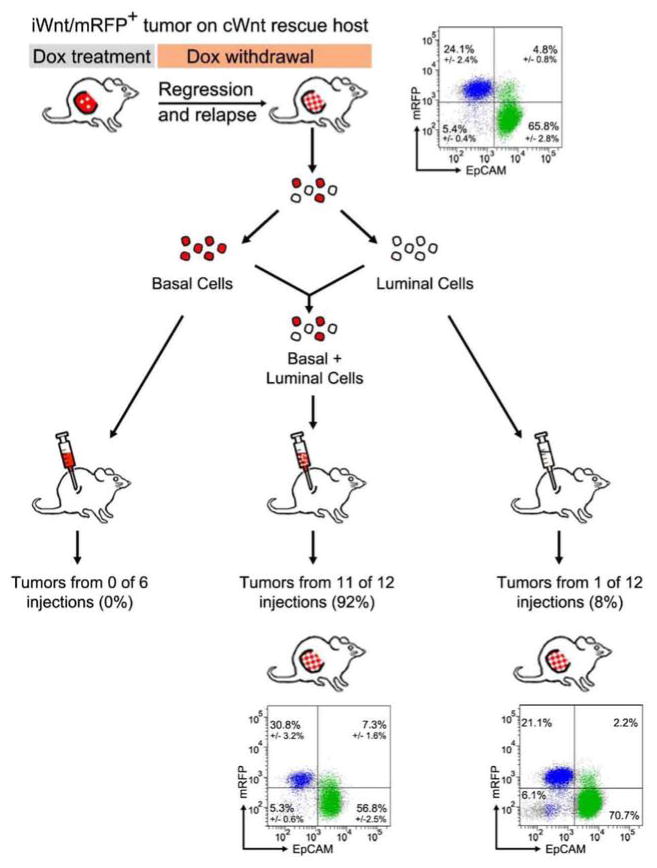
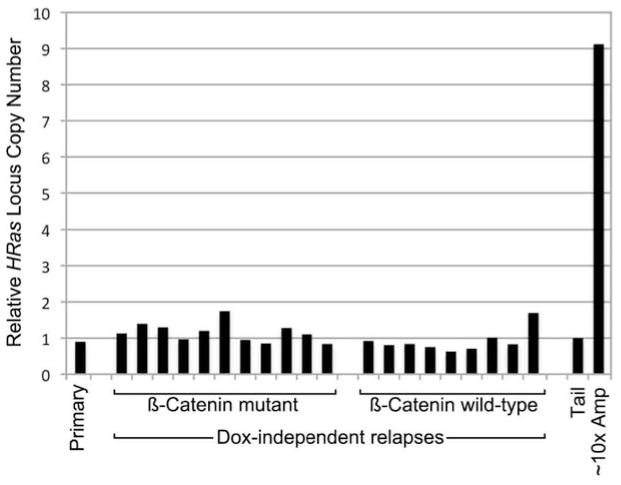
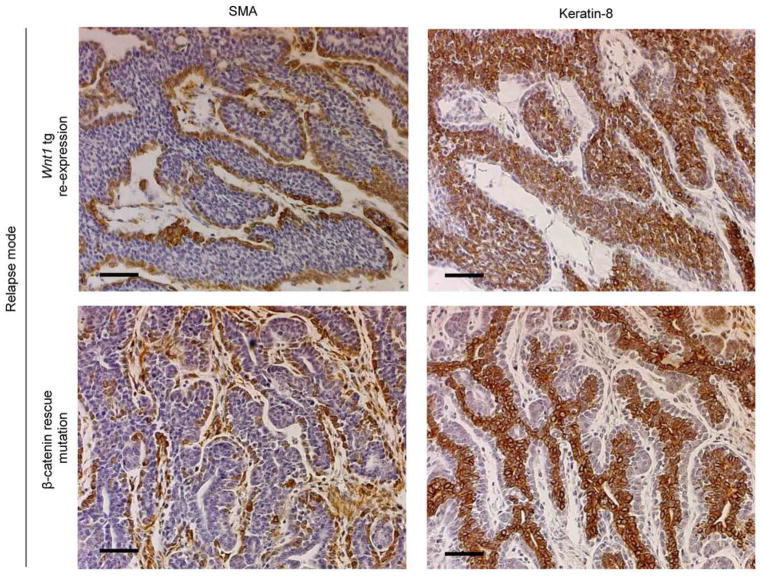
Cancer genome sequencing studies indicate that a single breast cancer typically harbours multiple genetically distinct subclones. As carcinogenesis involves a breakdown in the cell-cell cooperation that normally maintains epithelial tissue architecture, individual subclones within a malignant microenvironment are commonly depicted as self-interested competitors. Alternatively, breast cancer subclones might interact cooperatively to gain a selective growth advantage in some cases. Although interclonal cooperation has been shown to drive tumorigenesis in fruitfly models, definitive evidence for functional cooperation between epithelial tumour cell subclones in mammals is lacking. Here we use mouse models of breast cancer to show that interclonal cooperation can be essential for tumour maintenance. Aberrant expression of the secreted signalling molecule Wnt1 generates mixed-lineage mammary tumours composed of basal and luminal tumour cell subtypes, which purportedly derive from a bipotent malignant progenitor cell residing atop a tumour cell hierarchy. Using somatic Hras mutations as clonal markers, we show that some Wnt tumours indeed conform to a hierarchical configuration, but that others unexpectedly harbour genetically distinct basal Hras mutant and luminal Hras wild-type subclones. Both subclones are required for efficient tumour propagation, which strictly depends on luminally produced Wnt1. When biclonal tumours were challenged with Wnt withdrawal to simulate targeted therapy, analysis of tumour regression and relapse revealed that basal subclones recruit heterologous Wnt-producing cells to restore tumour growth. Alternatively, in the absence of a substitute Wnt source, the original subclones often evolve to rescue Wnt pathway activation and drive relapse, either by restoring cooperation or by switching to a defector strategy. Uncovering similar modes of interclonal cooperation in human cancers may inform efforts aimed at eradicating tumour cell communities.


Conflict of interest statement

The authors declare no competing financial interests.

Figures

Figure 1
Figure 1. Evidence for distinct basal HRasmut/Wnt1low and luminal HRaswt/Wnt1high subclones within some MMTV-Wnt1 tumors
a, Immunostaining for smooth muscle actin (SMA) and Keratin-8 performed on serial sections of a representative MMTV-Wnt1 mammary tumor. Scale bar, 50μm. b, Separation of MMTV-Wnt1 tumor cells into basal (CD49fhigh/EpCAMlow) and luminal (CD49flow/EpCAMhigh) cell subpopulations by flow cytometry. Percentages depict mean +/− SEM for n = 10 tumors. c, DNA sequencing chromatograms depicting an HRasCAA61CGA mutation appearing at a fixed MAF during serial propagation of an MMTV-Wnt1 tumor. d, Graphic depiction of the ratio of luminal to basal HRas MAF plotted against the MAF for unsorted cells. Dotted line depicts the threshold at which tumors show 5-fold HRasmut allele enrichment in basal versus luminal cells. Black circles denote tumor values with >5-fold basal enrichment. e, DNA sequencing chromatograms depicting an HRasCAA61CGA mutation (upper panels) and an HRasCAA61CTA mutation (lower panels) detected in representative Wnt tumors whose basal HRasmut allele enrichment fits a hierarchical pattern or biclonal pattern, respectively. f, Tumor cell populations analyzed by DNA sequencing and by qRT-PCR for Wnt1 expression relative to Gapdh. Histograms at left show HRas MAFs determined from chromatogram peak heights. Histograms at right show relative Wnt1 expression with values from unsorted tumor cells set at 1. Un, unsorted; B, basal; L, luminal. Data represent mean +/− SEM for n = 5 tumors of each pattern.
Figure 2
Figure 2. Rescue of basal HRasmut iWnt tumor cells from Wnt withdrawal by heterologous luminal cWnt cells
a, Schematic of experimental design. b, Growth curves of tumors reconstituted on wild-type or cWnt hosts following injection of iWnt/mRFP+ tumor cells. c, Representative FACS plots showing contributions by donor-derived mRFP+ cells and host-derived mRFP cells to reconstituted tumors. Percentages depict mean +/− SEM for n tumor explants as indicated. Colors indicate events within the basal (blue; CD49fHigh/EpCAMlow) and luminal (green; CD49fLow/EpCAMhigh) gates. d, Northern hybridization analysis of tumor RNA with Wnt1 probe. The larger bicistronic iWnt transcript encodes both Wnt1 and firefly luciferase.
Figure 3
Figure 3. Lineage-restricted subclones recapitulate mosaiform heterogeneity in chimeric cWnt/iWnt tumors
a, Schematic. b, DNA sequence chromatograms depicting matching HRasGGA12AGA mutations detected in unsorted and sorted populations from primary and relapsed tumors as indicated. c, Immunostaining of basal (SMA, top panels) and luminal (Keratin-8, lower panels) tumor cells within a Dox-independent relapse arising on a cWnt host. Red fluorescence marks donor-derived iWnt/mRFP+ cells intermingled with mRFP host-derived cells. Scale bar, 50μm.
Figure 4
Figure 4. Relapse of biclonal tumors through the evolution of either subclone
a, DNA sequencing chromatograms depicting matching HRasCAA61CGA mutations detected in primary and relapsed tumors, with an increased MAF detected in the setting of a βcat mutation. b, Histogram depicting MAFs for a series of primary and relapsed tumors derived from a parental biclonal tumor. Upper panel depicts corresponding gene expression patterns for each tumor by Northern hybridization analysis. c, DNA sequencing chromatograms depicting matching HRasGGA12GAA mutations detected in primary and relapsed tumors, with an increased MAF detected in the setting of a βcat mutation. Panels at right depict analysis of unsorted and sorted cells at relapse showing unipotent or bipotent mutant subclones, depending on the mode of Wnt pathway reactivation. d, Histogram shows Wnt1 expression levels relative to Gapdh in unsorted and sorted tumor cells from a β-catmut/rtTAwt relapse versus a β-catwt/rtTAmut relapse with the value measured in unsorted cells from the latter relapse set at 1. Un, unsorted; B, basal; L, luminal.
Extended Data Figure 1
Extended Data Figure 1. FACS gating strategy for resolving basal and luminal subsets from mammary tumors
Mammary tumors were mechanically and enzymatically dissociated into single cell suspensions. a, Negative selection against Lin+ cells using Stem Cell Technologies EasySep Mouse Epithelial Cell Enrichment Kit. Resulting Lin (CD45/ CD31/ TER119/ BP-1) cells were then immunostained with antibodies for CD49f (α6 integrin) and EpCAM and analyzed by FACS. b, Exclusion of cell debris and dead/ dying cells. Dead/dying cells collect as a band along the bottom of a FSC-A vs. SSC-A two-parameter plot, and these were gated out in P1. c, Cell doublets were discarded in P2. d, Basal and Luminal mammary epithelial cell populations were separated by immunophenotype. Basal epithelial cells are CD49fhigh/ EpCAMlow (P3) and luminal epithelial cells are CD49fLow/ EpCAMhigh (P4). e, Gating tree showing gating strategy for FACS analysis as well as parent and total cell percentages within each of the gates for a representative MMTV-Wnt1 tumor.
Extended Data Figure 2
Extended Data Figure 2. Hierarchical and Biclonal MMTV-Wnt1 tumors are histologically indistinguishable
a, H&E stained sections from a series of MMTV-Wnt1 mammary tumors whose HRasmut allele distribution pattern suggests hierarchical or biclonal configuration, as indicated. Scale bar, 50 um. b, Both hierarchical and bi-clonal MMTV-Wnt1 tumors display mixed-lineage character. Serial sections from a hierarchical and bi-clonal MMTV-Wnt1 mammary tumors immunostained for Smooth Muscle Actin (SMA) or Keratin 8 (K8), which recognize basal and luminal epithelial cells respectively. For both, brown pigment is positive staining. Sections were counterstained with hematoxylin. Scale bar, 50 μm.
Extended Data Figure 3
Extended Data Figure 3. Tumor regression following Dox withdrawal
a, Tumors reconstituted on wild-type or cWnt hosts following injection of iWnt/mRFP+ tumor cells were subjected to Dox withdrawal and monitored for regression. *Shown as number of tumor regressions per number of tumors subjected to Dox withdrawal. b, Northern hybridization analysis of tumor RNA with Wnt1 probe. Tumors were reconstituted on Dox-treated cWnt hosts following injection of iWnt/mRFP+ tumor cells. Depicted below are the corresponding FACS plots showing the range of contributions by donor derived mRFP+ and host-derived mRFP cells to reconstituted tumors prior to Dox withdrawal. Colors indicate events within the basal (blue; CD49fhigh/EpCAMlow) and luminal (green; CD49flow/EpCAMhigh) gates. On rescue hosts, primary tumors that arose during Dox treatment incorporated a variable number of cWnt luminal cells, indicating that the crosstalk between heterologous cells required to seed relapse sometimes occurs early in tumor reconstitution. For one of three primary tumors analyzed, the conversion to lineage-restricted chimerism and cWnt transgene expression was essentially complete, meaning that cWnt-producing cells had replaced iWnt-producing cells despite ongoing Dox treatment. Analysis of this tumor required necropsy of the host, precluding determination of its clinical response to Dox withdrawal, which we propose would have been negligible. Concordantly, in rare cases the growth of sibling primary tumors propagated on rescue hosts continued unimpeded by Dox withdrawal, and these tumors always showed pronounced, lineage-restricted chimerism at necropsy. Elucidating mechanisms whereby host cWnt cells compete with luminal iWnt tumor cells to become the predominant Wnt-producing subclone may offer new insights into evolutionary forces shaping tumor microenvironments.
Extended Data Figure 4
Extended Data Figure 4. Biclonal configuration of reconstituted iWnt/mRFP+ tumors
a, DNA sequencing chromatograms depicting a basally-enriched HRasGGA12GAA mutation detected in the parental tumor. b, Evidence for distinct basal HRasmut/Wnt1low and luminal HRaswt/Wnt1high tumor subclones. Sorted tumor cell subsets were analyzed by DNA sequencing and by qRT-PCR for Wnt1 expression relative to Gapdh. Histograms at left show HRas MAFs determined from chromatogram peak heights. Histograms at right show relative Wnt1 expression with values from unsorted tumor cells set at 1. Un, unsorted; B, basal; L, luminal. Data represent mean +/− SEM for (from left to right) n = 2, 4, 3, 4, 1, 2, 6, or 12 explants. c, For each condition, sorted tumor cell subsets were analyzed by qRT-PCR for expression of several epithelial lineage-specific genes relative to Gapdh, with values for unsorted tumor cells set at 1. Gray bars, unsorted; Blue bars, basal; Green bars, luminal. Data represent mean +/− SEM for (from left to right) n = 4, 4, 3, or 12 explants.
Extended Data Figure 5
Extended Data Figure 5. Basal subclones from two additional iWnt/mRfp+ tumors rescued from Dox withdrawal by heterologous cWnt host cells
a, Growth curves of tumor outgrowths derived from an iWnt/mRFP+ tumor harboring a basally-restricted HRasGGA12AGA mutation. Curves depict regression and relapse of tumors reconstituted on cWnt rescue hosts following Dox withdrawal. b,c, Upper panels. Representative FACS plots showing contributions from donor-derived mRFP+ cells and host-derived mRFP- cells during tumor reconstitution. Colors indicate events within the basal (blue; CD49fHigh/EpCAMlow) and luminal (green; CD49fLow/EpCAMhigh) gates. Lower panels. DNA sequencing chromatograms showing matching, basally-restricted HRas mutations present in both primary Dox-dependent tumors and chimeric Dox-independent relapses. a′–c′. Data panels presented as in a–c, showing similar results for an independent iWnt/mRFP+ tumor harboring a distinct, basally- restricted HRasCAA61CGA mutation. For both tumors shown here, Northern hybridization analysis confirmed expression of donor-derived iWnt transgene prior to Dox withdrawal, followed by a switch to expression of host-derived cWnt transgene at relapse (data not shown).
Extended Data Figure 6
Extended Data Figure 6. Biclonal configuration of tumors reconstituted from sorted iWnt/mRFP+ tumor cell subsets
a, Sorted tumor cell subsets inefficiently reconstitute tumors. Three independent iWnt/mRFP+ bi-clonal tumors were resolved into component basal and luminal tumor cell subsets by FACS. Each tumor harbored a different basally-restricted HRas mutation, as indicated. 105 sorted tumor cells were injected orthotopically into intact, post-pubertal mammary glands of wild-type host mice maintained on chronic Dox treatment. *Shown as number of reconstituted tumor outgrowths per injected gland. b, Tumor cells from a parental iWnt/mRFP+ tumor harboring a basally-restricted HRasGGA12GAA mutation were resolved into basal and luminal cell subsets by FACS. When these isolated tumor cell subsets were injected orthotopically into the mammary glands of Dox-treated wild-type hosts, few tumors were reconstituted. However, tumors that did arise always were comprised of basal HRasmut/Wnt1low and luminal HRaswt/Wnt1high subsets, implicating interclonal cooperation in tumor reconstitution (n = 3 tumors reconstituted from the basal cell-enriched subset; n = 4 tumors reconstituted from the luminal cell-enriched subset).
Extended Data Figure 7
Extended Data Figure 7. Both sorted basal and sorted luminal cell populations are required to reconstitute biclonal tumors
Chimeric tumor relapses generated by injecting iWnt/mRFP+ tumor cells onto cWnt rescue hosts were resolved into their component basal (mRFP+/HRasmut/Wnt1low) and luminal (mRFP/HRaswt/Wnt1high) cell subsets by FACS. Each sorted population was injected separately (105 basal cells/injection or 105 luminal cells/injection) or as a 1:1 admixture (5×10⁴ basal cells + 5×10⁴ luminal cells/injection) onto wild-type, Dox-naïve hosts. All reconstituted tumors faithfully recapitulated the biclonal configuration of the source tumor. Depicted are FACS plots from parental and reconstituted tumors showing both mRFP+ and mRFP subclonal populations. Colors indicate events within the basal (blue; CD49fHigh/EpCAMlow) and luminal (green; CD49fLow/EpCAMhigh) gates. Percentages depict mean +/− SEM for n = 5 clonally related parental tumor outgrowths and n = 11 tumor outgrowths reconstituted from injection of admixed cells.
Extended Data Figure 8
Extended Data Figure 8. Increased HRas MAFs in βcatmut DITs is not due to gross copy changes at the HRas locus
Histogram depicts HRas allele copy number relative to β-actin determined for a cohort of clonally-related Wnt tumor outgrowths. Independent relapse samples are presented in the same order depicted in Fig. 4b. Copy number values were obtained by performing qPCR on genomic DNA from tumor samples and from normal tail, with tail values set at 1. As a positive control, we included a p19Arf-deficient Wnt tumor sample (~10x Amp) previously found to have approximately 10-fold HRas copy number gain as determined by Southern hybridization. Since, HRas MAFs reproducibly exceeded βcat MAFs by approximately 2-fold across the βcatmut relapse set (Fig. 4b), elevated HRas MAFs may reflect duplication of the HRasmut allele (e.g., via a gene conversion event) sometime in the life history of βcatmut subclones.
Extended Data Figure 9
Extended Data Figure 9. Mixed-lineage character of DITs
Serial sections of representative Wnt1 transgene re-expressing and β-catmut relapsed tumors immunostained for Smooth Muscle Actin (SMA) or Keratin-8, which recognize basal and luminal epithelial cells respectively. For both, brown pigment indicates positive staining. Sections were counterstained with hematoxylin. Scale bar, 50 μm.

Comment in

References

    1. Shah SP, et al. Mutational evolution in a lobular breast tumour profiled at single nucleotide resolution. Nature. 2009;461:809–813. doi: 10.1038/nature08489. - DOI - PubMed
    1. Ding L, et al. Genome remodelling in a basal-like breast cancer metastasis and xenograft. Nature. 2010;464:999–1005. doi: 10.1038/nature08989. - DOI - PMC - PubMed
    1. Nik-Zainal S, et al. The life history of 21 breast cancers. Cell. 2012;149:994–1007. doi: 10.1016/j.cell.2012.04.023. - DOI - PMC - PubMed
    1. Navin N, et al. Tumour evolution inferred by single-cell sequencing. Nature. 2011;472:90–94. doi: 10.1038/nature09807. - DOI - PMC - PubMed
    1. Nowell PC. The clonal evolution of tumor cell populations. Science. 1976;194:23–28. - PubMed

Publication types

MeSH terms