Review
. 2014:2014:976321.
doi: 10.1155/2014/976321. Epub 2014 Feb 20.

Autologous cord blood therapy for infantile cerebral palsy: from bench to bedside

Affiliations
Review

Autologous cord blood therapy for infantile cerebral palsy: from bench to bedside

A Jensen. Obstet Gynecol Int. 2014.

Abstract

About 17 million people worldwide live with cerebral palsy, the most common disability in childhood, with hypoxic-ischemic encephalopathy, preterm birth, and low birth weight being the most important risk factors. This review will focus on recent developments in cell therapy for infantile cerebral palsy by transplantation of autologous umbilical cord blood. There are only 4 publications available at present; however, the observations made along with experimental data in vivo and in vitro may be of utmost importance clinically, so that a review at an early developmental stage of this new therapeutic concept seems justified. Particularly, since the first published double-blind randomized placebo-controlled trial in a paradigm using allogeneic cord blood and erythropoietin to treat cerebral palsy under immunosuppression showed beneficial therapeutic effects in infantile cerebral palsy, long-held doubts about the efficacy of this new cell therapy are dispelled and a revision of therapeutic views upon an ailment, for which there is no cure at present, is warranted. Hence, this review will summarize the available information on autologous cord blood therapy for cerebral palsy and that on the relevant experimental work as far as potential mechanisms and modes of action are concerned.


Figures

Figure 1
Figure 1
Intraperitoneal transplantation of mononuclear hUCB-derived cells resulted in a specific “homing” of these cells into the CNS and incorporation around the lesioned area. Title page from [, Figure  3(B)]. HLA-DR-positive mononuclear cells (green) are located within a scaffold of GFAP-positive astrocytes (red) in the area of the hypoxic-ischemic lesion. This paper is available online at: http://www.nature.com/pr/journal/v59/n2/full/pr200649a.html.
Figure 2
Figure 2
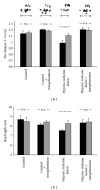
Transplantation of hUCB-derived mononuclear cells reduces spastic paresis as assessed by footprint analysis of 3-wk-old animals (see [, Figure  5]). (a) Hypoxic-ischemic brain damage results in spastic paresis of the distal limb muscles, causing a significant reduction of footprint width (toe distance 1 to 5) of the right hind paw (contralateral to the insult; black columns) compared with the left (ipsilateral; gray columns) hind paw. Intraperitoneal transplantation of hUCB-derived mononuclear cells after hypoxic-ischemic brain damage reduced spastic paresis. In these animals, differences between ipsi- and contralateral hind paws were no longer detectable. Photographs of footprints (right hind paws) illustrate the footprint widths (arrows) of control animals without (left) and with (center left) transplantation, upon hypoxic-ischemic lesion without (center right) and with (right) transplantation of hUCB-derived mononuclear cells. (b) In control animals with and without transplantation, the step length of left and right hind paws is equal. In contrast, hypoxic-ischemic lesion resulted in a significantly reduced step length of the right hind paw (black columns) compared with the left hind paw (gray columns). This reduction in step length of the hind paw contralateral to the lesion, also indicative of spastic paresis, was largely alleviated upon transplantation of hUCB-derived mononuclear cells. Data are presented as mean ± SEM; *P < 0.05; ***P < 0.001. This paper is available online at: http://www.nature.com/pr/journal/v59/n2/full/pr200649a.html.
Figure 3
Figure 3
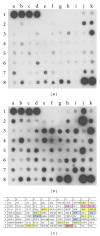
Protein antibody array detecting cytokines in human umbilical cord blood (hUCB)-cell conditioned media (see [, Figure  7]). Representative examples of two antibody array membranes, incubated with either nonconditioned culture medium (a) or culture medium conditioned by hUCB-derived mononuclear cells for 2 days (b). Increasing intensity reveals increased secretion of the cytokines investigated. Dots a1 to d1 and j8 to k8 were positive controls (Pos); dots e1 to f1 and i8 were negative controls (Neg). (c) Overview of all proteins assayed on the membrane. Boxed factors are color-coded and refer to those proteins secreted at significant levels. Colors designate interleukin proteins (purple), growth factors (blue), chemokines (yellow), as well as tissue inhibitors of metalloproteinase2 (TIMP-2) (orange). Ang: angiogenin; BDNF: brain-derived neurotrophic factor; BLC: B-lymphocyte chemoattractant; EGF: epidermal growth factor; ENA-78: epithelial neutrophil-activating protein-78; Etx; eotaxin; FGF; fibroblast growth factor; Fract: fractalkine; GCP-2: granulocyte chemotactic protein-2; GCSF: granulocyte colony-stimulating factor; GDNF: glial cell-derived neurotrophic factor; GM-CSF: granulocyte macrophage colony-stimulating factor; GRO: growth-regulated oncogene; HGF: hepatocyte growth factor; IFN-g: interferon-g; IGF-1: insulin-like growth factor-1; IGFBP: insulin-like growth factor binding protein; IL: interleukin; IP-10: interferon-inducible protein-10; LIF: leukemia inhibitory factor; MCP: monocyte chemoattractant protein; MCSF: macrophage colony-stimulating factor; MDC: macrophage derived chemokine; MIF: macrophage inhibitory factor; MIG: monokine induced by g-interferon; MIP: macrophage inflammatory protein; NAP-2: neutrophil activating protein-2; NT: neurotrophin; OSM: oncostatin M; Osteoprot: osteoprotegrin; PARC: pulmonary and activation-regulated chemokine; PDGF-B: platelet-derived growth factor-B; PIGF: placenta growth factor; SCF: stem cell factor; SDF-1: stromal-derived factor-1; TARC: thymus associated and regulated chemokine; TGF-b: transforming growth factor-b; TNF: tumor necrosis factor; TIMP: tissue inhibitor of melloproteinases; Tpo: thrombopoietin; VEGF: vascular endothelial growth factor.
Figure 4
Figure 4
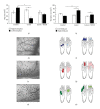
Effects of hypoxic ischemic brain injury and hUCB treatment on receptive field (RF) and cortical map size (see [28]). (a) In lesioned rats the size of the left cortical hindpaw (HP) representation was significantly reduced after hypoxic ischemic brain injury (HI) (P = 0.005 versus controls, P = 0.004 versus contralateral hemisphere). Treatment with hUCB cells prevented map changes in the left cortical HP representation. (b)–(d) images of the cortical surface of the left hemisphere of a control (b), lesioned (c), and hUCB treated rat (d). Numbers indicate penetration sites; x indicates noncutaneous responses. hl: hindlimb. Borders of the maps are outlined. Scale bar 1 mm. (e) In lesioned rats RF size of the right HP was increased (P = 0.007 versus controls, P = 0.03 versus HP ipsilateral to the lesion). hUCB treatment leads to moderate RF increase, not significantly different from controls (P = 0.558). Bars represent sem (f)–(h) examples of RFs on the right and left HP for a control (f), lesioned (g), and hUCB treated rat (h). Number of rats used: control group n = 10, lesion group n = 17, and hUCB group n = 6. A total of 975 RFs were recorded (left hemisphere: control 127: lesioned 97, treated 85; right hemisphere: control 192, lesioned 327, and treated 147). doi: 10.1371/journal.pone.0020194.g003. This paper is available online at: http://www.plosone.org/article/info:doi/10.1371/journal.pone.0020194.
Figure 5
Figure 5
Reduction of microglial infiltration and GFAP expression after hUCB transplantation (see [25]). Schematic drawings show representative coronal brain sections after hypoxic-ischemic lesion corresponding to Bregma þ1.2-(þ) 0.2 mm at P21 (a) and P51 (f). Boxes highlight photographed areas (green: CD68 expression in the basal ganglia; red: GFAP expression in the cortex). (b) HI led to an infiltration of CD68 positive microglia. Cells were present at the lesion site throughout the late acute ischemic (P21) and, to a lesser extent, in the chronic postischemic phase ((g) P51). Dotted lines delineate histological defined areas of prominent tissue damage, and these express higher levels of CD68. Long white arrows indicate clusters of CD68 positive cells. Brains of transplanted animals showed a reduced microglial infiltration at both time points compared to nontransplanted animals ((c) P21; (h) P51). In analogy, two weeks following HI a massive upregulation of GFAP encircling the lesion site was observed (d) and maintained until seven weeks of age (i). hUCB transplantation led to a reduced amount of GFAP immunoreactivity around the ischemic zone ((e) P21; (j) P51), thus leaving a larger portion of the remaining cortex spare of the inflammatory reaction ((e) and (j) white dotted line indicates border of cortical areas with lower versus those with higher GFAP expression). Astrocytes in the vicinity of the ischemic zone presented an activated phenotype characterized by a large soma and fewer processes, thus obtaining a more rounded shape ((k) white arrows). In hUCB transplanted animals, a higher number of astrocytes appeared to have a more elongated phenotype with long processes ((l) white arrows). Scale bars: 50 μm. (For interpretation of the references to color in this figure legend, the reader is referred to the web version of this paper.) This paper is available online at: http://www.sciencedirect.com/science/article/pii/S0006899312011511.
Figure 6
Figure 6
First autologous cord blood transplantation after global hypoxic-ischemic brain damage caused by cardiac arrest in a boy 2.5 years of age (see [43]). Nine weeks after the insult the patient (L. B.) received an autologous cord blood transplantation to treat cerebral palsy (January 27, 2009). The boy was normally developed when brain damage occurred, that was followed by a quadriplegic persistent vegetative state (see video S3 in Supplementary Material [44]). From left to right: A. Jensen, M. D.; patient L. B.; E. Hamelmann, M. D., Ruhr-University Bochum, Germany. This paper is available at: http://www.campus-klinik-bochum.de/pdf/Jensenrm12011.pdf.
Figure 7
Figure 7
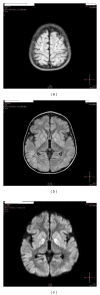
Brain MRI of the patient (L. B.) 2 weeks after cardiac arrest. Note, signs of severe global ischemia in cortical structures as evidenced by (a) signal hyperintensity of gyri in almost entire cortex (FLAIR sequences) and basal ganglia (b), including caudate nucleus and putamen (c) (FLAIR DWI sequences with contrast media) (see video S1, S2 in Supplementary Material [44]).
Figure 8
Figure 8
EEG recording (L. B.) before transplantation. EEG recording. The patient (L. B.) is in a persistent vegetative state 9 weeks after the insult before transplantation of cord blood cells. Note, the dilated, unresponsive pupils in spite of bright light from the ceiling (see video S3 in Supplementary Material [44]).
Figure 9
Figure 9
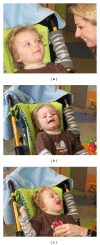
Two-month follow-up: (a) first social smiling of the patient (L. B.) towards his mother and (b), (c) laughing, when played with, 2 months after autologous transplantation of cord blood cells (i.e., 4 months and one week after severe brain damage caused by cardiac arrest). (see video S4 in Supplementary Material [44]).
Figure 10
Figure 10
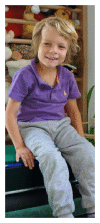
4.5-year follow-up. The boy (L. B.) has now entered primary school at the age of 7 and 4.5 years after transplantation of autologous cord blood after global hypoxic-ischemic brain damage caused by cardiac arrest followed by a quadriplegic persistent vegetative state. He is still using a posterior gait trainer for ambulation. (Follow-up at 2 years see video S5, S6 in Supplementary Material [44]).
Figure 11
Figure 11
The success of autologous cord blood treatment in children with CP caused by hypoxic-ischemic encephalopathy depends on age. Recalculated from Lee et al., Table 1 [45], (HIE, 8/20, 65.2 ± 23.1 SD months, n = 5 versus 37.3 ± 6.0 SD months, n = 3, **P < 0.01, Chi-Square-test). The paper from which the data for recalculation were derived is available online at: http://www.ncbi.nlm.nih.gov/pmc/articles/PMC3369209/.

References

    1. Kancherla V, Amendah DD, Grosse SD, Yeargin-Allsopp M, van Naarden Braun K. Medical expenditures attributable to cerebral palsy and intellectual disability among Medicaid-enrolled children. Research in Developmental Disabilities. 2012;33(3):832–840. - PubMed
    1. Novak I, Hines M, Goldsmith S, Barclay R. Clinical prognostic messages from a systematic review on cerebral palsy. Pediatrics. 2012;130(5):e1285–e1312. - PubMed
    1. Struck A, Almaazmi M, Bode H, et al. Neurodevelopmental outcome of very low birth weight infants born at the Perinatal Centre in Ulm, Germany. Zeitschrift für Geburtshilfe und Neonatologie. 2013;217(2):65–71. - PubMed
    1. Irazábal M, Marsà F, García M, et al. Family burden related to clinical and functional variables of people with intellectual disability with and without a mental disorder. Research in Developmental Disabilities. 2012;33(3):796–803. - PubMed
    1. Centers for Disease Control and Prevention (CDC) Economic costs associated with mental retardation, cerebral palsy, hearing loss, and vision impairment—United States. Morbidity and Mortality Weekly Report. 2003;53:57–59. - PubMed