. 2014 Apr 2;6(230):230ra44.
doi: 10.1126/scitranslmed.3007616.

IL-18 attenuates experimental choroidal neovascularization as a potential therapy for wet age-related macular degeneration

Affiliations

IL-18 attenuates experimental choroidal neovascularization as a potential therapy for wet age-related macular degeneration

Sarah L Doyle et al. Sci Transl Med. .

Abstract

Age-related macular degeneration (AMD) is the most common form of central retinal blindness globally. Distinct processes of the innate immune system, specifically activation of the NLRP3 inflammasome, have been shown to play a central role in the development of both "dry" and neovascular ("wet") forms of the disease. We show that the inflammatory cytokine interleukin-18 (IL-18) can regulate choroidal neovascularization formation in mice. We observed that exogenous administration of mature recombinant IL-18 has no effect on retinal pigment epithelial (RPE) cell viability, but that overexpression of pro-IL-18 or pro-IL-1β alone can cause RPE cell swelling and subsequent atrophy, a process that can be inhibited by the promotion of autophagy. A direct comparison of local and systemic administration of mature recombinant IL-18 with current anti-VEGF (vascular endothelial growth factor)-based therapeutic strategies shows that IL-18 treatment works effectively alone and more effectively in combination with anti-VEGF therapy and represents a novel therapeutic strategy for the treatment of wet AMD.


Conflict of interest statement

Competing interests: TCD owns intellectual property surrounding the use of IL-18 for wet AMD treatment. GSK owns intellectual property surrounding the use of IL-18 for a range of cancers.

Figures

Fig. 1.
Fig. 1.. Comparison of IL-18 (R&D Systems) and IL-18 (GSK).
(A) NKL cells treated with human IL-18 (25 ng/ml) as indicated and immunoblotted for IκB, phospho-p38 MAPK, and tubulin. Representative of three independent experiments. (B) Human PBMCs were stimulated with IL-18 (R&D Systems) or IL-18 (GSK) (25 ng/ml, 18 hours), alone or in combination with IL-12 (30 ng/ml), and analyzed for CD69+ NK cells (gated on CD56+ CD3 cells). (C) Levels of IFN-γ in NK cells from PBMCs costimulated with IL-12 and IL-18 (R&D Systems). (D) CD69+ NK cells in C57BL/6J mouse splenocytes (gated on NKp46+ NK1.1+ CD3 NK cells) stimulated with IL-18 (GSK) (25 ng/ml, 18 hours) with or without IL-12 (10 ng/ml). (E) Intracellular IFN-γ in mouse NK cells from splenocytes costimulated with IL-12 and mIL-18 (R&D Systems). Data in (B) and (C) are means ± SEM (n = 4 human donors). Data in (D) and (E) are means ± SEM (n = 5 mice, three independent experiments). P values in (B) to (E) were determined by analysis of variance (ANOVA) with Dunnett’s multiple comparison test.
Fig. 2.
Fig. 2.. Bioactivity of IL-18 and RPE cell response.
(A and B) Viability of ARPE-19 cells (A) and human myeloid cell line THP1 (B) treated with increasing doses of IL-18 (GSK) for 24 hours. Data are means ± SEM (n = 3 replicates for trypan, 6 for MTS, in three independent experiments). Staurosporine and/or 0.2% SDS were used as controls. P values were determined by ANOVA with Tukey post hoc test. (C) Western blot of IκB and phospho-p38 levels after treatment of ARPE-19 cells with IL-18 or IL-1β for varying amounts of time. β-Actin served as control. (D) NFκB-associated genes were differentially regulated in ARPE-19 cells treated with IL-18 for 6 hours. *P < 0.05, **P < 0.01 versus respective untreated controls, Student’s t test. Data are means ± SEM (n = 3). (E) Proteome array analysis of angiogenesis-associated proteins and cytokines in the medium of ARPE-19 cells treated with IL-18 (40 ng/ml) (R&D Systems) for 24 hours. (F) Expression and localization of ZO-1 in primary human RPE cells treated with increasing doses of IL-18 (R&D Systems) for 24 hours. Images are representative of two biological repeats on different donors. Scale bar, 20 μm.
Fig. 3.
Fig. 3.. Cell swelling with overexpression of pro–IL-18 and pro–IL-1β in human RPE cells.
(A and B) Western blot analysis (A) and phase-contrast images (B) of NLRP3, pro–IL-1β, and pro–IL-18 in ARPE-19 cells 24 hours after transfection with empty vector (EV), pro–IL-18 cDNA, or pro–IL-1β cDNA. Treatment with higher concentrations is in fig. S11. Scale bar, 20 μm. (C) Phase-contrast images of cells treated with IL-1α or TNF-α (3 hours) ± ATP for 30 min. Scale bars, 20 μm. (D) Plasmid map of mouse pro–IL-18 vector driving eGFP expression. ITR, inverted terminal repeat; CMV, cytomegalovirus; IRES, internal ribosome entry site; AmpR, ampicillin resistance. (E) Histological sections of wild-type (WT) and Nlrp3−/− retinas from eyes injected with pro–IL-18 AAV. OPL, outer plexiform layer; INL, inner nuclear layer; IPL, inner plexiform layer; GCL, ganglion cell layer. Scale bars, 50 μm. (F) Number of swollen cells per section of WT and Nlrp3−/− mice injected with pro–IL-18–expressing AAV. Data representative of three measurements per retina with eight mice per group. P value was determined by Student’s t test. (G) OCT analysis of WT and Nlrp3−/− retinas 2 weeks after injection of pro–IL-18 AAV. Scale bar, 200 μm. (H) ONL thickness in WT and Nlrp3−/− retinas 2 weeks after injection of pro–IL-18 AAV. Data are means of three measurements per retina of ONL thickness (n = 6 mice per group). P value was determined by Student’s t test.
Fig. 4.
Fig. 4.. Intravitreal injection of IL-18 prevents CNV.
(A) Terminal deoxynucleotidyl transferase–mediated deoxyuridine triphosphate nick end labeling(TUNEL) staining showed apoptotic/necrotic cells in the retina and RPE in response to mIL-18 (R&D Systems). Images are representative of three mice per treatment. Scale bar, 100 μm. (B) Quantification of TUNEL-positive cells in (A). Data are means ± SEM of five fields of view in cryosections per retina. P value was determined by ANOVA with Dunnett’s multiple comparison test. (C) ERG measurements in mice injected with various concentrations of mIL-18 (GSK). Data are representative of n = 5 mice per group. (D) Histology of retinas after injection of IL-18 (GSK). Scale bar, 100 μm. Images representative of five mice per group. (E) OCT analysis of retinas injected with mIL-18 (GSK). Scale bar, 200 μm. (F) Volume of CNV after intravitreal injection of DMS1529 (10 μg/ml) (mouse anti-VEGF), mIL-18 (50 ng/ml) (GSK), or a combination of the two. Data are means ± SEM (n = 10 animals per group). P values were determined by ANOVA with Tukey post hoc test. Images to the right are representative of CNV volumes in each experimental group.
Fig. 5.
Fig. 5.. Systemic IL-18 controls CNV development.
(A) Bone marrow transplants took place as indicated between WT chimeric mice and Il18−/− mice, and laser-induced CNV volume was quantified. Data are averages ± SEM. (B to D) CNV volume after treatment with IL-18. (B) mIL-18 (GSK) was injected subcutaneously (s.c) 1 day before CNV and each day during the development of CNV. (C) mIL-18 (GSK) was injected on the day of CNV only. (D) mIL-18 (GSK) was injected 2 weeks before CNV. Data are means ± SEM (n = 10 mice per treatment group). (E) ERG analysis of retinal function 1 week after administration of IL-18 (1.0 mg/kg) (GSK) (μV, signal intensity; ms, time between divisions). Data are representative of two mice. For (A) to (D), P values were determined by ANOVA with Tukey post hoc test.
Fig. 6.
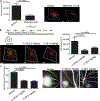
Fig. 6.. IL-18 is an antipermeability factor.
(A) Effect of a combination treatment [anti-VEGF (DMS1529) injected intravitreally (ivt) and mIL-18 (GSK) injected subcutaneously (s.c)] on CNV volume. Data are means ± SEM (n = 10 mice per experimental group; 24 CNV lesions for control and 35 for DMS1529 + IL-18). P value was determined by Student’s t test. (B) mIL-18 (GSK) was injected on the day of CNV and for 3 days after CNV, and CNV volume was quantified. Data are means ± SEM (n = 11 to 18 CNV lesions, with six mice per experimental group). P values were determined by ANOVA with Tukey post hoc test. (C) Vascular permeability in the CNV area upon treatment with mIL-18 (GSK) or vehicle. Data are means ± SEM (n = 8 to 11 CNV lesions). Fluorescein angiography representative of six mice per experimental group. P values were determined by ANOVA with Tukey post hoc test.
Fig. 7.
Fig. 7.. Schematic representation of pro–IL-18 and mature IL-18 bioactivity in RPE cells.
The RPE cell to the left represents the cell response to mature recombinant IL-18. The swollen cell to the right represents the mechanistic response of the RPE cell to overexpression/up-regulation of pro–IL-18.

Comment in

References

    1. Rein DB, Wittenborn JS, Zhang X, Honeycutt AA, Lesesne SB, Saaddine J; Vision Health Cost-Effectiveness Study Group, Forecasting age-related macular degeneration through the year 2050: The potential impact of new treatments. Arch. Ophthalmol. 127, 533–540 (2009). - PubMed
    1. Janeway CA, Medzhitov R, Innate immune recognition. Annu. Rev. Immunol. 20, 197–216 (2002). - PubMed
    1. O’Neill LA, Bowie AG, The family of five: TIR-domain-containing adaptors in Toll-like receptor signalling. Nat. Rev. Immunol. 7, 353–364 (2007). - PubMed
    1. Schroder K, Tschopp J, The inflammasomes. Cell 140, 821–832 (2010). - PubMed
    1. Jager RD, Mieler WF, Miller JW, Age-related macular degeneration. N. Engl. J. Med. 358, 2606–2617 (2008). - PubMed

Publication types

MeSH terms