. 2014 Apr 2;34(14):4845-56.
doi: 10.1523/JNEUROSCI.4390-13.2014.

Does the processing of sensory and reward-prediction errors involve common neural resources? Evidence from a frontocentral negative potential modulated by movement execution errors

Affiliations

Does the processing of sensory and reward-prediction errors involve common neural resources? Evidence from a frontocentral negative potential modulated by movement execution errors

Flavie Torrecillos et al. J Neurosci. .

Abstract

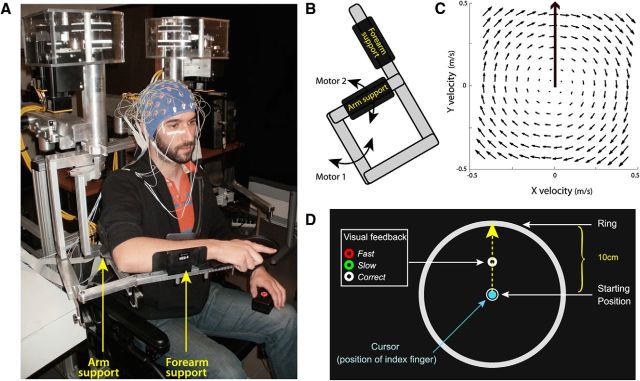
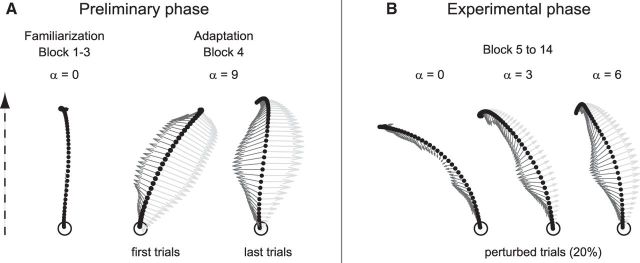
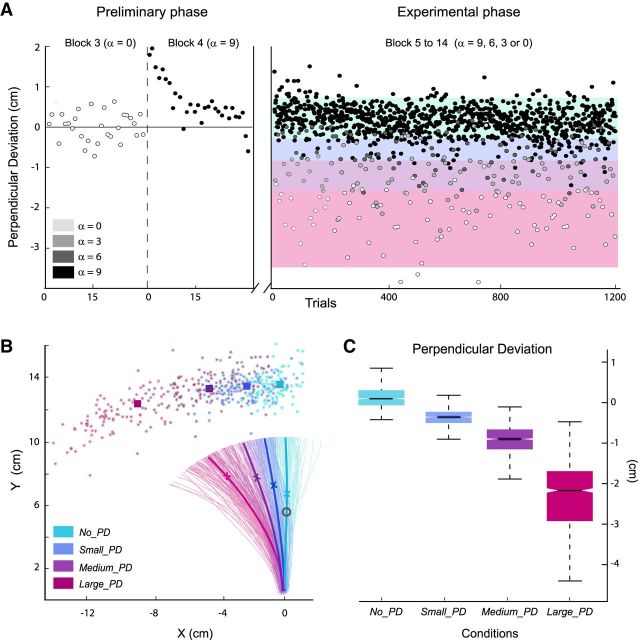
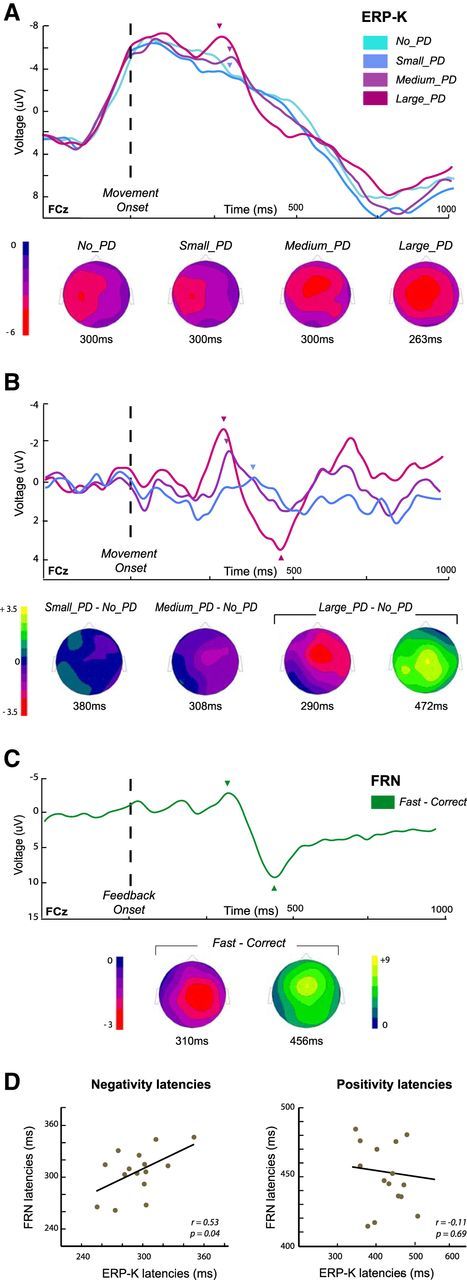
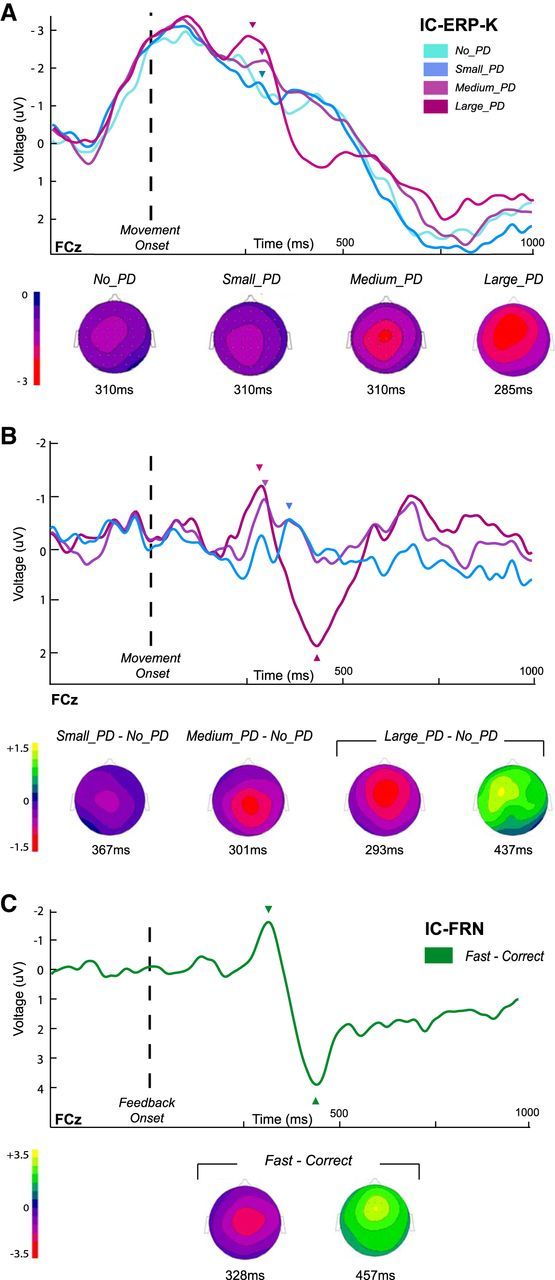
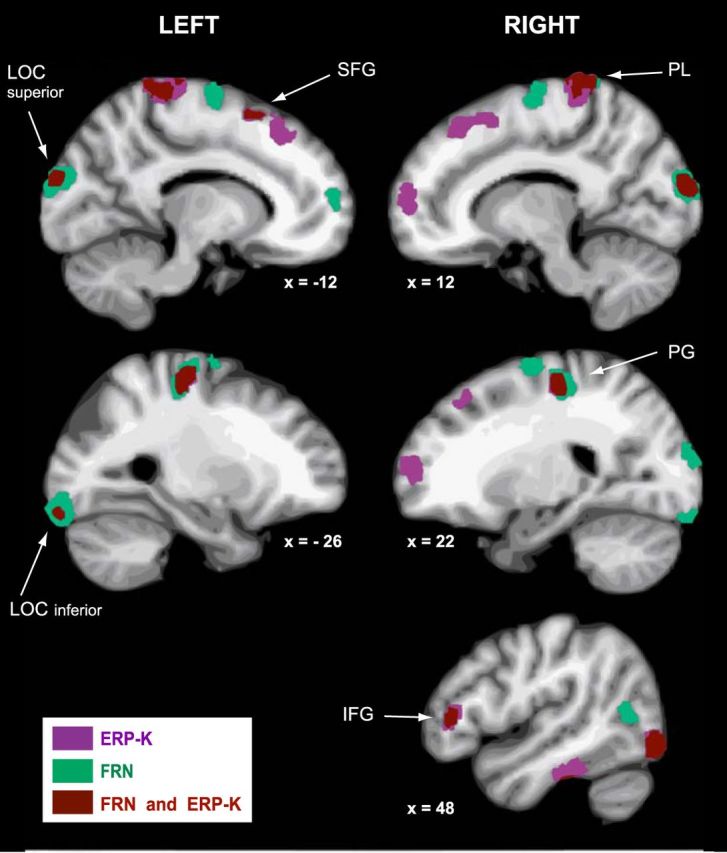
In humans, electrophysiological correlates of error processing have been extensively investigated in relation to decision-making theories. In particular, error-related ERPs have been most often studied using response selection tasks. In these tasks, involving very simple motor responses (e.g., button press), errors concern inappropriate action-selection only. However, EEG activity in relation to inaccurate movement-execution in more complex motor tasks has been much less examined. In the present study, we recorded EEG while volunteers performed reaching movements in a force-field created by a robotic device. Hand-path deviations were induced by interspersing catch trials in which the force condition was unpredictably altered. Our goal was twofold. First, we wanted to determine whether a frontocentral ERP was elicited by sensory-prediction errors, whose amplitude reflected the size of kinematic errors. Then, we explored whether common neural processes could be involved in the generation of this ERP and the feedback-related negativity (FRN), often assumed to reflect reward-prediction errors. We identified a frontocentral negativity whose amplitude was modulated by the size of the hand-path deviations induced by the unpredictable mechanical perturbations. This kinematic error-related ERP presented great similarities in terms of time course, topography, and potential source-location with the FRN recorded in the same experiment. These findings suggest that the processing of sensory-prediction errors and the processing of reward-prediction errors could involve a shared neural network.

Keywords: EEG-ERP; arm-movements; error-processing; feedback-related negativity; force-field; kinematics.


Figures

Figure 1.
Figure 1.
Experimental setup. A, EEG was recorded while participants performed reaching movements in a force-field created by a robotic exoskeleton. B, The field was produced by applying mechanical loads to the shoulder and elbow joints through two torque-motors (M1 and M2). C, Using the transformation from joint torque to endpoint force, a clockwise curl-field was created in which the force applied to the hand was proportional and acted perpendicular to the velocity of the hand. D, The robotic device was coupled with a virtual 2D reality display (data not shown here) that permit to project visual stimuli in the same horizontal plane as the hand. Participants had to make “shooting” movements in the direction of the donut, and cross the outer ring within 375 ± 50 ms. At the time their index reached the ring, the donut changed color providing feedback about movement duration.
Figure 2.
Figure 2.
Representative hand-paths along with vectors (arrows) with schematic representations of the forces applied by the robot (light gray) and the force applied by the participant's hand (dark gray). The dotted arrow indicates the direction of the movements. A, Preliminary familiarization and force-field adaptation phase. Before adaptation, movements performed in the null field (α = 0) were roughly straight. Upon initial exposure to the force-field (α = 9), hand paths were clearly deviated. However, participants quickly (within 10–15 trials) adapted to the new dynamic condition, and by the end of the adaptation block they moved straight ahead again. B, After adaptation, during the experimental phase, movements performed in the strongest force-field (α = 9) were not perturbed anymore and thus corresponded to unperturbed trials. In contrast, reducing the force-field amplitude in catch trials to α = 0, 3, or 6 produced usually large, medium, and small kinematics errors.
Figure 3.
Figure 3.
Behavioral data. A, For a representative participant, PD of the last 60 trials of the familiarization phase (Blocks 3 and 4) and the 1200 trials of the experimental phase. Trials were binned into four categories according to their PD (color bands): No_PD, Small_PD, Medium_PD, and Large_PD. B, For the same participant, hand paths for all individual trials of the experimental phase; colored stars show hand positions at movement ends. The mean hand-paths for the different categories of trials are plotted in thick lines mean hand-positions at velocity-peak and movement-end are shown by crosses and squares, respectively. The eye-fixation donut (visual feedback) is also indicated in gray. C, Box plots indicating for each categories of trials, the 25th, 50th, and 75th percentiles, as well as the extreme values of the mean PD of all trials.
Figure 4.
Figure 4.
ERPs related to the kinematic errors (ERP-K) and to the movement-duration feedback (FRN). A, Grand average ERP-Ks for the four categories of trials, No_PD, Small_PD, Medium_PD, and Large_PD, at the FCz electrode. Topographies are shown at the center of the 30 ms signal-amplitude averaging-windows indicated by arrowheads (see Materials and Methods). B, Grand averages of the ERP-K difference-waveforms corresponding to the three categories of perturbed trials, Small_PD, Medium_PD, and Large_PD conditions. In each case, the topographies are shown at the peak of the negativity (arrowheads). For the Large_PDNo_PD difference curve, the topography at the positivity peak is also presented. C, Grand averaged of the FRN (fastcorrect difference curves). Topographies are shown at the negativity- and positivity-peak latencies (arrowheads). D, Scatter plots showing the relation between the latencies of the negative and positive components of the two types of ERPs. Within-subject correlations have been calculated between the peak latencies identified on the difference waves Large_PDNo_PD (ERP-K) and fastcorrect (FRN).
Figure 5.
Figure 5.
IC-ERPs obtained from the EEG signals reconstructed from the ICs related to the processing of the kinematic errors (see Materials and Methods). IC-ERP-Ks were calculated by time locking the new signals on the onset of movement and IC-FRNs were obtained by time locking on the presentation of the movement-duration feedback. A, Grand average IC-ERP-Ks for the four categories of trials, No_PD, Small_PD, Medium_PD, and Large_PD, at the FCz electrode. Topographies are shown at the center of the 30 ms signal amplitude averaging-windows indicated by arrowheads (see Materials and Methods). B, Grand averages of the 15 individual IC-ERP-K difference waveforms for the three categories of perturbed trials. Topographies are shown at the peak latencies (arrowheads). C, Grand averaged of the IC-FRN (fastcorrect difference curves). Topographies are shown at the negativity- and positivity-peak latencies (arrowheads).
Figure 6.
Figure 6.
For the difference waves Large_PDNo_PD (ERP-K) and fastcorrect (FRN), regions showing significant activation in at least 10 of the 15 participants (see Materials and Methods). Areas are indicated in violet for the ERP-K, in green for the FRN, and regions overlaps are indicated in brown. The coordinates of the centroids of the clusters are listed in Table 1. IFG, Inferior frontal gyrus; LOC, lateral occipital cortex; PG, precentral gyrus; PL, paracentral lobule; SFG, superior frontal gyrus.

Comment in

References

    1. Aguera PE, Jerbi K, Caclin A, Bertrand O. Elan: a software package for analysis and visualization of MEG, EEG, and LFP signals. Comput Intell Neurosci. 2011;2011:158970. doi: 10.1155/2011/158970. - DOI - PMC - PubMed
    1. Albouy P, Mattout J, Bouet R, Maby E, Sanchez G, Aguera PE, Daligault S, Delpuech C, Bertrand O, Caclin A, Tillmann B. Impaired pitch perception and memory in congenital amusia: the deficit starts in the auditory cortex. Brain. 2013;136:1639–1661. doi: 10.1093/brain/awt082. - DOI - PubMed
    1. Alexander WH, Brown JW. Computational models of performance monitoring and cognitive control. Top Cogn Sci. 2010;2:658–677. doi: 10.1111/j.1756-8765.2010.01085.x. - DOI - PMC - PubMed
    1. Alexander WH, Brown JW. Medial prefrontal cortex as an action-outcome predictor. Nat Neurosci. 2011;14:1338–1344. doi: 10.1038/nn.2921. - DOI - PMC - PubMed
    1. Anguera JA, Seidler RD, Gehring WJ. Changes in performance monitoring during sensorimotor adaptation. J Neurophysiol. 2009;102:1868–1879. doi: 10.1152/jn.00063.2009. - DOI - PMC - PubMed

Publication types

LinkOut - more resources