. 2014 Apr 2;34(14):4857-70.
doi: 10.1523/JNEUROSCI.0688-13.2014.

Postnatal odorant exposure induces peripheral olfactory plasticity at the cellular level

Affiliations

Postnatal odorant exposure induces peripheral olfactory plasticity at the cellular level

Hervé Cadiou et al. J Neurosci. .

Abstract

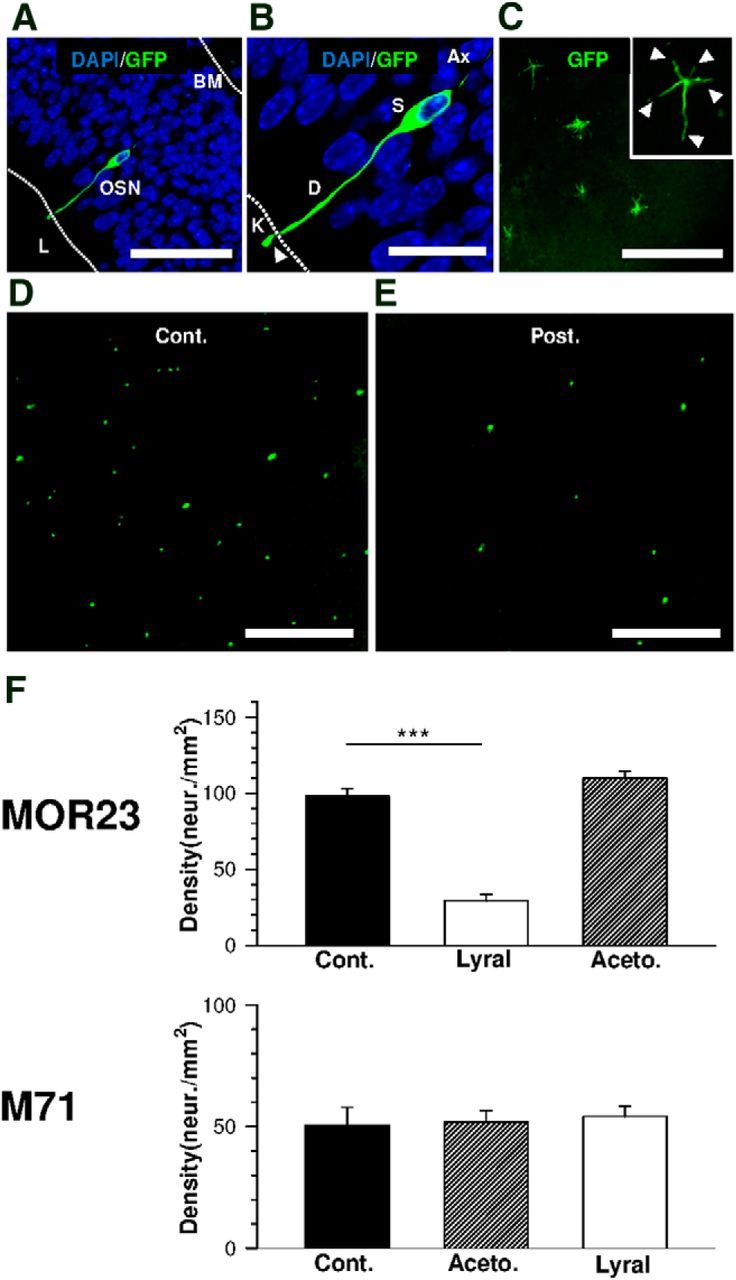
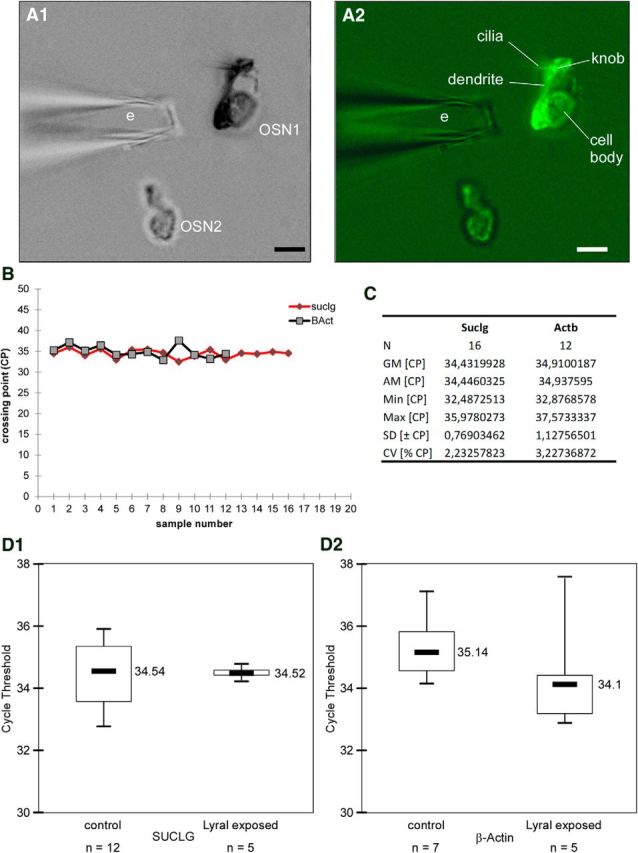
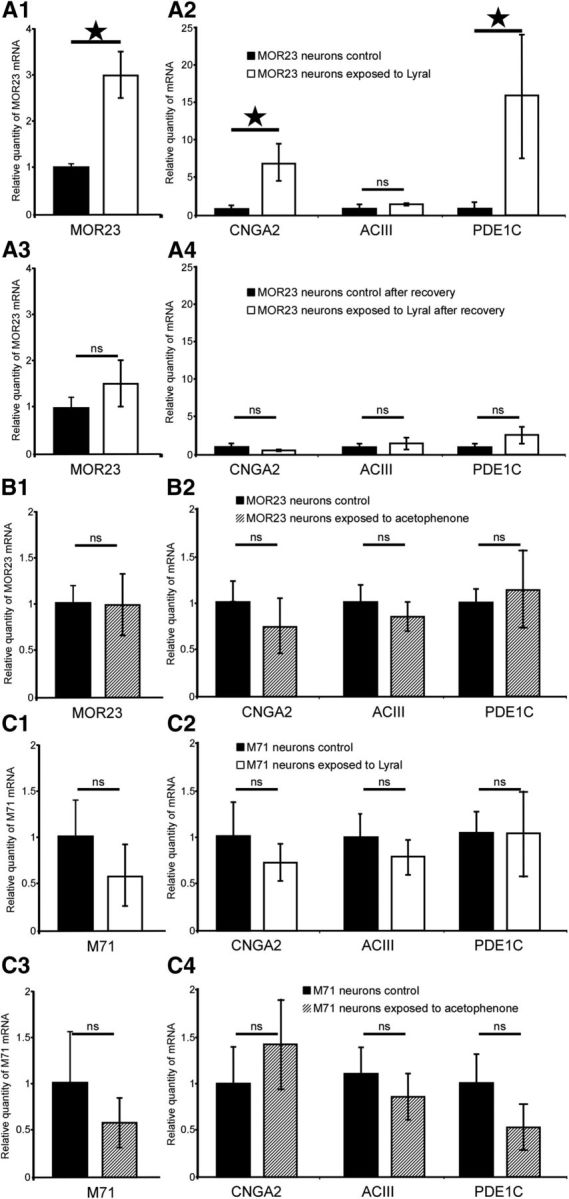
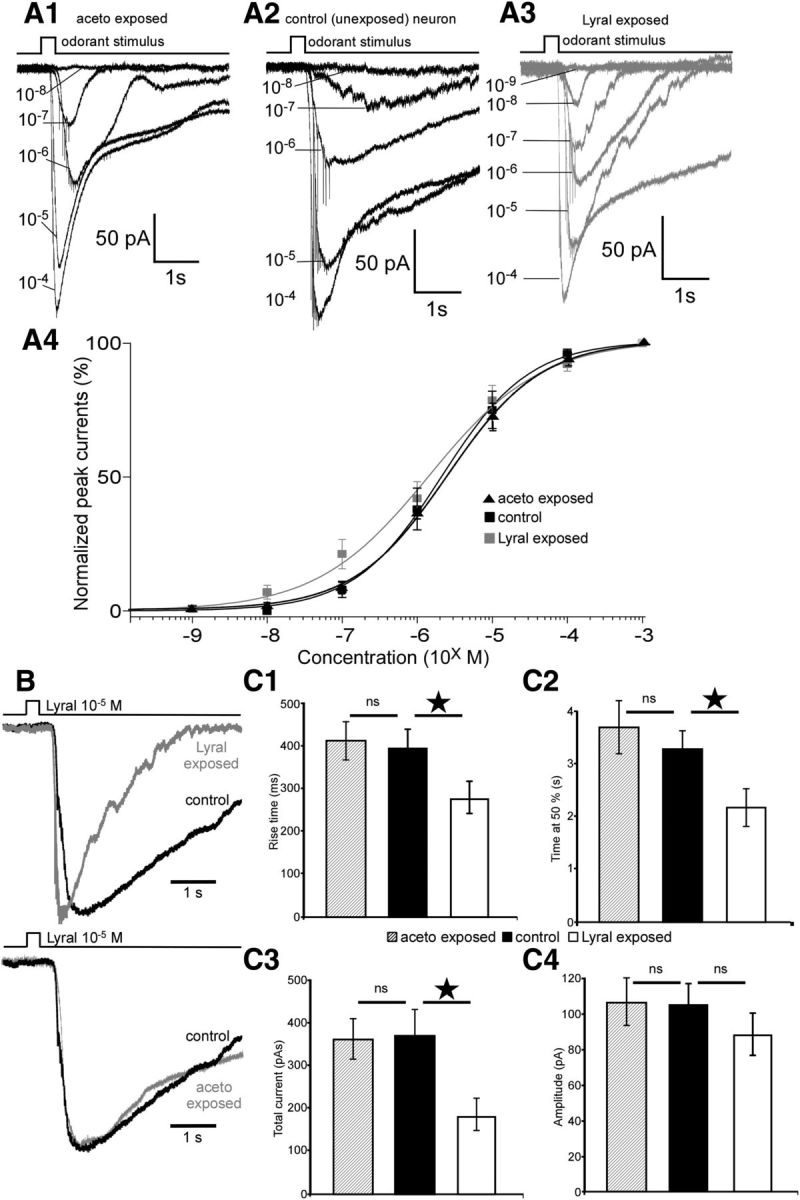
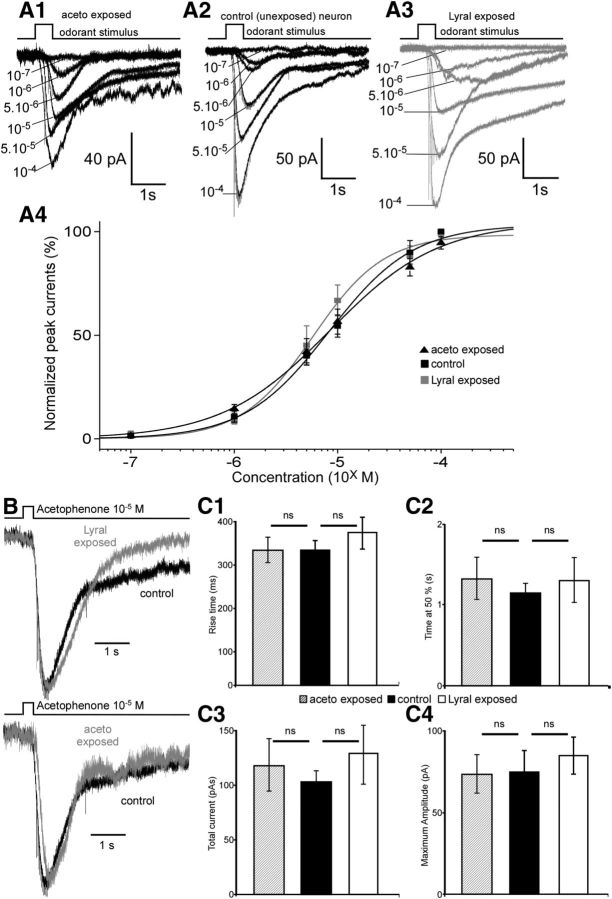
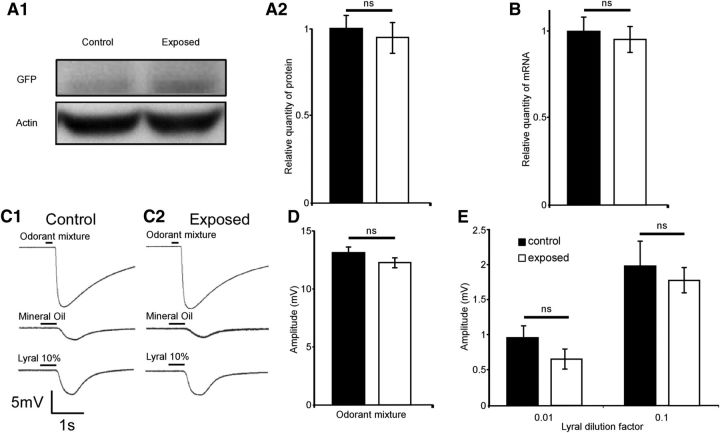
Mammalian olfactory sensory neurons (OSNs) form the primary elements of the olfactory system. Inserted in the olfactory mucosa lining of the nasal cavity, they are exposed to the environment and their lifespan is brief. Several reports say that OSNs are regularly regenerated during the entire life and that odorant environment affects the olfactory epithelium. However, little is known about the impact of the odorant environment on OSNs at the cellular level and more precisely in the context of early postnatal olfactory exposure. Here we exposed MOR23-green fluorescent protein (GFP) and M71-GFP mice to lyral or acetophenone, ligands for MOR23 or M71, respectively. Daily postnatal exposure to lyral induces plasticity in the population of OSNs expressing MOR23. Their density decreases after odorant exposure, whereas the amount of MOR23 mRNA and protein remain stable in the whole epithelium. Meanwhile, quantitative PCR indicates that each MOR23 neuron has higher levels of olfactory receptor transcripts and also expresses more CNGA2 and phosphodiesterase 1C, fundamental olfactory transduction pathway proteins. Transcript levels return to baseline after 4 weeks recovery. Patch-clamp recordings reveal that exposed MOR23 neurons respond to lyral with higher sensitivity and broader dynamic range while the responses' kinetics were faster. These effects are specific to the odorant-receptor pair lyral-MOR23: there was no effect of acetophenone on MOR23 neurons and no effect of acetophenone and lyral on the M71 population. Together, our results clearly demonstrate that OSNs undergo specific anatomical, molecular, and functional adaptation when chronically exposed to odorants in the early stage of life.

Keywords: development; electrophysiology; mice; molecular biology; olfaction; plasticity.


Figures

Figure 1.
Figure 1.
Postnatal exposure to lyral significantly reduces the density of MOR23-GFP olfactory sensory neurons. A, Confocal image showing an individual MOR23-GFP OSN within the septal olfactory epithelium. BM, Basal membrane; L, lumen. Scale bar, 50 μm. B, Magnification of the OSN presented in A. The somas (S) of OSNs are located within the epithelium in nuclei-rich area. Individual neurons project to the surface through a dendritic process (D). Knob (K) carries cilia (white arrow). Scale bar, 20 μm. C, Confocal image showing individual MOR23-GFP OSN knobs in a septal olfactory epithelium flat-mount preparation. A close-up look at an individual knob can be seen in the right upper corner of the picture (white arrows indicate the cilia). Scale bar, 50 μm. D, E, Confocal images showing a decrease in MOR23-GFP neuron density when mice are exposed to lyral between P0 and P21. D, Control (Cont.). E, Postnatal exposure (Post.). Scale bar, 200 μm. F, Bar graphs summarizing the effects of odorant exposure on MOR23 and M71 population. The neuronal density was calculated as the number of neurons per epithelium/total surface of the epithelium (see Materials and Methods). Top, Summary of the density of the MOR23 population after postnatal exposure to lyral (n = 20) or acetophenone (Aceto.; n = 12); n = 23 for control (Cont.). Bottom, Summary of the density of the M71 population after postnatal exposure to lyral (n = 5) or acetophenone (n = 7); n = 10 for control. ***p < 0.001.
Figure 2.
Figure 2.
GFP-labeled cells harvesting and design of valid reference genes for reverse-transcription qPCR on small samples. A, Isolated cells can be selected for their fluorescence: photographs of dissociated neurons are seen in bright field (A1) and under fluorescence (A2). Two OSNs are visible: OSN1 expresses GFP and MOR23 and is fluorescent while OSN2 is not fluorescent and expresses another type of receptor. The pipette used to harvest fluorescent OSNs is visible (e) while the different anatomical features of the OSN can be observed (cilia, knob, dendrite, and cell body). Scale bar, 5 μm. B, Graph representing the crossing point values of the reference genes in harvested MOR23 neurons. Sample number equals single MOR23 neuron. C, Table summarizing the data of candidate housekeeping genes. N, Number of samples; GM [CP], the geometric mean of crossing points (CP); AM [CP], the arithmetic mean of CP; Min [CP] and Max [CP], the extreme values of CP; SD [±CP], the SD of the CP; CV [%CP], the coefficient of variance expressed as a percentage of the CP level. D, Boxplot representation of reference gene expression variability for each individual group in the analysis for the two genes tested, Suclg (D1) and β-actin (D2). Statistically significant differences were not found among the level expression in both groups. On the y-axis cycle threshold values are represented. Median values are also shown. Statistical analysis was performed using the Student's t test, considering p < 0.05 statistically significant.
Figure 3.
Figure 3.
Postnatal exposure to lyral triggers an increase in mRNA level for MOR23, CNGA2, and PDE1C at the cellular level only in MOR23 neurons. A1, A2, Histogram representations of reverse-transcription qPCR measurements of mRNA levels for MOR23 (A1) and for CNGA2, ACIII, and PDE1C (A2) in MOR23 OSNs from lyral-exposed or nonexposed MOR23 mice. Results were normalized to Suclg for each sample. Results are presented in arbitrary units and the values obtained for nonexposed mice were set at 1 (n = 6 for MOR23 gene analysis, 5 for ACIII, 4 for ACIII and PDE1C). A3, A4, Histogram representations of reverse-transcription qPCR measurements of mRNA levels for MOR23 (A3) and for CNGA2, ACIII, and PDE1C (A4) in MOR23 OSNs from lyral-exposed and nonexposed mice after recovery. Results were normalized to Suclg for each sample. Results are presented in arbitrary units and the values obtained for nonexposed mice were set at 1 (n = 7 for control and n = 8 for recovery for all genes). B1, B2, Histogram representations of reverse-transcription qPCR measurements of mRNA levels for MOR23 (B1) and for CNGA2, ACIII, and PDE1C (B2) in MOR23 OSNs from acetophenone-exposed or nonexposed MOR23 mice. Results were normalized to Suclg for each sample. Results are presented in arbitrary units and the values obtained for nonexposed mice were set at 1 (n = 9 for exposed neurons, 11 for control neurons for all genes). C1, C2, Histogram representations of reverse-transcription qPCR measurements of mRNA levels for M71 (C1) and for CNGA2, ACIII, and PDE1C (C2) in M71 OSNs from lyral-exposed or nonexposed M71 mice. Results were normalized to Suclg for each sample. Results are presented in arbitrary units and the values obtained for nonexposed mice were set at 1 (n = 6 for exposed neurons, 6 for control neurons for all genes). C3, C4, Histogram representations of reverse-transcription qPCR measurements of mRNA levels for M71 (C3) and for CNGA2, ACIII, and PDE1C (C4) in M71 OSNs from acetophenone-exposed or nonexposed M71 mice. Results were normalized to Suclg for each sample. Results are presented in arbitrary units and the values obtained for nonexposed mice were set at 1 (n = 10 for exposed neurons, 7 for control neurons for all genes). *p < 0.05; ns, not significant; error bars indicate SEM.
Figure 4.
Figure 4.
Postnatal exposure to lyral changes the sensitivity and kinetics of responses to lyral in MOR23 cells. A1–A3, Dose–response relationships of MOR23 cells in response to lyral: examples of an acetophenone-exposed cell (A1) and a control cell (A2) start to respond at 10−7 m while a lyral-exposed cell (A3) starts to respond at 10−8 m. A4, Average dose–response curves of the amplitude currents normalized to the maximum amplitude fitted with Hill equation in lyral-exposed (n = 10), acetophenone-exposed (n = 7), and control cells (n = 12). B, Top, Representative responses of a lyral-exposed (gray) and a control (black) MOR23 neuron to 10−5 m lyral normalized to the same peak amplitude. Bottom, Representative responses of an acetophenone-exposed (gray) and a control (black) MOR23 neuron to 10−5 m lyral normalized to the same peak amplitude. C, Quantification of the kinetics characteristics of control (n = 18), lyral-exposed (n = 19), and acetophenone-exposed (n = 12) MOR23 neurons in response to 10−5 m: analysis of the rise time (C1), the time at 50% (C2), the total current elicited (C3), and the maximum amplitude (C4). All recordings performed in perforated patch and at a membrane potential of −65 mV. *p < 0.05; ns, no significant; error bars indicate SEM.
Figure 5.
Figure 5.
Postnatal exposure to acetophenone or lyral does not change the sensitivity or kinetics of responses to acetophenone in M71 cells. A1–A3, Dose–response relationships of M71 cells in response to acetophenone: examples of an acetophenone-exposed cell (A1), a control cell (A2), and a lyral-exposed cell (A3) start to respond at 10−6 m. A4, Average dose–response curves of the amplitude currents normalized to the maximum amplitude fitted with Hill equation in lyral-exposed (n = 6), acetophenone-exposed (n = 8), and control cells (n = 4). B, Top, Representative responses of a lyral-exposed (gray) and a control (black) M71 neuron to 10−5 m acetophenone normalized to the same peak amplitude. Bottom, Representative responses of an acetophenone-exposed (gray) and a control (black) M71 neuron to 10−5 m acetophenone normalized to the same peak amplitude. C, Quantification of the kinetics characteristics of control (n = 6), lyral-exposed (n = 10), and acetophenone-exposed (n = 10) M71 neurons in response to 10−5 m: analysis of the rise time (C1), the time at 50% (C2), the total current elicited (C3), and the maximum amplitude (C4). All recordings performed in perforated patch and at a membrane potential of −65 mV. ns, Not significant; error bars indicate SEM.
Figure 6.
Figure 6.
Postnatal exposure to lyral does not affect the expression of MOR23 at the olfactory epithelium level and does not modify the response of the epithelium to lyral. A1, Western blot of exposed and control epitheliums for GFP and the control protein actin. Band densitometry was performed using Image Lab software (Bio-Rad Laboratories) gels for quantification of signals from three control and three exposed animals. A2, Results are presented in GFP band volume normalized to actin, a loading control. B, Quantification by reverse-transcription qPCR of the level of MOR23 mRNA in olfactory epithelium from exposed or nonexposed mice. Results were normalized to Suclg for each sample. The results are presented in arbitrary units and the values obtained for nonexposed mice were set at 1 (n = 10 for both groups). C–E, Consequences of postnatal exposure to lyral on EOG recordings in response to an odor mixture, mineral oil, and lyral. C, Representative recordings in response to 200 ms stimulus of 1:1000 dilution of the odor mixture (top), 500 ms stimulus with mineral oil (middle), and 500 ms stimulus of lyral 10% dilution (bottom) in a control mouse (C1) and an exposed mouse (C2). D, Quantification histogram of the maximum amplitude of the response to the 1:1000 dilution of the mixture in control mice (black bar, n = 17) and exposed mice (white bar, n = 36). E, Quantification histogram of the maximum amplitude of the response to 1% (left; n = 17 for control mice; n = 44 for exposed mice) and 10% (right; n = 17 for control mice; n = 37 for exposed mice) dilution of lyral. ns, Not significant; error bars indicate SEM.

References

    1. Bano D, Nicotera P. Ca2+ signals and neuronal death in brain ischemia. Stroke. 2007;38:674–676. doi: 10.1161/01.STR.0000256294.46009.29. - DOI - PubMed
    1. Benjamini Y, Hochberg Y. Controlling the false discovery rate: a practical and powerful approach to multiple testing. J R Stat Soc Series B Stat Methodol. 1995;57:289–300.
    1. Bozza T, Feinstein P, Zheng C, Mombaerts P. Odorant receptor expression defines functional units in the mouse olfactory system. J Neurosci. 2002;22:3033–3043. - PMC - PubMed
    1. Brenneman KA, James RA, Gross EA, Dorman DC. Olfactory neuron loss in adult male CD rats following subchronic inhalation exposure to hydrogen sulfide. Toxicol Pathol. 2000;28:326–333. doi: 10.1177/019262330002800213. - DOI - PubMed
    1. Buck L, Axel R. A novel multigene family may encode odorant receptors: a molecular basis for odor recognition. Cell. 1991;65:175–187. doi: 10.1016/0092-8674(91)90418-X. - DOI - PubMed

Publication types

MeSH terms

LinkOut - more resources