. 2014 May 9;289(19):13363-73.
doi: 10.1074/jbc.M114.561076. Epub 2014 Apr 2.

Binding site and inhibitory mechanism of the mambalgin-2 pain-relieving peptide on acid-sensing ion channel 1a

Affiliations

Binding site and inhibitory mechanism of the mambalgin-2 pain-relieving peptide on acid-sensing ion channel 1a

Miguel Salinas et al. J Biol Chem. .

Abstract

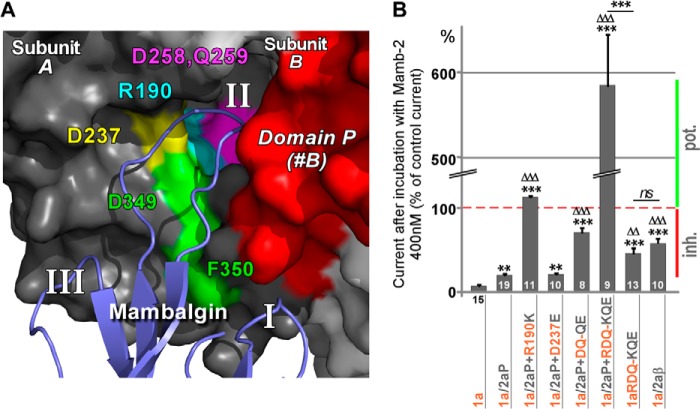
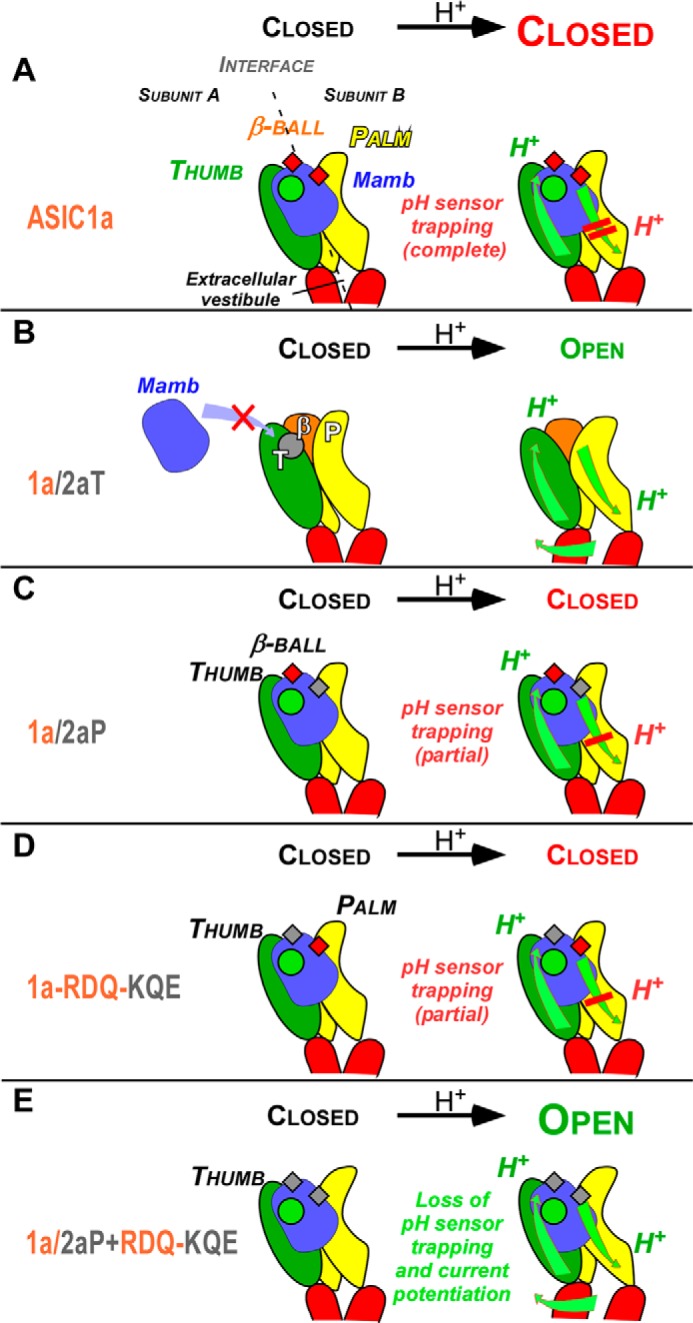
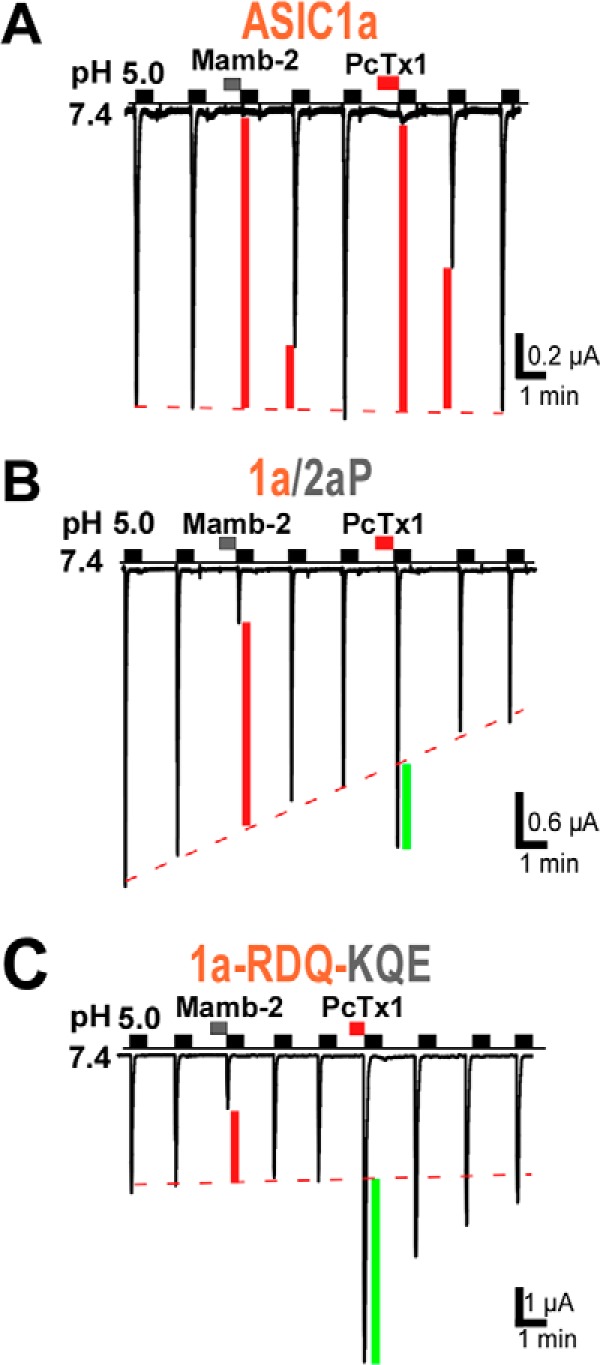
Acid-sensing ion channels (ASICs) are neuronal proton-gated cation channels associated with nociception, fear, depression, seizure, and neuronal degeneration, suggesting roles in pain and neurological and psychiatric disorders. We have recently discovered black mamba venom peptides called mambalgin-1 and mambalgin-2, which are new three-finger toxins that specifically inhibit with the same pharmacological profile ASIC channels to exert strong analgesic effects in vivo. We now combined bioinformatics and functional approaches to uncover the molecular mechanism of channel inhibition by the mambalgin-2 pain-relieving peptide. Mambalgin-2 binds mainly in a region of ASIC1a involving the upper part of the thumb domain (residues Asp-349 and Phe-350), the palm domain of an adjacent subunit, and the β-ball domain (residues Arg-190, Asp-258, and Gln-259). This region overlaps with the acidic pocket (pH sensor) of the channel. The peptide exerts both stimulatory and inhibitory effects on ASIC1a, and we propose a model where mambalgin-2 traps the channel in a closed conformation by precluding the conformational change of the palm and β-ball domains that follows proton activation. These data help to understand inhibition by mambalgins and provide clues for the development of new optimized blockers of ASIC channels.

Keywords: Acid-sensing Ion Channels (ASIC); Pain; Pharmacology; Sodium Channels; Toxins.


Figures

FIGURE 1.
FIGURE 1.
Molecular docking of mambalgin-2 on the three-dimensional model structure of rat ASIC1a. A, surface representation of the ASIC1a·mambalgin-2 complex (side view in the top panel and top view in the bottom panel). Subunits are shown with different gray levels; toxins are shown in blue. The structure of mambalgin-2 (Mamb-2) alone is shown on the left with labeling of the different fingers (see Ref. for further details on the structure). B, close view of the mambalgin-2 binding site at the interface between subunits A and B (a mapping of the region in a schematic of the trimeric channel is displayed at the bottom right). The toxin with its fingers I, II, and III is shown in blue ribbon. Domains in the ASIC1a extracellular loop are shown with different colors and refer to the domains identified by Jasti et al. (32) and listed in the inset. Transmembrane domains 1 and 2 are represented by only one red block (TM1+TM2). C, localization of the three domains potentially located at the interface with mambalgin-2 on a surface representation of a trimeric rat ASIC1a channel (side view). D and E, localization of the same domains on a schematic representation of the channel (D) and on a linear representation of an isolated subunit (E). F, protein sequence alignment of the rat ASIC1a and ASIC2a proteins (the N- and C-terminal cytoplasmic domains are not shown). Amino acids that are identical or similar are printed white on black or black on gray background, respectively. The two transmembrane domains (M1 and M2) as well as domains P, β, and T are indicated above the sequences. Key residues identified in this study for the mambalgin-2 effect are highlighted by red squares.
FIGURE 2.
FIGURE 2.
pH-dependent activation and inactivation of the chimera and mutant currents. ASIC1a-based and ASIC2a-based chimeras are shown in A and B, respectively. Solid lines are fits of the mean values of each data point to a sigmoidal dose-response curve with variable slope. See Table 1 for pH0.5 of activation and inactivation; the protocol is shown in the inset. Data points and error bars represent the mean ± S.E.
FIGURE 3.
FIGURE 3.
The P, β, and T domains are needed for sensitivity to mambalgin-2. A–D, representative current traces generated by ASIC1a and ASIC1a/2a chimeras and evoked by pH 5.0 pulses of 30 s made at 1-min intervals from a holding pH of 7.4 (holding potential, −50 mV). Mambalgin-2 (Mamb-2) (400 nm) was applied for 30 s before the pH pulse. Three pulses before toxin application and two pulses after washing are shown for consistency. The red dashed line represents the current rundown, and a schematic illustrating the domain in ASIC1a that was swapped is shown beside the current trace for each chimera. E, bar graph representing the effects shown in A–D expressed as a percentage of the control current without toxin. The number of oocytes analyzed is shown within each histogram. Error bars represent S.E. Statistical comparison is with ASIC1a. F, mapping on the three-dimensional model structure of the ASIC1a·mambalgin-2 complex of residues in domain T that were mutated and are putatively involved in the interaction with mambalgin-2 (toxin shown in ribbon representation). Note that Val-352 cannot be displayed because it points toward the interior of the channel. G, bar graph representing the effect of mambalgin-2 (200 and 400 nm) on the different ASIC1a point mutants shown in F. The number of oocytes analyzed is indicated within each histogram. Data are means ± S.E. (error bars). Statistical comparison is with ASIC1a unless specified.
FIGURE 4.
FIGURE 4.
Binding of mambalgin-2 exerts both stimulatory and inhibitory effects on ASIC channels supported by domains T and P, respectively. A–D, representative current traces generated by ASIC2a and ASIC2a/1a chimeras. Experimental conditions were similar to those in Fig. 3 (400 nm mambalgin-2 (Mamb-2)). Domains in ASIC2a that were swapped are shown in a schematic beside each chimera. E, bar graph representing the effects shown in A–D. The number of oocytes analyzed is mentioned within each histogram. Data are means ± S.E. (error bars). Statistical comparison is with ASIC2a unless specified. Inhibition (Inh.) or potentiation (pot.) of the current by the toxin is indicated by a red or green bar, respectively.
FIGURE 5.
FIGURE 5.
Effect of mambalgin-2 on the pH-dependent activation and inactivation of different chimera currents. A, inactivation ratios (I/Imax) for ASIC1a were calculated in the absence or presence of toxin after stimulation at pH 5.0 from holding pH 8.0 (Imax) and holding pH 7.1 (I), a value chosen in the descending part of the curves (a or a′). Activation ratios (I/Imax) for ASIC1a were calculated in the absence or presence of toxin from holding pH 8.0 and after stimulation at pH 4.0 (Imax) and pH 6.2 (I), a value selected in the ascending part of the curves (b or b′). Protocols used to generate the inactivation (inacti) and activation (acti) curves are shown in the inset, i.e. variable holding pH values and test pH 5.0 for inactivation and holding pH 8.0 and variable test pH values for activation. B–E, inactivation and activation ratios for ASIC1a (B) and different chimeras (C–E). Test and holding pH values for the different chimeras were chosen to be in the ascending or descending portion of the activation and inactivation curves, respectively, based on their properties shown in A (for ASIC1a) and in Table 1 and Fig. 2. Protocols are indicated in the inset with short horizontal lines indicating variable holding pH and unique test pH (for inactivation) and variable test pH from a unique holding pH (for activation). Recordings with or without mambalgin-2 (400 nm; except for ASIC1a 200 nm) were made on the same oocyte (paired measures). Error bars represent S.E. F, ratios corresponding to data shown in B–E. The pH-dependent inactivation is not significantly affected by mambalgin-2 in the different chimeras, but the pH-dependent activation is shifted toward more alkaline pH (chimeras 1a/2aP+RDQ-KQE and 2a/1aT) or more acidic pH (chimera 2a/1aT+P). This shift of the activation curve toward more acidic or more alkaline pH represents stabilization or destabilization of the closed state of the channel, respectively, and explains in large part inhibition or potentiation by the toxin. ns, no significant shift of the curve; Tx, toxin mambalgin-2.
FIGURE 6.
FIGURE 6.
Residues of the β-ball at the bottom of the acidic pocket are necessary for inhibition by mambalgin-2. A, magnification of the modeled interaction between finger II of mambalgin-2 and the acidic pocket of ASIC1a at the interface between subunits A and B. Amino acids of the β-ball putatively involved in the interaction and mutated in subunit B are shown in different colors. Domain P from subunit B is shown in red, and residues Asp-349 and Phe-350 identified in Fig. 3 are also shown. B, bar graph representing the effect of mambalgin-2 (Mamb-2) on different chimeras bearing the domain P of ASIC2a and/or point mutations of key residues from the β-ball of ASIC1a (mapped in A). The number of oocytes analyzed is shown within (or below) each histogram. Data are means ± S.E. (error bars). Statistical comparison is with ASIC1a (*) or ASIC1a/2aP (▵) unless specified. Inhibition (Inh.) or potentiation (pot.) of the current by the toxin is indicated by a red or green bar, respectively.
FIGURE 7.
FIGURE 7.
A pH sensor-trapping model for inhibition of ASIC1a by mambalgins. A model to describe the interaction of mambalgins on rat ASIC1a is shown together with the proposed mechanism of gating modulation. The model was challenged with four representative chimeras described in the study that differentially affect the pH-activated current. Conformational changes are represented by green arrows, the interaction between mambalgin (Mamb) and the thumb domain crucial for toxin binding and the potentiating effect is symbolized by a circle (in green if formed and destabilizing the closed state or in gray if disrupted), and interfaces with the β-ball and palm domains are symbolized by small squares (in red if stabilizing the closed state or in gray if altered). Protonation by low pH of the acidic pocket and of the lower palm domain is indicated. See “Discussion” for details.
FIGURE 8.
FIGURE 8.
Comparison of the effect of mambalgin-2 and PcTx1 on the ASIC1a/2aP chimera and ASIC1a-RDQ-KQE triple mutant. PcTx1 inhibited ASIC1a (IPcTx1/ICTR = 8 ± 2%, n = 4) but evoked current potentiation in chimera ASIC1a/2aP (IPcTx1/ICTR = 153 ± 7%, n = 10) and in mutant ASIC1a-RDQ-KQE (IPcTx1/ICTR = 312 ± 63%, n = 4) contrary to mambalgin-2, which has an inhibitory effect in both cases. Inhibition or potentiation of the current by the toxin is indicated by a red or green bar, respectively.

References

    1. Waldmann R., Champigny G., Bassilana F., Heurteaux C., Lazdunski M. (1997) A proton-gated cation channel involved in acid-sensing. Nature 386, 173–177 - PubMed
    1. Deval E., Gasull X., Noël J., Salinas M., Baron A., Diochot S., Lingueglia E. (2010) Acid-sensing ion channels (ASICs): pharmacology and implication in pain. Pharmacol. Ther. 128, 549–558 - PubMed
    1. Noël J., Salinas M., Baron A., Diochot S., Deval E., Lingueglia E. (2010) Current perspectives on acid-sensing ion channels: new advances and therapeutic implications. Expert Rev. Clin. Pharmacol. 3, 331–346 - PubMed
    1. Sluka K. A., Winter O. C., Wemmie J. A. (2009) Acid-sensing ion channels: a new target for pain and CNS diseases. Curr. Opin. Drug Discov. Devel. 12, 693–704 - PMC - PubMed
    1. Wemmie J. A., Taugher R. J., Kreple C. J. (2013) Acid-sensing ion channels in pain and disease. Nat. Rev. Neurosci. 14, 461–471 - PMC - PubMed

Publication types

LinkOut - more resources