. 2014 May 23;289(21):14881-95.
doi: 10.1074/jbc.M114.562447. Epub 2014 Apr 2.

Runx1 regulation of Pu.1 corepressor/coactivator exchange identifies specific molecular targets for leukemia differentiation therapy

Affiliations

Runx1 regulation of Pu.1 corepressor/coactivator exchange identifies specific molecular targets for leukemia differentiation therapy

Xiaorong Gu et al. J Biol Chem. .

Abstract

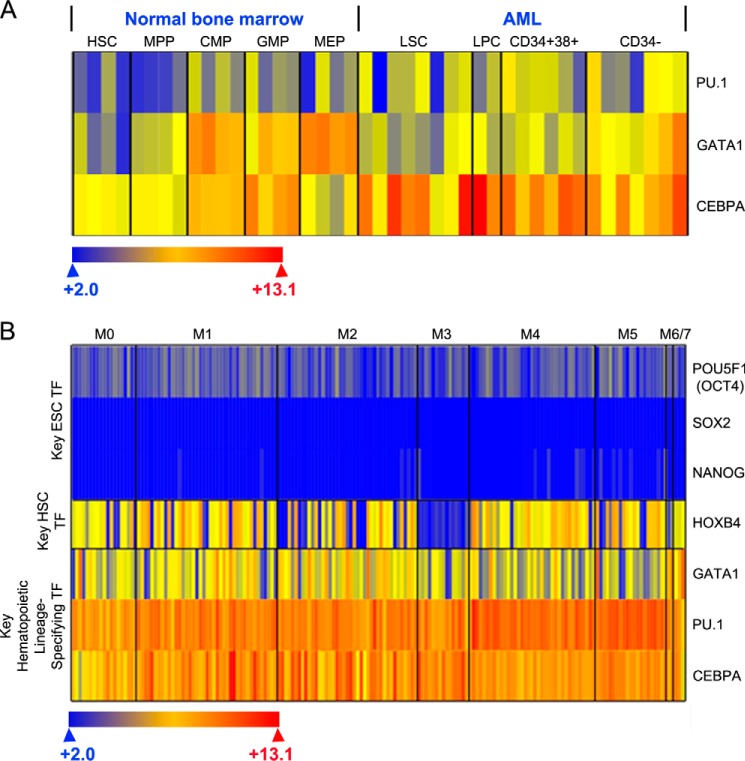
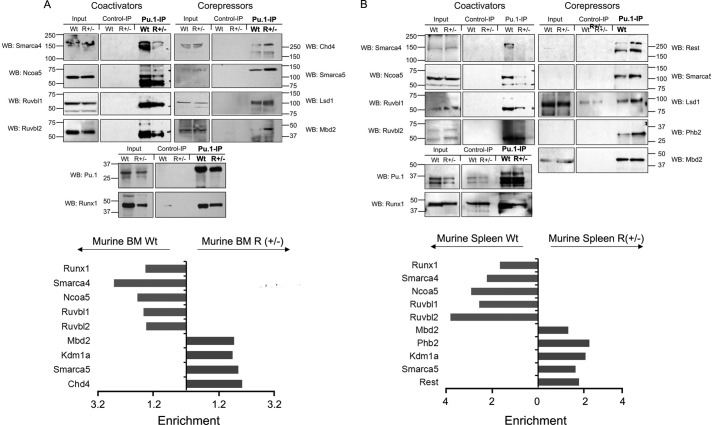
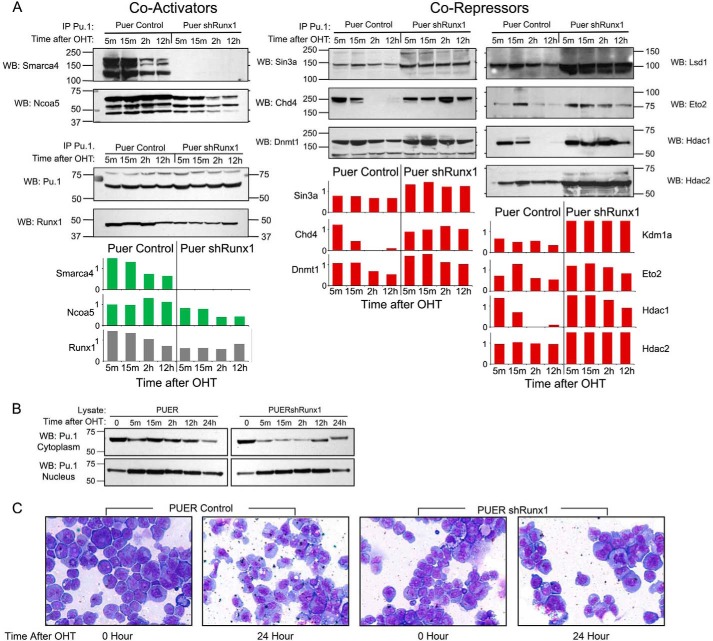
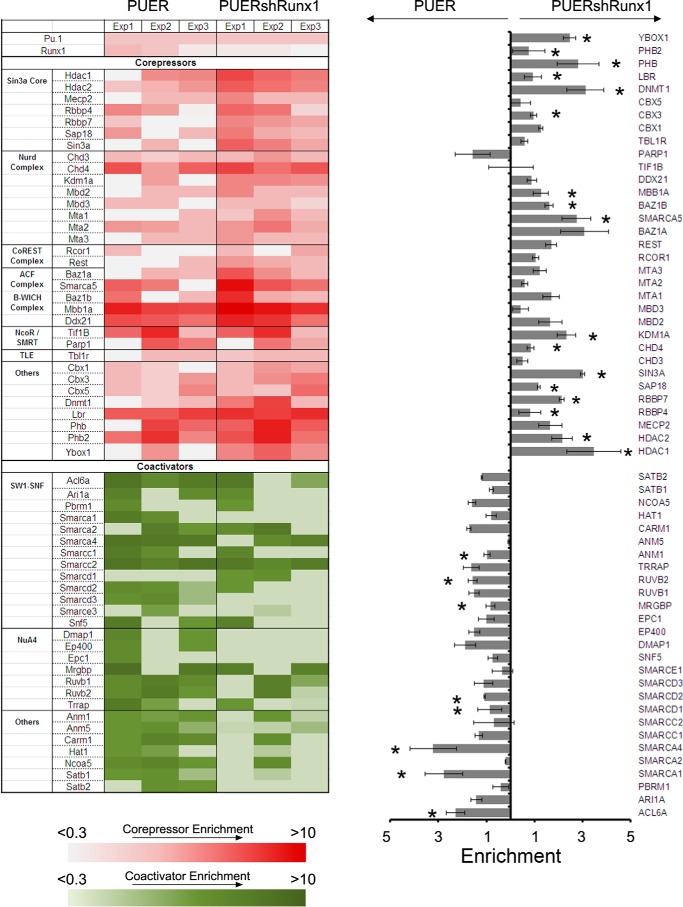
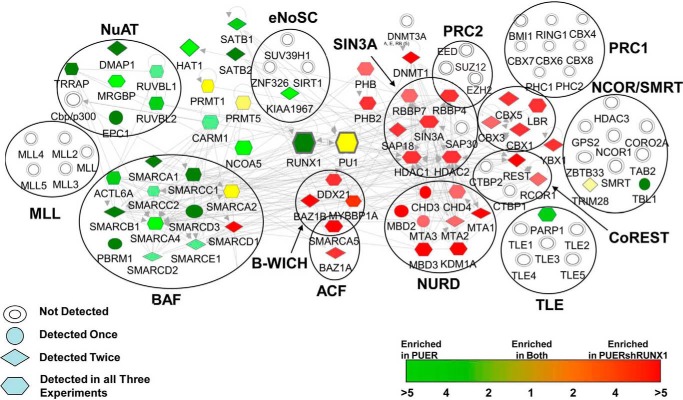
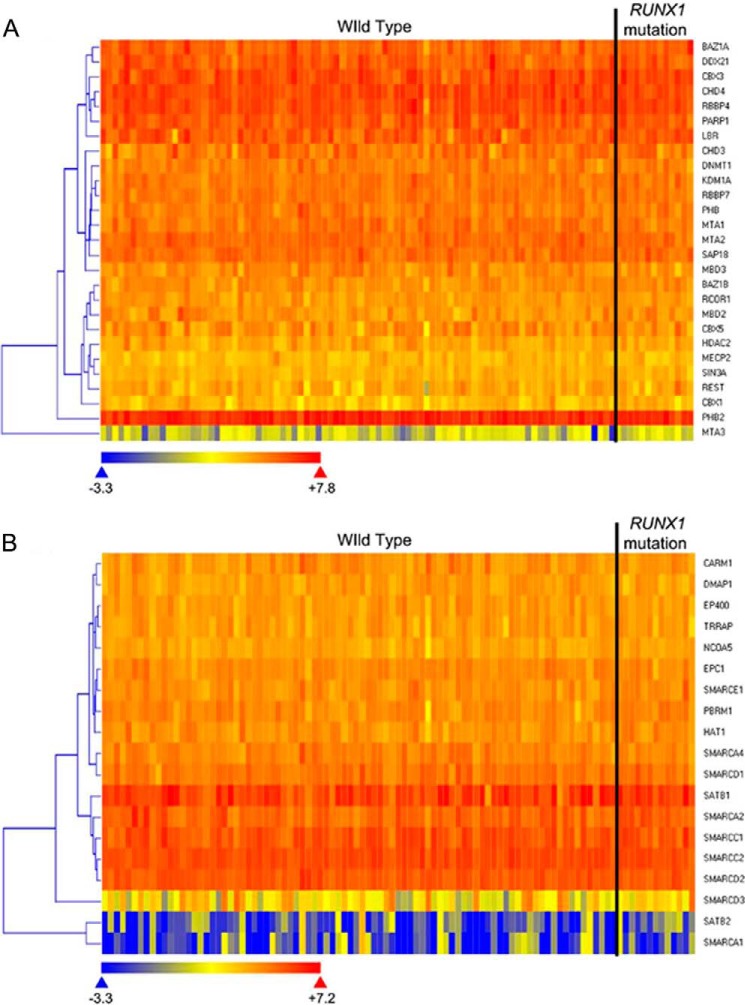
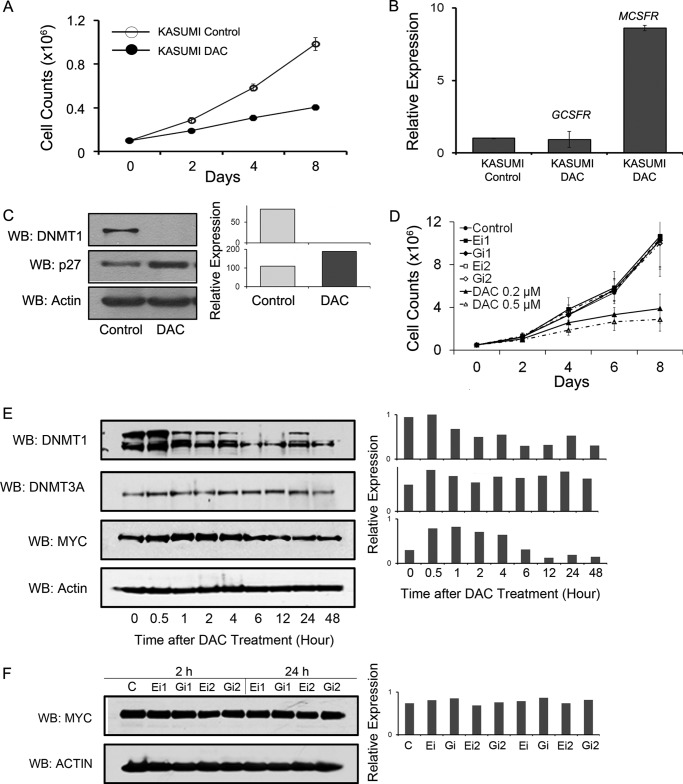
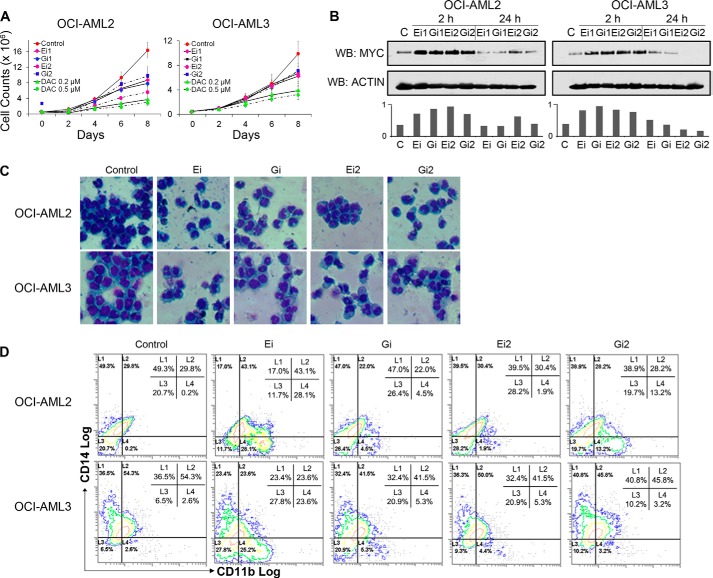
Gene activation requires cooperative assembly of multiprotein transcription factor-coregulator complexes. Disruption to cooperative assemblage could underlie repression of tumor suppressor genes in leukemia cells. Mechanisms of cooperation and its disruption were therefore examined for PU.1 and RUNX1, transcription factors that cooperate to activate hematopoietic differentiation genes. PU.1 is highly expressed in leukemia cells, whereas RUNX1 is frequently inactivated by mutation or translocation. Thus, coregulator interactions of Pu.1 were examined by immunoprecipitation coupled with tandem mass spectrometry/Western blot in wild-type and Runx1-deficient hematopoietic cells. In wild-type cells, the NuAT and Baf families of coactivators coimmunoprecipitated with Pu.1. Runx1 deficiency produced a striking switch to Pu.1 interaction with the Dnmt1, Sin3A, Nurd, CoRest, and B-Wich corepressor families. Corepressors of the Polycomb family, which are frequently inactivated by mutation or deletion in myeloid leukemia, did not interact with Pu.1. The most significant gene ontology association of Runx1-Pu.1 co-bound genes was with macrophages, therefore, functional consequences of altered corepressor/coactivator exchange were examined at Mcsfr, a key macrophage differentiation gene. In chromatin immunoprecipitation analyses, high level Pu.1 binding to the Mcsfr promoter was not decreased by Runx1 deficiency. However, the Pu.1-driven shift from histone repression to activation marks at this locus, and terminal macrophage differentiation, were substantially diminished. DNMT1 inhibition, but not Polycomb inhibition, in RUNX1-translocated leukemia cells induced terminal differentiation. Thus, RUNX1 and PU.1 cooperate to exchange corepressors for coactivators, and the specific corepressors recruited to PU.1 as a consequence of RUNX1 deficiency could be rational targets for leukemia differentiation therapy.

Keywords: Chromatin Modifying Enzymes; Enhanceosome; Enzyme Inhibitors; Epigenetics; Leukemogenesis; Protein Complexes; Protein Interactome; Transcription Coactivators; Transcription Regulation; Transcription Repressor.


Figures

FIGURE 1.
FIGURE 1.
A, primary AML cells, such as leukemia stem cells (LSC) and leukemia progenitor cells (LPC), express high levels of master differentiation-driven transcription factors CEBPA (granulocyte differentiation) and PU.1 (macrophage differentiation) compared with normal bone marrow hematopoietic stem cells (HSC), multipotent progenitors (MPP), granulocyte monocyte progenitors (GMP), and megakaryocyte erythroid progenitors (MEP). Shown for reference are expression levels also of GATA1 (master driver of erythroid differentiation). Raw data were downloaded from Geo Datasets GSE24006. Gene expression microarray data Affymetrix U133 Plus 2.0 microarrays were from cell populations purified by fluorescence-activated cell sorting: AML LSC (Lin-CD34+CD38-CD90-, n = 7), AML PC (Lin-CD34+CD38+, n = 7), AML Blasts (Lin-CD34-), normal hematopoietic stem cells (Lin-CD34+CD38-CD90+CD45RA-; n = 4), multipotent progenitors (Lin-CD34+CD38-CD90-CD45RA-; n = 4), common myeloid progenitors Lin-CD34+CD38+CD123+CD45RA-; n = 4), granulocyte-monocyte progenitors (Lin-CD34+CD38+CD123+CD45RA+; n = 4), and megakaryocyte-erthythrocyte progenitors (Lin-CD34+CD38+CD123-CD45RA-; n = 4). B, primary acute myeloid leukemia cells representative of the morphologic/genetic spectrum of disease (TCGA, n = 179) express high levels of key hematopoietic lineage specifying transcription factors (TF) (TCGA RNA Seq). For comparison purposes, expression levels of a key hematopoietic stem cell (HSC) driving TF and embryonic stem cell (ESC) TF are shown. M0, minimally differentiated; M1, without maturation; M2, with maturation; M3, promyelocytic; M4, myelomonocytic; M5, monocytic; M6, erythroid; M7, megakaryocytic.
FIGURE 2.
FIGURE 2.
Coactivators and corepressors that co-immunoprecipitated (co-IPed) with endogenous Pu.1 from wild-type and Runx1 haploinsufficient (R+/−) murine bone marrow and spleen. These results were reproduced in triplicate using independent cell harvests (different mice). A, coactivators (Smarca4, Ncoa5, Ruvbl1, and Ruvbl2) are more abundant and vice versa for corepressors (Chd4, Smarca5, Lsd1, and Mbd2) in Pu.1 co-IP from bone marrow cells from WT versus R+/− mice. 1% input from WT BM and R+/− BM, and Control IP with WT BM and R+/− BM are also shown. Bottom panels show Western analysis of IPed Pu.1 and co-IPed Runx1. Histograms are results of densitometric quantification of co-IPed bands relative to the intensity of IPed Pu.1 bands. B, similar results were observed in the Pu.1 co-IP from primary spleen cells from WT and R+/− mice (coactivators: Smarca4, Ncoa5, Ruvbl1, and Ruvbl2; corepressors: Rest, Smarca5, Lsd1, Phb2, and Mbd2). 1% input from WT spleen and R+/− spleen, and Control IP with WT spleen and R+/− spleen are also shown. Bottom panels show Western analysis of IPed Pu.1 and co-IPed Runx1. Because protein expression varied by the source of cells (bone marrow (BM) and spleen), there was some variation in the coactivator/corepressor proteins analyzed.
FIGURE 3.
FIGURE 3.
Runx1 regulation of Pu.1 corepressor/coactivator exchange is immediate and persistent during Pu.1-driven progressive maturation. Pu.1 was IPed from PUER controls (empty vector pLenti6) and PUER shRunx1 cells at various time points after Pu.1 introduction into the nucleus by OHT. The co-IP was analyzed by Western blot (WB). A, coactivator (Smarca4 and Ncoa5) and corepressor (Sin3a, Chd4, Dnmt1, Lsd1, Eto2, Hdac1, and Hdac2) abundance in the Pu.1 co-IP during progressive macrophage differentiation of PUER controls and PUER shRunx1 cells. Bottom panels show Western analysis of IPed Pu.1 and co-IPed Runx1. Histograms are results of densitometric quantification of co-IPed bands relative to the intensity of IPed Pu.1 bands. B, Pu.1 translocation from the cytoplasm into the nucleus with addition of OHT. C, morphology of PUER control and PUER shRunx1 cells before and 24 h after addition of OHT (macrophage differentiation). Giemsa-stained cytospin preparations of cells at ×200 (microscope model Leica DMR, Leica Microsystems, IL). Images were captured using the attached CRI Nuance NzMSI-FX multispectral imaging system with Nuance software version 2.8 (NuanceCRI). These results were reproduced in three independent experiments.
FIGURE 4.
FIGURE 4.
LC-MS/MS was used to comprehensively catalog and quantify coactivators and corepressors pulled down with Pu.1 from control or Runx1-deficient cells. Peak intensity based label-free comparative proteomic analysis of coactivators and corepressors pulled down with Pu.1 from control (PUER Empty Vector) and Runx1-deficient (PUER shRunx1) cells by Progenesis LC-MS software. Left panel, enrichment heat map of protein complexes clustered by functional groups. Three independent IP experiments were preformed. Coactivator/corepressor protein abundance was normalized to the bait protein (Pu.1) abundance for each immunoprecipitation (log2 scale). Right panel, statistical analyses − ratio of protein abundance in control cells versus Runx1-deficient cells, mean ± S.D. of three independent experiments; *, p < 0.05, Student's t test.
FIGURE 5.
FIGURE 5.
A summary figure of the switch from Pu.1 interaction with coactivators to corepressors caused by Runx1 deficiency. Two hours after cells were treated with tamoxifen to translocate Pu.1 into the nucleus, corepressors and coactivators co-immunoprecipitated (coIPed) with Pu.1 from PUER controls (empty vector pLenti6) and PUER shRunx1 cells were quantified by LC-MS/MS total spectra counts. For ease of interpretation, the tabular data (supplemental Tables S1–S3) are presented here in figure form as the gradient of color toward red (more enrichment in shRunx1 cells) or green (more enrichment in control cells). Clear double ring symbols are proteins that were not identified in any of the IP experiments, but which are linked to myeloid cancer pathogenesis by recurrent genetic abnormalities. The reproducibility of protein identification in three independent Pu.1 IP experiments is indicated by shapes of the protein symbols: not identified (clear double ring), identified once (circle), identified twice (diamond), and identified in all experiments (hexagon) (the figure was generated using Ingenuity Pathway Analysis).
FIGURE 6.
FIGURE 6.
High expression in primary AML cells with and without RUNX1 mutation of the corepressors and coactivators that were noted to interact with Pu.1. Gene expression measured by RNA sequencing (TCGA, normal cytogenetics AML, Runx1 wild-type n = 85, Runx1 mutated n = 14). Heat map using ArrayStar software. A, expression levels of corepressors recruited to Pu.1. Corepressors were hierarchically clustered (brackets on left) according to similar patterns of expression. B, expression levels of coactivators recruited to Pu.1.
FIGURE 7.
FIGURE 7.
Runx1 deficiency does not decrease Pu.1 binding to the Mcsfr promoter, but impairs the Pu.1-driven shift from histone repression to histone activation marks at this locus. For comparison, a key granulocyte differentiation gene, Gcsfr, was also analyzed. A, Runx1 deficiency severely decreased Runx1 binding but did not decrease Pu.1 binding to the Mcsfr promoter. Chromatin immunoprecipitation (IP) with anti-Pu.1 and anti-Runx1 was 12 h after addition of OHT to trigger Pu.1 nuclear entry into PUER Empty Vector (control) and PUER shRunx1 (Runx-deficient) cells. Co-immunoprecipitated promoter regions were quantified by RT-qPCR, presented as fold-enrichment relative to control rabbit IgG. Mean ± S.D., **, p < 0.01, Student's t test. Experiments were performed in triplicate. B, in Runx1-deficient cells, the histone activation mark H3K4Me2 was decreased at Mcsfr and Gcsfr promoters at various time points before and after Pu.1 introduction into the nucleus compared with control cells. Chromatin immunoprecipitation was with anti-H3K4Me2. Analysis as indicated in panel A. C, in contrast, the histone repression mark H3K9Me2 was increased in Runx1-deficient cells. Chromatin immunoprecipitation was with anti-H3K9Me2. Analysis as indicated in panel A.
FIGURE 8.
FIGURE 8.
DNMT1 inhibition, but not Polycomb inhibition, in RUNX1-translocated (RUNX1-ETO) leukemia cell Kasumi1-induced terminal differentiation. A, DNMT1 inhibition decreased RUNX1-ETO leukemia cell proliferation. Non-cytotoxic concentrations of the DNMT1 inhibitor decitabine (DAC) were used (0.5 μm on day 1 and 0.2 μm on day 2). Cell counts were by an automated counter. B, DNMT1 inhibition activated MCSFR. RT-qPCR, relative expression with GAPDH was used as an internal standard. C, p27/CDKN1B that mediates the cell cycle exit by differentiation was up-regulated. The histogram shows results of densitometric analysis relative to actin. D, specific inhibitors of EZH2 (Ei and Ei2, 5 μm daily) and G9a (Gi and Gi2, 5 μm daily), which were not aberrantly recruited to Pu.1, did not decrease RUNX1-ETO leukemia cell proliferation. Highly specific inhibitors were obtained from SGC. Data points = mean ± S.D., of three independent experiments. E, the DNMT1 inhibitor decreased MYC protein. Time course Western blots (WB) and densitometry histogram (normalized to actin). DNMT1, but not DNMT3A, was inhibited. F, the EZH2 and G9a inhibitors did not decrease MYC. Time course Western blots and a densitometry graph (normalized to actin) were used.
FIGURE 9.
FIGURE 9.
Polycomb (EZH2 and G9a) inhibition increased differentiation and decreased proliferation of leukemia cells with wild-type RUNX1. Patient-derived leukemia cell lines OCI-AML2 that contains DNMT3A, MLL, and FLT3 mutations, and OCI-AML3 that contains DNMT3A, NPM1, and NRAS mutations, were treated with specific EZH2 (Ei and Ei2) and G9a (Gi, Gi2) inhibitors from SGC (5 μm added daily). A, polycomb inhibitors decreased proliferation. Cell counts were by an automated counter. DAC, DNMT1 inhibitor decitabine. B, polycomb inhibitors decreased MYC protein. Time course Western blots (WB) and densitometry graph (normalized to actin) were used. The DNMT1 inhibitor DAC also decreased MYC protein (data not shown). C, polycomb inhibitors induced morphologic differentiation (decreased nuclear/cytoplasmic ratio, nuclear margination, and segmentation). Giemsa-stained cytospin preparations on day 5 (×200, Leica DMR, Leica Microsystems). Images were captured by a CRI Nuance NzMSI-FX multispectral imaging system with Nuance software version 3.0 (NuanceCRI). DAC also induced morphologic differentiation (data not shown). D, polycomb inhibitors increased expression of myeloid differentiation markers CD11b and/or CD14. Measurements were done by flow cytometry on day 7.

References

    1. Rosenfeld M. G., Lunyak V. V., Glass C. K. (2006) Sensors and signals: a coactivator/corepressor/epigenetic code for integrating signal-dependent programs of transcriptional response. Genes Dev. 20, 1405–1428 - PubMed
    1. Perissi V., Jepsen K., Glass C. K., Rosenfeld M. G. (2010) Deconstructing repression: evolving models of co-repressor action. Nat. Rev. Genet. 11, 109–123 - PubMed
    1. Wang Z., Zang C., Cui K., Schones D. E., Barski A., Peng W., Zhao K. (2009) Genome-wide mapping of HATs and HDACs reveals distinct functions in active and inactive genes. Cell 138, 1019–1031 - PMC - PubMed
    1. Ram O., Goren A., Amit I., Shoresh N., Yosef N., Ernst J., Kellis M., Gymrek M., Issner R., Coyne M., Durham T., Zhang X., Donaghey J., Epstein C. B., Regev A., Bernstein B. E. (2011) Combinatorial patterning of chromatin regulators uncovered by genome-wide location analysis in human cells. Cell 147, 1628–1639 - PMC - PubMed
    1. Niimi H., Harada H., Harada Y., Ding Y., Imagawa J., Inaba T., Kyo T., Kimura A. (2006) Hyperactivation of the RAS signaling pathway in myelodysplastic syndrome with AML1/RUNX1 point mutations. Leukemia 20, 635–644 - PubMed

Publication types

MeSH terms

Substances