. 2014 May 15;123(20):e110-22.
doi: 10.1182/blood-2013-08-520619. Epub 2014 Apr 2.

Alternatively activated macrophages derived from monocytes and tissue macrophages are phenotypically and functionally distinct

Affiliations

Alternatively activated macrophages derived from monocytes and tissue macrophages are phenotypically and functionally distinct

Uma Mahesh Gundra et al. Blood. .

Abstract

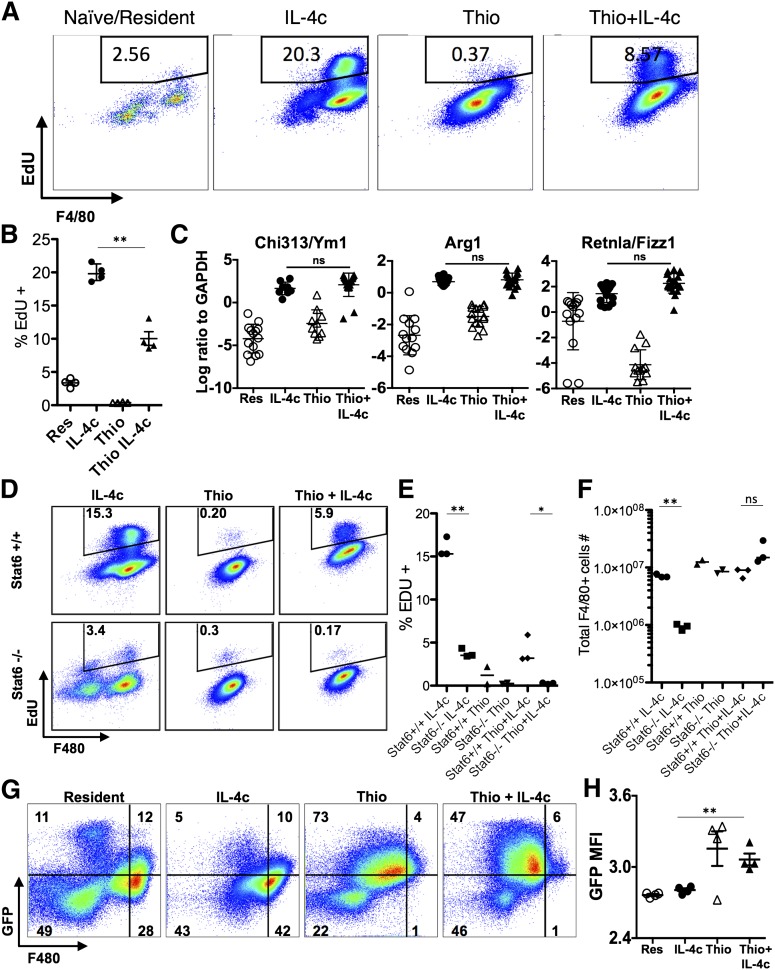
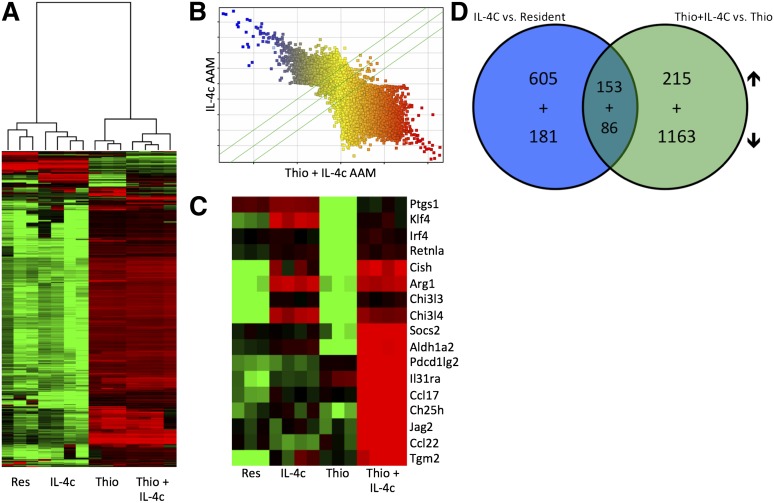
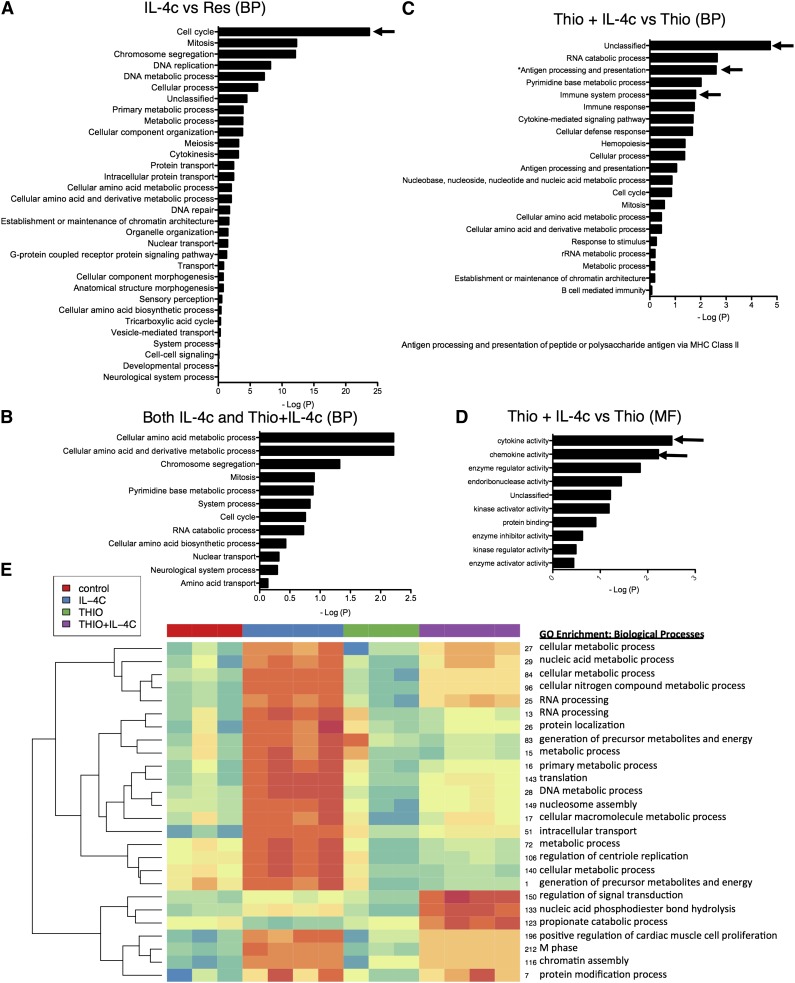
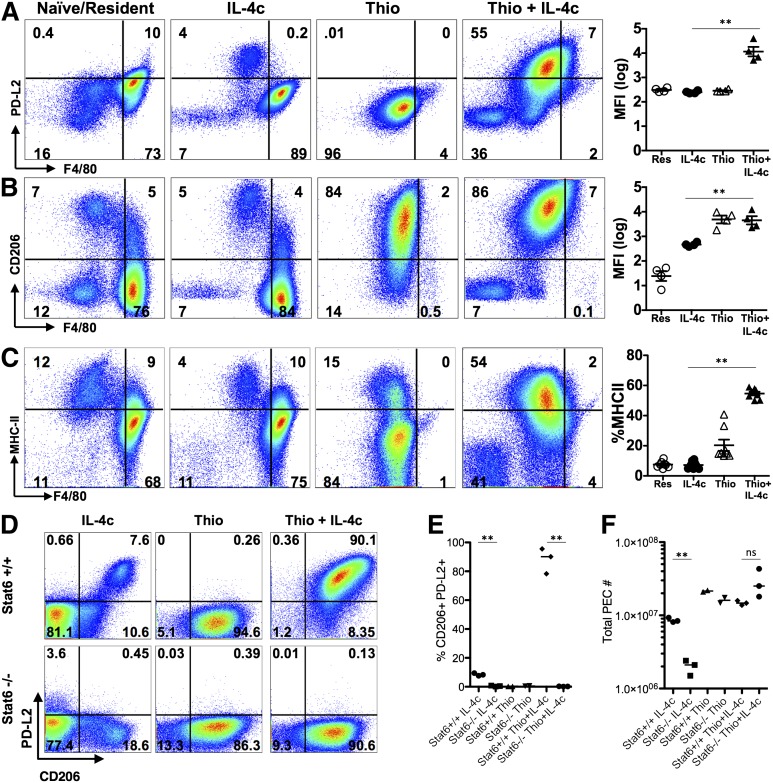
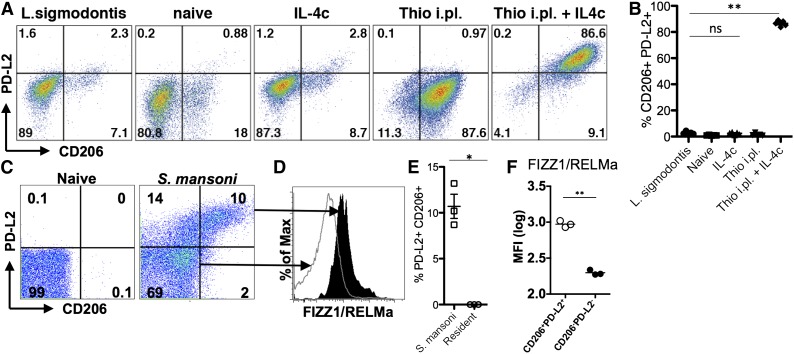
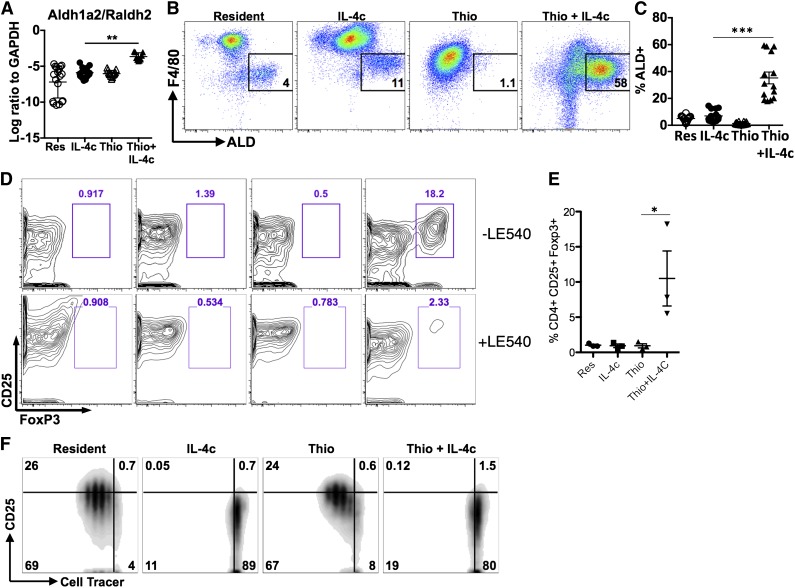
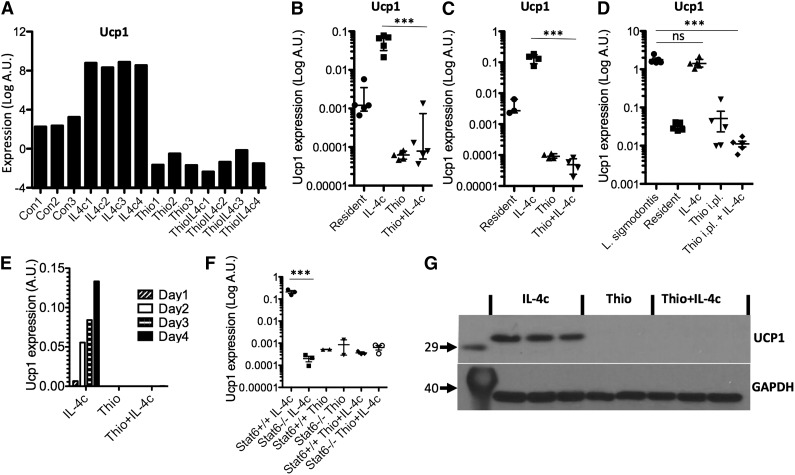
Macrophages adopt an alternatively activated phenotype (AAMs) when activated by the interleukin-4receptor(R)α. AAMs can be derived either from proliferation of tissue resident macrophages or recruited inflammatory monocytes, but it is not known whether these different sources generate AAMs that are phenotypically and functionally distinct. By transcriptional profiling analysis, we show here that, although both monocyte and tissue-derived AAMs expressed high levels of Arg1, Chi3l3, and Retnla, only monocyte-derived AAMs up-regulated Raldh2 and PD-L2. Monocyte-derived AAMs were also CX3CR1-green fluorescent protein (GFP)(high) and expressed CD206, whereas tissue-derived AAMs were CX3CR1-GFP and CD206 negative. Monocyte-derived AAMs had high levels of aldehyde dehydrogenase activity and promoted the differentiation of FoxP3(+) cells from naïve CD4(+) cells via production of retinoic acid. In contrast, tissue-derived AAMs expressed high levels of uncoupling protein 1. Hence monocyte-derived AAM have properties associated with immune regulation, and the different physiological properties associated with AAM function may depend on the distinct lineage of these cells.


Figures

Figure 1
Figure 1
IL-4c and Thio+IL-4c induces alternatively activated macrophages with distinct phenotypes. Mice were untreated (naïve/resident) or injected i.p. with IL-4c alone (IL-4c) or thioglycollate alone (Thio) or Thio and IL-4c (Thio+IL-4c) on day 0 and then with IL-4c again (for IL-4c and Thio+IL-4c) on day 2, and PEC was analyzed on day 4. (A) Representative FACS plots shows EdU incorporation by peritoneal macrophages after treatment. EdU was injected 3 hours before analysis. (B) Quantification of EdU incorporation in macrophages. Results are representative of 3 independent experiments. (C) RNA of peritoneal macrophages was isolated for RT-PCR analysis for expression of Chi3l3, Arg1, Retnla, and Raldh2 and normalized to expression of GAPDH. Graphs depict mean ± standard error of the mean of individual mice pooled from 5 to 6 independent experiments. (D) EdU incorporation by peritoneal macrophages after injection of wild-type Stat6+/+ mice or Stat6−/− mice with IL-4c alone, Thio, or Thio+IL-4c. (E) Quantification of EdU incorporation in macrophages. (F) Total number of F4/80+ macrophages recovered. Results shown are representative of 2 separate experiments. (G) Representative FACS plots gated on CD11b+ cells for CX3CR1GFP/+ reporter mice treated as above. (H) The median fluorescent intensity (MFI) of GFP, gated on CD11b+ cells from the peritoneal cavity of individual mice. Data are representative of 3 independent experiments. *P < .05 and **P < .01 as determined by ANOVA.
Figure 2
Figure 2
Gene expression profiling of monocyte-derived and tissue macrophage-derived AAMs. (A) Unsupervised hierarchical clustering of transcriptional profiles, displayed as a heat map of log-transformed expression values, from FACS-purified (CD11b+F4/80+) macrophages of mice untreated (Res) or treated with IL-4c alone (IL-4c) or thioglycollate alone (Thio) or Thio and IL-4c (Thio+IL-4c). (B) Comparison of probe expression for AAMs induced by IL-4c alone or Thio+IL-4c, indicating that most genes are differentially expressed. (C) Heat map of log-transformed expression values for a subset of genes associated with AAMs. (D) Venn diagrams showing the overlap of genes up-regulated and down-regulated by IL-4 in monocyte-derived (Thio+IL-4c vs Thio) compared with tissue-derived AAMs (IL-4c vs resident). List of genes are shown in Tables 1 to 8.
Figure 3
Figure 3
GO analysis of transcriptional profiles from monocyte-derived and tissue resident macrophage-derived AAMs. (A) Biological processes (BPs) induced in IL-4c expanded AAM (IL-4c) relative to resident macrophages (Res). x-axis indicates the amount of statistical significance [as −log(P)] in enrichment for the indicated biological process. Arrows depict pathways of interests mentioned in the text. (B) BPs induced in Thio+IL-4c-induced AAMs relative to Thio-induced macrophages. (C) BPs induced in both monocyte- and tissue-derived AAMs. (D) Molecular function (MF) pathways induced in Thio+IL-4c-induced AAMs relative to Thio-induced macrophages. (E) Hierarchical clustering analysis of 26 unsupervised k-means clusters of genes that have similar expression profiles. The averaged expression for all the genes in each cluster is shown as a single row. The biological significance of each cluster was determined by measuring the GO term enrichment for BPs. Results shown are for individual mice.
Figure 4
Figure 4
AAMs derived from inflammatory monocytes express PD-L2, CD206, and MHC class II, but not tissue macrophage-derived AAMs. FACS analysis of (A) PD-L2, (B) CD206 and (C) MHC class II from peritoneal macrophages of mice untreated (naïve/resident) or injected i.p. with IL-4c alone (IL-4c) or thioglycollate alone (Thio) or Thio and IL-4c (Thio+IL-4c). Graphs depict the geometric median fluorescent intensity (MFI) of PD-L2 and CD206 and percentage of MHC class II, gated on CD11b+ cells from the peritoneal cavity of individual mice. Data are representative of 3 independent experiments. (D) Stat6 is required for regulating PD-L2 but not CD206 expression in monocyte-derived AAMs. (E) Quantitation of CD11b+ cells that are CD206+PD-L2+ from the peritoneal cavity of individual mice and (F) the total number of peritoneal cavity cells recovered from treated animals. Results shown are representative of 2 independent experiments. *P < .05 and **P < .01 as determined by ANOVA.
Figure 5
Figure 5
Different helminth infections induce either monocyte-derived or tissue-derived AAMs. (A) Representative FACs plots of pleural cavity macrophages on day 12 after L sigmodontis infection compared with pleural cavity macrophages of mice untreated (Res) or injected i.p. with thioglycollate alone (Thio) or Thio and IL-4c (Thio+IL-4c) or IL-4c alone (IL-4c). (B) Graphs depict proportion of CD206 and PD-L2 positive pleural cavity macrophages. (C) Representative FACs plots of PD-L2 and CD206 expression gated on CD11b+ cells isolated from the liver of S mansoni-infected mice (8 weeks after infection) compared with CD11b+ cells isolated from the liver of mice untreated (naïve) mice. (D) FIZZ1/RELMa intracellular staining on PD-L2+CD206+ macrophages from S mansoni-infected livers compared with PD-L2CD206 macrophages. (E) Graph depicts the percentage of PD-L2 and CD206 double positive cells, gated on CD11b+ cells, from the livers of individual mice. (F) MFI of FIZZ1/RELMa staining on PD-L2+CD206+ and PD-L2CD206 macrophages from livers of individual infected mice. *P < .05 and **P < .01 as determined by ANOVA. Results shown representative of 2 independent experiments.
Figure 6
Figure 6
Differential effects of monocyte- and tissue macrophage-derived AAMs on naïve CD4+ T cells. (A) RT-PCR analysis of Aldh1a2/Raldh2 expression in peritoneal macrophages normalized to expression of GAPDH. Graphs depict mean ± standard error of the mean of individual mice pooled from 5 to 6 independent experiments. (B) FACS analysis of Aldh activity gated on CD11b+ cells from the peritoneal cavity. Peritoneal cells were stained with aldefluor to detect Aldh activity for 2 hours prior to staining with cell surface antibodies antibodies. (C) Graph depicts the proportion of CD11b+ cells that are ALD+ from individual mice. Results are pooled from 4 independent experiments. (D) Flow cytometry contour plots showing the percentage of CD25+, Foxp3+CD4+ T cells after 6 days of coculture with peritoneal macrophages either with or without the RA inhibitor LE540 (1 µM). (E) Quantitation of the percentage of CD25+, Foxp3+ cells from the CD4+ compartment after coculture. Data are shown from 3 independent experiments. (F) Inhibition of CD4+ T-cell proliferation by IL-4c- and Thio+IL-4c-induced AAMs. FACS analysis of activated (anti-CD3+IL-2) Cell tracer-labeled naïve CD4+ cells cultured with peritoneal macrophages (ratio of 2:1) after 3 days of coculture. Results are representative of 3 independent experiments.
Figure 7
Figure 7
Ucp1 is a unique marker for tissue resident macrophage-derived AAMs. (A) Microarray data for Ucp1 from AAMs. (B) Real-time PCR measurement of Ucp1 expression (relative to GAPDH) in peritoneal macrophages isolated by adherence. (C) RT-PCR measurement of Ucp1 expression in FACS sorted (CD11b+F4/80+) macrophages. (D) RT-PCR measurement of Ucp1 expression in pleural cavity macrophages on day 12 after L sigmodontis infection. (E) Time course analysis of Ucp1 expression after injection with IL-4c. (F) RT-PCR analysis of Ucp1 expression in peritoneal macrophages of treated Stat6-deficient animals. (G) Western blot analysis of Ucp1 protein from total peritoneal cells of individual mice treated with Thio, Thio+IL-4c, and IL-4c, with GAPDH as a loading control.

References

    1. Schulz C, Gomez Perdiguero E, Chorro L, et al. A lineage of myeloid cells independent of Myb and hematopoietic stem cells. Science. 2012;336(6077):86–90. - PubMed
    1. Yona S, Kim KW, Wolf Y, et al. Fate mapping reveals origins and dynamics of monocytes and tissue macrophages under homeostasis. Immunity. 2013;38(1):79–91. - PMC - PubMed
    1. Hashimoto D, Chow A, Noizat C, et al. Tissue-resident macrophages self-maintain locally throughout adult life with minimal contribution from circulating monocytes. Immunity. 2013;38(4):792–804. - PMC - PubMed
    1. Hoeffel G, Wang Y, Greter M, et al. Adult Langerhans cells derive predominantly from embryonic fetal liver monocytes with a minor contribution of yolk sac-derived macrophages. J Exp Med. 2012;209(6):1167–1181. - PMC - PubMed
    1. Sieweke MH, Allen JE. Beyond stem cells: self-renewal of differentiated macrophages. Science. 2013;342(6161):1242974. - PubMed

Publication types

MeSH terms