. 2014 Jun;88(12):6611-22.
doi: 10.1128/JVI.03736-13. Epub 2014 Apr 2.

The stress granule component TIA-1 binds tick-borne encephalitis virus RNA and is recruited to perinuclear sites of viral replication to inhibit viral translation

Affiliations

The stress granule component TIA-1 binds tick-borne encephalitis virus RNA and is recruited to perinuclear sites of viral replication to inhibit viral translation

Amelina Albornoz et al. J Virol. 2014 Jun.

Abstract

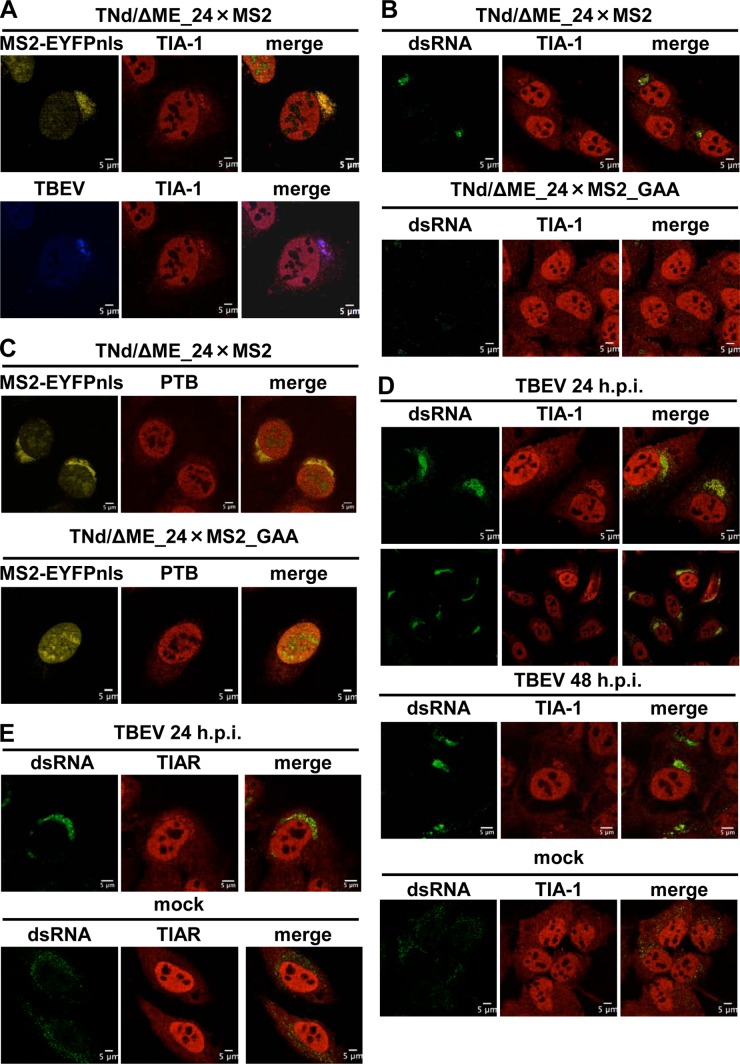
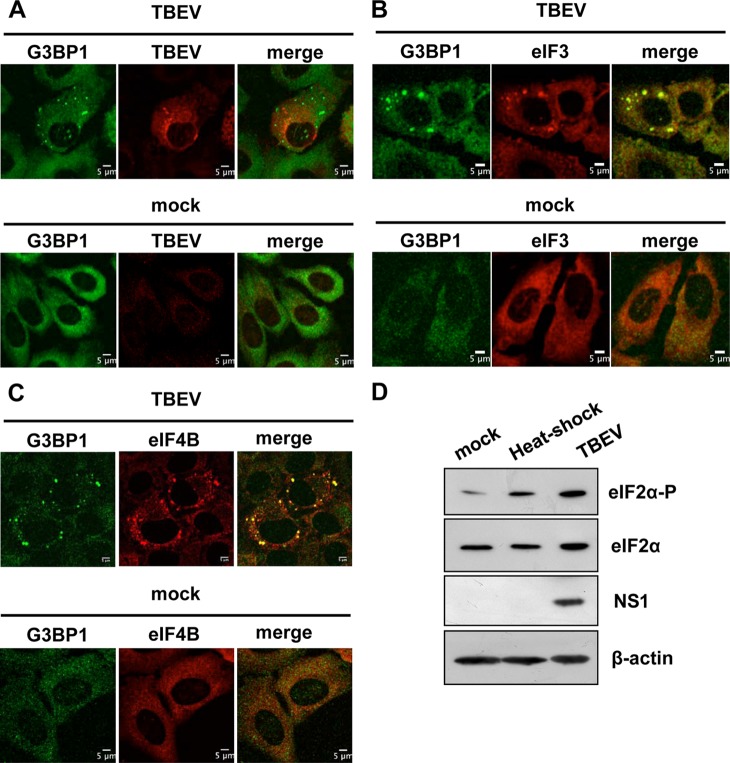
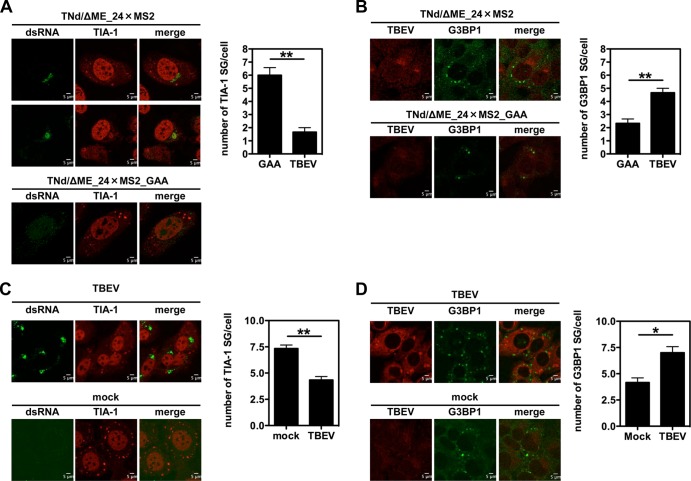
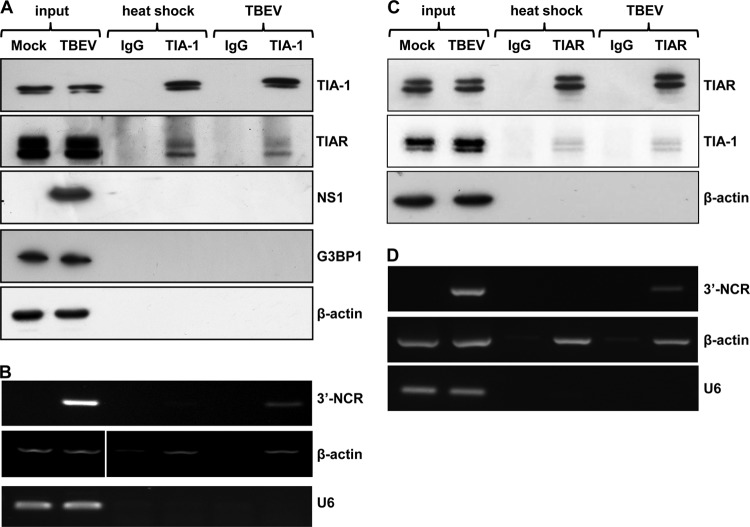
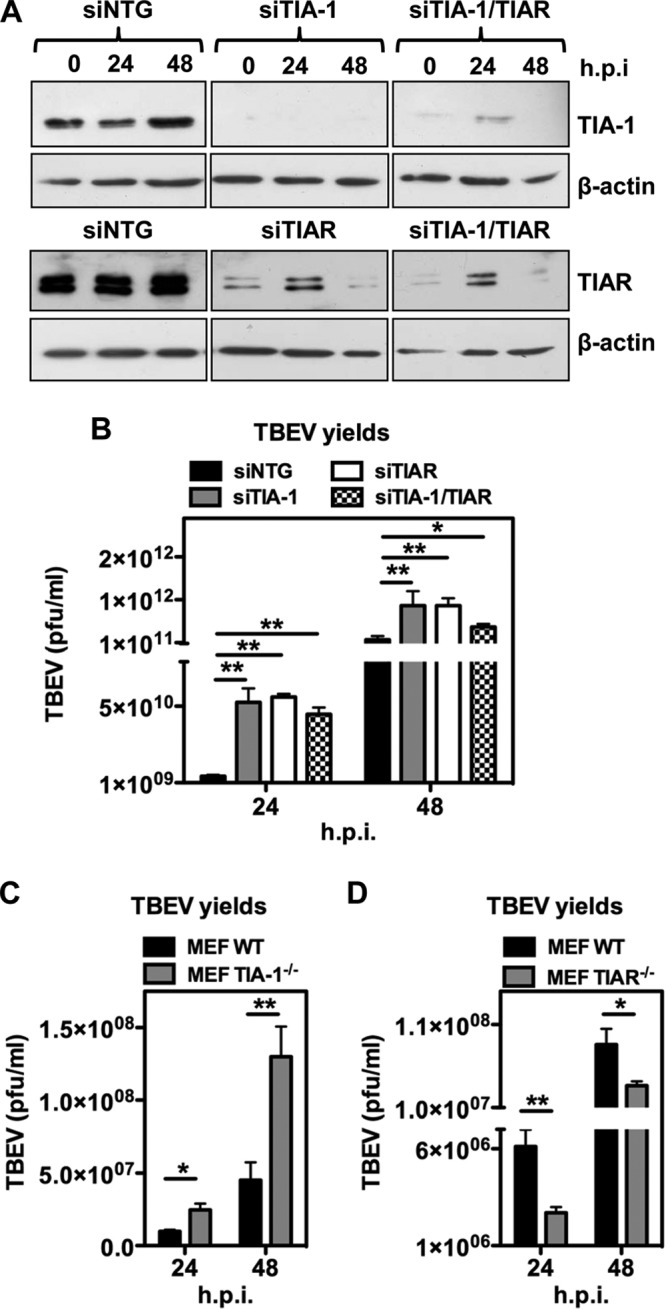
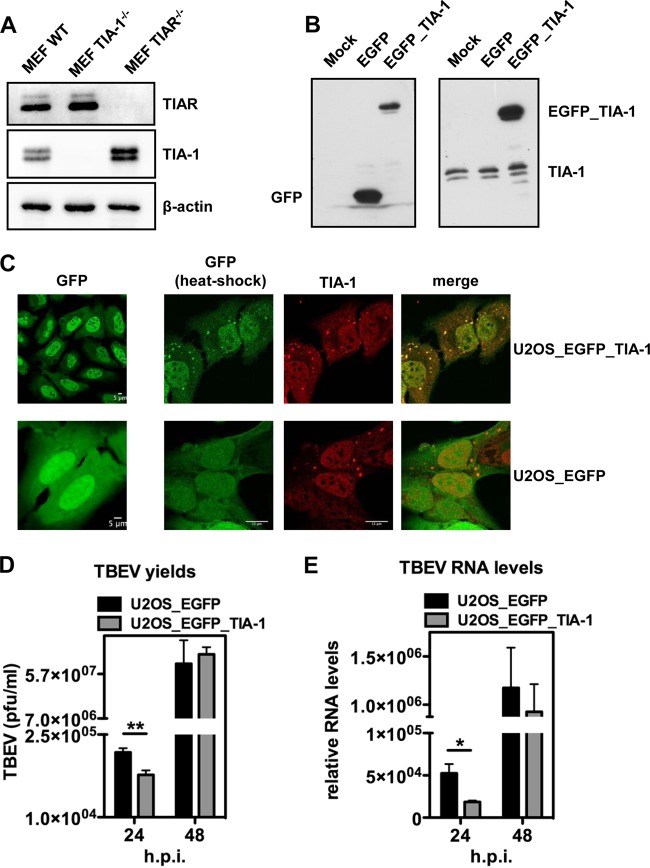
Flaviviruses are a major cause of disease in humans and animals worldwide. Tick-borne encephalitis virus (TBEV) is the most important arthropod-borne flavivirus endemic in Europe and is the etiological agent of tick-borne encephalitis, a potentially fatal infection of the central nervous system. However, the contributions of host proteins during TBEV infection are poorly understood. In this work, we investigate the cellular protein TIA-1 and its cognate factor TIAR, which are stress-induced RNA-binding proteins involved in the repression of initiation of translation of cellular mRNAs and in the formation of stress granules. We show that TIA-1 and TIAR interact with viral RNA in TBEV-infected cells. During TBEV infection, cytoplasmic TIA-1 and TIAR are recruited at sites of viral replication with concomitant depletion from stress granules. This effect is specific, since G3BP1, another component of these cytoplasmic structures, remains localized to stress granules. Moreover, heat shock induction of stress granules containing TIA-1, but not G3BP1, is inhibited in TBEV-infected cells. Infection of cells depleted of TIA-1 or TIAR by small interfering RNA (siRNA) or TIA-1(-/-) mouse fibroblasts, leads to a significant increase in TBEV extracellular infectivity. Interestingly, TIAR(-/-) fibroblasts show the opposite effect on TBEV infection, and this phenotype appears to be related to an excess of TIA-1 in these cells. Taking advantage of a TBE-luciferase replicon system, we also observed increased luciferase activity in TIA-1(-/-) mouse fibroblasts at early time points, consistent with TIA-1-mediated inhibition at the level of the first round of viral translation. These results indicate that, in response to TBEV infection, TIA-1 is recruited to sites of virus replication to bind TBEV RNA and modulate viral translation independently of stress granule (SG) formation.

Importance: This study (i) extends previous work that showed TIA-1/TIAR recruitment at sites of flavivirus replication, (ii) demonstrates that TIAR behaves like TIA-1 as an inhibitor of viral replication using an RNA interference (RNAi) approach in human cells that contradicts the previous hypothesis based on mouse embryonic fibroblast (MEF) knockouts only, (iii) demonstrates that tick-borne encephalitis virus (TBEV) is capable of inducing bona fide G3BP1/eIF3/eIF4B-positive stress granules, (iv) demonstrates a differential phenotype of stress response proteins following viral infection, and (v) implicates TIA-1 in viral translation and as a modulator of TBEV replication.


Figures

FIG 1
FIG 1
Localization of TIA-1 and TIAR in TBEV-infected cells. (A) U2OS-MS2-YFPnls cells were electroporated with the TNd/ΔME_24×MS2 replicon RNA. At 24 h p.e., the cells were fixed and incubated with anti-TBEV antiserum (Alexa Fluor 624; blue) and with the anti-TIA-1 antibody (TIA-1) (Alexa Fluor 594; red). Colocalization of replicated RNA (MS2-EYFPnls) (yellow) with TIA-1 (top row) or of TBEV proteins with TIA-1 (bottom row) is shown. (B) U2OS-MS2-YFPnls cells were electroporated with the TNd/ΔME_24×MS2 replicon RNA (top row) or with the nonreplicating control TNd/ΔME_24×MS2_GAA (bottom row). At 24 h p.e., the cells were fixed and incubated with the J2 anti-dsRNA antibody (dsRNA) (Alexa Fluor 488; green) and with the anti-TIA-1 antibody (TIA-1) (Alexa Fluor 594; red). Colocalization of dsRNA with TIA-1 in cells electroporated with a replicating TBEV replicon (top row), but not in cells electroporated with a nonreplicating RNA (bottom row), is shown. (C) U2OS-MS2-YFPnls cells were electroporated as for panel B, and 24 h p.e., the cells were fixed and incubated with the monoclonal anti-PTB antibody (PTB) (Alexa Fluor 594; red). Lack of colocalization of replicated RNA (MS2-EYFPnls) (yellow) with PTB is shown (merge). (D) U2OS cells were either infected with TBEV at an MOI of 2 for 24 h (TBEV 24 h p.i.) or 48 h (TBEV 48 h p.i.) or mock infected (mock). The cells were fixed and incubated with the J2 anti-dsRNA antibody (dsRNA) (Alexa Fluor 488; green) and with the anti-TIA-1 antibody (TIA-1) (Alexa Fluor 594; red). Colocalization of dsRNA with TIA-1 in cells infected with TBEV (top and middle), but not in mock-infected cells (bottom), is shown. An additional image at 24 h p.i. was taken at low magnification to show more cells. (E) U2OS cells were infected for 24 h and treated as for panel C except that the anti-TIAR antibody (TIAR) (Alexa Fluor 594; red) was used.
FIG 2
FIG 2
Formation of stress granules in TBEV-infected cells. (A) U2OS cells were either infected with TBEV at an MOI of 2 (TBEV) (top row) or mock infected (mock) (bottom row). At 24 h p.i., the cells were fixed and incubated with the monoclonal anti-G3BP1 antibody (G3BP1) (Alexa Fluor 488; green) and with the anti-TBEV antiserum (TBEV) (Alexa Fluor 594; red). Formation of G3BP1 SG in TBEV-infected cells (top row), but not in mock-infected cells (bottom row), is shown. (B) U2OS cells were infected as for panel A. At 24 h p.i., the cells were fixed and incubated with the monoclonal anti-G3BP1 antibody (G3BP1) (Alexa Fluor 488; green) and with the polyclonal anti-eIF3 antibody (eIF3) (Alexa Fluor 594; red). Formation of G3BP1 SG in TBEV-infected cells colocalizing with eIF3 (top row), but not in mock-infected cells (bottom row), is shown. (C) U2OS cells were infected as for panel A. At 24 h p.i., the cells were fixed and incubated with the monoclonal anti-G3BP1 antibody (G3BP1) (Alexa Fluor 488; green) and with the polyclonal anti-eIF4B antibody (eIF4B) (Alexa Fluor 594; red). Formation of G3BP1 SG in TBEV-infected cells colocalizing with eIF4B (top row), but not in mock-infected cells (bottom row), is shown. (D) U2OS cells were either infected with TBEV at an MOI of 2 (TBEV) or heat shocked for 40 min at 45°C (heat-shock). The cell lysates were immunoblotted for total eIF2α and phosphorylated eIF2α (top rows). Loading control (β-actin) and infection control (NS1) are also shown.
FIG 3
FIG 3
Induction of SG by heat shock following TBEV infection. (A) U2OS cells were electroporated with the TNd/ΔME_24×MS2 replicon RNA (TBEV) or with the nonreplicating control TNd/ΔME_24×MS2_GAA (GAA). At 24 h p.e., the cells were exposed to heat shock and then fixed and stained for TIA-1 and dsRNA. In cells electroporated with the replication-competent RNA, the number of SG per infected cell (stained with dsRNA) was determined, while the number of SG in cells transfected with the control replicon was determined per cell. A total of 100 cells per condition were counted in triplicate. Average values are shown, with standard deviations and P values, measured as described in the text. (B) U2OS cells were treated exactly as described for panel A except that they were stained for G3BP1. (C) U2OS cells were either infected with TBEV (TBEV) (MOI = 2) or mock infected (mock). At 24 h p.i., the cells were exposed to heat shock and then fixed and stained for TIA-1 and dsRNA. In TBEV-infected cells, the number of SG per infected cell (stained with dsRNA) was determined, while the number of SG in mock-infected cells was determined per cell. Counts were performed and represented as for panel A. (D) U2OS cells were infected exactly as described for panel C except that they were stained for G3BP1. *, P < 0.05 (significant); **, P < 0.01 (highly significant).
FIG 4
FIG 4
RNA immunoprecipitation of TIA-1 and TIAR in TBEV-infected cells. (A) U2OS cells were either infected with TBEV or heat shocked. At 24 h p.i. or after 40 min of heat shock, the cells were immunoprecipitated with the TIA-1 antibody. Immunoblotting shows specific TIA-1 IP compared to an irrelevant immunoglobulin (IgG). TIAR was coimmunoprecipitated with TIA-1 following both heat shock and TBEV infection, while TBEV NS1, G3BP1, and control β-actin were not. (B) U2OS cells treated as described for panel A were subjected to total-RNA extraction and RT-PCR with primers specific for the 3′ noncoding region of TBEV (3′-NCR), for β-actin as a positive control for TIA-1 RNA IP, and for the negative-control U6 snRNA. (C) U2OS cells were either infected with TBEV or heat shocked. At 24 h p.i. or after 40 min of heat shock, the cells were immunoprecipitated with the TIAR antibody. Immunoblotting shows specific TIAR IP compared to an irrelevant immunoglobulin (IgG). TIA-1 was coimmunoprecipitated with TIAR following both heat shock and TBEV infection, while control β-actin was not. (D) U2OS cells treated as described for panel C were subjected to total-RNA extraction and RT-PCR with primers specific for the 3′ noncoding region of TBEV (3′-NCR), for β-actin as a positive control for TIAR RNA IP, and for the negative-control U6 snRNA.
FIG 5
FIG 5
Functional analysis of TIA-1/TIAR depletion in TBEV-infected cells. (A) U2OS cells were transfected with siNTG, with TIA-1/TIAR-specific siRNA (siTIA-1), or with a combination of both. After 48 h, the cells were infected with TBEV (MOI = 2) and harvested for immunoblotting at 24 and 48 h p.i. β-Actin was the loading control. (B) Supernatants from infected cells treated as for panel A were used to infect Vero cells to measure virus yields (PFU/ml) from siTIA-1, siTIAR, siTIA-1/TIAR, or siNTG samples. Average values of triplicate independent experiments (n = 3) are shown, with standard deviations and P values, as described in the text. (C) MEF TIA-1−/− or their control (MEF WT) were infected with TBEV at an MOI of 2. Cell supernatant collected 24 and 48 h p.i. was used to infect Vero cells to measure virus yields (PFU/ml) from infected MEF TIA-1−/− or infected MEF WT samples. Values were plotted as for panel B (n = 6). (D) MEF TIAR−/− or their control (MEF WT) were infected with TBEV at an MOI of 2. Cell supernatant collected 24 and 48 h p.i. was used to infect Vero cells to measure virus yields (PFU/ml) from infected MEF TIAR−/− or infected MEF WT samples. Values were plotted as for panel B (n = 6). *, P < 0.05 (significant); **, P < 0.01 (highly significant).
FIG 6
FIG 6
Functional analysis of TIA-1 overexpression in TBEV-infected cells. (A) Whole-cell extracts of MEF WT, MEF TIA-1−/−, and MEF TIAR−/− were immunoblotted in parallel for TIAR (top) and TIA-1 (middle). β-Actin was the loading control (bottom). (B) Whole-cell extracts from U2OS (mock), U2OS_EGFP_TIA-1, and U2OS_EGFP cells were subjected to immunoblotting with anti-EGFP (left) and anti-TIA-1 (right) antibodies. (C) U2OS_EGFP_TIA-1 cells (top row) and U2OS_EGFP cells (bottom row) show nuclear and nucleocytoplasmic localization of EGFP–TIA-1 and EGFP, respectively (left column). After heat shock, SG are readily formed in the cytoplasm of both cell lines (right columns). EGFP in U2OS_EGFP_TIA-1 (top), but not in U2OS_EGFP (bottom), costained with anti-TIA-1 antibodies. (D) U2OS_EGFP_TIA-1 cells or their control U2OS_EGFP cells were infected with TBEV at an MOI of 2, and 24- and 48-h p.i., the cell supernatants were used to infect Vero cells to measure virus yields (PFU/ml) from infected U2OS_EGFP_TIA-1 or infected MEF WT samples. Average values of triplicate independent experiments (n = 3) are shown, with standard deviations and P values, as described in the text. (E) Total RNA was extracted from cells infected as for panel D and used as a template for real-time qPCR using primers specific for TBEV (5′-NCR). TBEV amplification products were normalized to β-actin RNA. The relative increase in TBEV RNA in U2OS_EGFP_TIA-1 cells with respect to U2OS_EGFP is shown. Values are plotted as in Fig. 5B (n = 3). *, P < 0.05 (significant); **, P < 0.01 (highly significant).
FIG 7
FIG 7
Functional analysis of TIA-1 following TBEV replicon transfection. (A) U2OS_EGFP_TIA-1 cells and U2OS_EGFP cells were electroporated with replicon TNd/ΔME_C17_fluc, encoding the firefly luciferase reporter, and with a plasmid encoding Renilla luciferase for normalization. At 24 and 48 h p.e., the cells were lysed, and dual-luciferase activity was measured (n = 3). Values are shown as normalized firefly/Renilla relative light units (RLU). (B) MEF TIA-1−/− and their control MEF WT were electroporated, and dual-luciferase activity was measured 24 and 48 h p.e,. as described for panel A. (C) U2OS cells were transfected with siNTG or with the TIA-1-specific siRNA (siTIA-1). After 48 h, the cells were electroporated with replicon TNd/ΔME_C17_fluc and with a plasmid encoding Renilla luciferase for normalization. At 24 and 48 h p.e., the cells were lysed, and dual-luciferase activity was measured (n = 3). Values are shown as normalized firefly/Renilla relative light units (RLU). (D) Cells treated as for panel C were harvested for immunoblotting at 24 and 48 h p.e. β-Actin was the loading control. (E) MEF TIA-1−/− and their control MEF WT were electroporated with TNd/ΔME_C17_fluc. A time course of firefly luciferase activity normalized to the internal Renilla luciferase control is shown as relative light units calculated as described previously (n = 3) (23). (F) MEF TIA-1−/− and their control MEF WT were electroporated with TNd/ΔME_C17_fluc_GAA. A time course, as described for panel C, is shown. *, P < 0.05 (significant); **, P < 0.01 (highly significant).

References

    1. Lindenbach BD, Thiel HJ, Rice CM. 2007. Flaviviridae: the viruses and their replication, p 1101–1152 In Knipe DM, Howley PM, Griffin DE, Lamb RA, Martin MA. (ed), Fields virology, 5th ed. Lippincott, Williams & Wilkins, Philadelphia, PA
    1. Fernandez-Garcia MD, Mazzon M, Jacobs M, Amara A. 2009. Pathogenesis of flavivirus infections: using and abusing the host cell. Cell Host Microbe 5:318–328. 10.1016/j.chom.2009.04.001 - DOI - PubMed
    1. Gritsun TS, Lashkevich VA, Gould EA. 2003. Tick-borne encephalitis. Antiviral Res. 57:129–146. 10.1016/S0166-3542(02)00206-1 - DOI - PubMed
    1. Lindquist L, Vapalahti O. 2008. Tick-borne encephalitis. Lancet 371:1861–1871. 10.1016/S0140-6736(08)60800-4 - DOI - PubMed
    1. Mansfield KL, Johnson N, Phipps LP, Stephenson JR, Fooks AR, Solomon T. 2009. Tick-borne encephalitis virus; a review of an emerging zoonosis. J. Gen. Virol. 90:1781–1794. 10.1099/vir.0.011437-0 - DOI - PubMed

Publication types

MeSH terms