. 2011 Jul 1:25:1-38.
doi: 10.4054/DemRes.2011.25.1.

The future of death in America

Affiliations

The future of death in America

Gary King et al. Demogr Res. .

Abstract

Population mortality forecasts are widely used for allocating public health expenditures, setting research priorities, and evaluating the viability of public and private pensions, and health care financing systems. In part because existing methods forecast less accurately when based on more information, most forecasts are still based on simple linear extrapolations that ignore known biological risk factors and other prior information. We adapt a Bayesian hierarchical forecasting model capable of including more known health and demographic information than has previously been possible. This leads to the first age- and sex-specific forecasts of American mortality that simultaneously incorporate, in a formal statistical model, the effects of the recent rapid increase in obesity, the steady decline in tobacco consumption, and the well known patterns of smooth mortality age profiles and time trends. Formally including new information in forecasts can matter a great deal. For example, we estimate an increase in male life expectancy at birth from 76.2 years in 2010 to 79.9 years in 2030, which is 1.8 years greater than the U.S. Social Security Administration projection and 1.5 years more than U.S. Census projection. For females, we estimate more modest gains in life expectancy at birth over the next twenty years from 80.5 years to 81.9 years, which is virtually identical to the Social Security Administration projection and 2.0 years less than U.S. Census projections. We show that these patterns are also likely to greatly affect the aging American population structure. We offer an easy-to-use approach so that researchers can include other sources of information and potentially improve on our forecasts too.


Figures

Figure 1
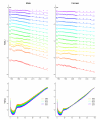
Figure 1
Observed U.S. male mortality, age and time domains Notes: The left panel shows the age profile of male log-mortality (measured by the conditional probability of death) in 1950 and 2007. The right panel shows male log-mortality for select ages observed between 1950 and 2007. Ages are listed along the left side (e.g., “60” represents age [60, 61) years).
Figure 2
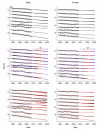
Figure 2
Smoking and obesity prevalence over time Notes: Smoking (top graphs) and obesity (bottom graphs) for females (on the left) and males (on the right) for selected ages (in colors). Observed data are shown as open circles and smoothed estimates as lines. Ages are listed along the left side of each panel (e.g., “60” represents age [60, 61) years).
Figure 3
Figure 3
Male all-cause log-mortality forecast: Lee-Carter, linear time trend, time+smoking, and time+smoking+obesity Notes: Log-mortality forecasts by the Lee-Carter approach (1st column) and three least squares regressions: time (2nd column), time and smoking lagged 25 years (3rd column), and time, smoking lagged 25 years, and obesity lagged 25 years (4th column). Observed mortality are shown as open circles. Ages are listed along the left side of each panel in the upper row (e.g., “60” represents age [60, 61) years).
Figure 4
Figure 4
Male and female log-mortality over time and age groups for our model including time, smoking, obesity, and smoothness priors Notes: The top panel shows observed male (left) and female (right) log-conditional probability of death (in circles) along with model forecasts (solid lines) for selected ages. The bottom panels give the age profile of model forecasts between 1980 and 2030, again for males (left) and females (right), and color-coded for select years. SSA forecasts are represented by + signs. Age groups are listed along the left side of each upper panels (e.g., “60-64” represents age [60, 65) years).
Figure 5
Figure 5
Expected age at death and aged dependency ratio over time Notes: The left and middle panels give expected age at death for males (left) and females (middle) at age 0 and 65 under the time+smoking+obesity model, as well as Social Security Administration projections (+). (In a period life table, the expected age of death equals the sum of life expectancy and age.) The right panel gives the ratio of elderly (≥ 65 years) to the working age population (between 20 and 64 years).
Figure 6
Figure 6
Model-based uncertainty: Prior specification, lag length specification, covariate specification Notes: For males (in the left column) and females (in the right column), the first row shows forecast uncertainty intervals due to changes in the prior specification, the second row due to different lag lengths, and the third row due to covariate specification (time+smoking or time+smoking+obesity, each with plausible prior specifications lagged 25 years). Observed log-conditional probabilities of mortality are shown as open circles. Ages are listed along the left side of each panel (e.g., “60” represents age [60, 61) years).
Figure 7
Figure 7
Sigma grid Note: Each (σage, σtime) point represents a separate model.
Figure 8
Figure 8
Objective function Note: Three-dimensional plot of σage, σtime, and corresponding objective function values.
Figure 9
Figure 9
Sigma grid with objective function quartiles Notes: Sigma grid color-coded to represent the quartile of objective function values. Sigma combinations with the lowest objective function quartile are shown in red, second lowest in yellow, second highest in green, and highest in blue. The sigma combination minimizing the objective function is shown as a black dot.

References

    1. Allison DB, Wang C, Redden DT, Westfall AO, Fontaine KR. Obesity and years of life lost—reply. Journal of the American Medical Association. 2003;289(14):1777–1778. doi:10.1001/jama.289.14.1777-c.
    1. Baker J, Olsen L, Sørensen T. Childhood body-mass index and the risk of coronary heart disease in adulthood. The New England Journal of Medicine. 2007;357(23):2329–2337. doi:10.1056/NEJMoa072515. - PMC - PubMed
    1. Baur J, Pearson K, Price N, Jamieson H, Lerin C, Kalra A, Prabhu V, Allard J, Lopez-Lluch G, Lewis K, Pistell P, Poosala S, Becker K, Boss O, Gwinn D, Wang M, Ramaswamy S, Fishbein K, Spencer R, Lakatta E, Le Couteur D, Shaw R, Navas P, Puigserver P, Ingram D, de Cabo R, Sinclair D. Resveratrol improves health and survival of mice on a high-calorie diet. Nature. 2006;444(16):337–342. doi:10.1038/nature05354. - PMC - PubMed
    1. Berger J. An overview of robust Bayesian analysis (with discussion) Test. 1994;3:5–124. doi:10.1007/BF02562676.
    1. Bergman R, Kim S, Catalano K, Hsu I, Chiu J, Kabir M, Hucking K, Ader M. Why visceral fat is bad: Mechanisms of the metabolic syndrome. Obesity. 2006;14(Supplement 1):16S–19S. doi:10.1038/oby.2006.277. - PubMed

LinkOut - more resources