. 2014 Jul;8(4):422-30.
doi: 10.1111/irv.12249. Epub 2014 Apr 4.

Relationships between A(H1N1)pdm09 influenza infection and infections with other respiratory viruses

Affiliations

Relationships between A(H1N1)pdm09 influenza infection and infections with other respiratory viruses

Tal Meningher et al. Influenza Other Respir Viruses. 2014 Jul.

Abstract

Background: A(H1N1)pdm09, a new influenza pandemic virus emerged in 2009. The A(H1N1)pdm09 infection had several unique characteristics which included rapid transmissibility and high morbidity in obese individuals, pregnant women and individuals suffering from chronic diseases.

Objectives: To study the relationships between A(H1N1)pdm09 influenza infection and infections with other respiratory viruses such as respiratory syncytial virus (RSV), human metapneumo virus (hMPV), adenovirus and seasonal influenza.

Methods: Samples (nasopharyngeal swabs or aspirates) collected between 2007 until 2012 from patients of various ages that were hospitalized due to respiratory virus infections were analyzed for the presence of various respiratory viruses, using qRT-PCR.

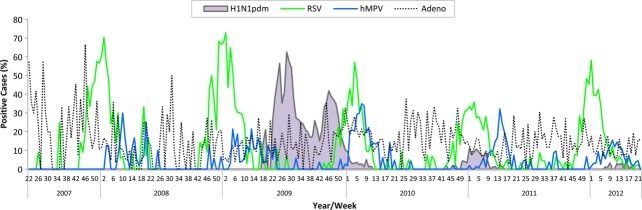
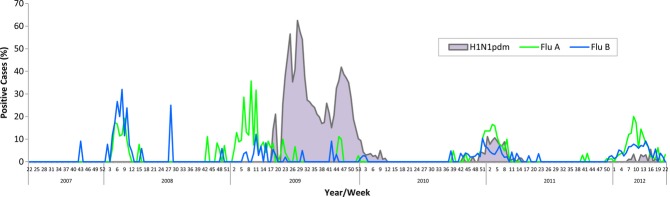
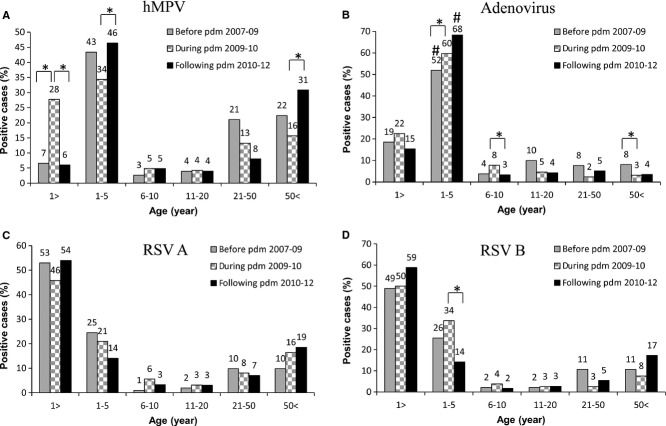
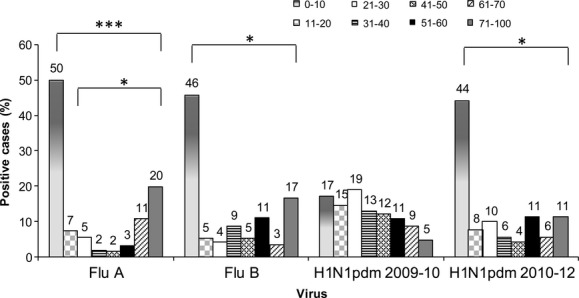
Results: In 2009-2010, when the pandemic influenza A(H1N1)pdm09 first appeared, two major infection peaks were noted and individuals of various ages were infected. Following the decline of the A(H1N1)pdm09 virus infection, the percentages of patients infected with adenovirus and hMPV increased, while infection frequency with RSV B and with seasonal influenza virus decreased. Furthermore, RSV infections were delayed and very few percentages of patients were co-infected with more than one virus. Interestingly, the A(H1N1)pdm09 virus lost its dominancy when it reappeared in the winter of 2010-2011, and at this time, only the incidence of RSV infections was affected by the A(H1N1)pdm09 virus.

Conclusions: The A(H1N1)pdm09 virus had distinct effects on other respiratory viruses when it first appeared versus later, when it evolved from being a pandemic to a seasonal virus.

Keywords: A(H1N1)pdm09 virus; human metapneumo virus; respiratory syncytial virus; respiratory viruses; seasonal influenza viruses.


Figures

Figure 1
Figure 1
Time scale of infection with various respiratory viruses. Presentation of the weekly percent of positive cases for infection with various respiratory viruses (Adenovirus, hMPV, RSV) from 2007 to 2012. The green line summarizes infections with RSV A and RSV B. The A(H1N1)pdm09 infection is indicated as (H1N1pdm). The percentage of individuals infected with each virus was calculated each week.
Figure 2
Figure 2
Time scale of infection with influenza viruses. Presentation of the weekly percent of positive cases of infection with various strains of influenza virus (A and B), from 2007 to 2012. The A(H1N1)pdm09 infection is indicated as (H1N1pdm). The percentage of individuals infected with each virus was calculated each week. “Flu A” includes seasonal H1N1 and H3N2 only.
Figure 3
Figure 3
Age distribution of patients infected with various respiratory viruses. Presentation of the ages of patients hospitalized over three periods: before (2007–2009), during (2009–2010) and following (2010–2012) the A(H1N1)pdm09 pandemic. Patients were monitored for hMPV (A, 492 patients), adenovirus (B, 1080 patients), RVS A (C, 814 patients), and RSV B (D, 423 patients). For each virus, the sum of the positive cases per period was set as 100% and the percentages of the various age groups per period were calculated for each virus type. The number that appears above the columns represents the percentage of the positive cases of each virus in every age group in every period. * P < 0·05 using the chi-square test to compare between 2009–2010 and 2007–2009 in each age group. In addition, we compare between 2009–2010 and 2010–2012 in each age group. # In the Adenovirus graph (B) P < 0·05 using the chi-square test to compare between 2007–2009 and 2010–2012.
Figure 4
Figure 4
Age distribution of patients infected with the influenza virus. Presentation of the ages of patients hospitalized due to influenza infections between 2007 and 2012. Patients were monitored for influenza A (Flu A) (n = 317), influenza B (Flu B) (n = 174) and A(H1N1)pdm09 (n = 4180). For A(H1N1)pdm09 (H1N1pdm), two periods are shown: 2009–2010 (n = 4038 patients) and 2010–2012 (n = 142 patients). For each virus type, the sum of the positive cases was set as 100% and the percentage of the various age groups was calculated for each virus type. The number that appears above the columns represents the percentage of the positive cases of each virus in every age group. * P < 0·05 using chi-square test. *** P < 0·0008 using chi-square test.
Figure 5
Figure 5
Distribution of co-infections. Presentation of the percentages of co-infection over three periods: before (2007–2009), during (2009–2010) and following (2010–2012) the A(H1N1)pdm09 pandemic. In each period, the sum of the co-infection cases was set as 100% and the percentage of the various co-infection pairs per period was calculated. The co-infection analysis was performed on samples that were tested for the presence of all viruses. */ # P < 0·05 using chi-square test.
Figure 6
Figure 6
Clinical characteristics of patients infected with A(H1N1)pdm09. A summary of the clinical symptoms of A(H1N1)pdm09 (H1N1pdm)-positive patients hospitalized at Chaim Sheba Medical Center in 2009 and in 2010–2012. The number that appears above the columns represents the percentage of patients expressing the indicated clinical characteristic. * P < 0·05 using the chi-square test.

Similar articles

Cited by

References

    1. Sloots TP, Whiley DM, Lambert SB, Nissen MD. Emerging respiratory agents: new viruses for old diseases? J Clin Virol. 2008;42:233–243. - PMC - PubMed
    1. Jagger BW, Wise HM, Kash JC, et al. An overlapping protein-coding region in influenza A virus segment 3 modulates the host response. Science. 2012;337:199–204. - PMC - PubMed
    1. Sandrock C, Stollenwerk N. Acute febrile respiratory illness in the ICU: reducing disease transmission. Chest. 2008;133:1221–1231. - PMC - PubMed
    1. Stollenwerk N, Harper RW, Sandrock CE. Bench-to-bedside review: rare and common viral infections in the intensive care unit-linking pathophysiology to clinical presentation. Crit Care. 2008;12:219. - PMC - PubMed
    1. Feuillet F, Lina B, Rosa-Calatrava M, Boivin G. Ten years of human metapneumovirus research. J Clin Virol. 2012;53:97–105. - PubMed

MeSH terms