. 2014 Apr 2;82(1):79-93.
doi: 10.1016/j.neuron.2014.02.019.

Reduced synaptic STIM2 expression and impaired store-operated calcium entry cause destabilization of mature spines in mutant presenilin mice

Affiliations

Reduced synaptic STIM2 expression and impaired store-operated calcium entry cause destabilization of mature spines in mutant presenilin mice

Suya Sun et al. Neuron. .

Abstract

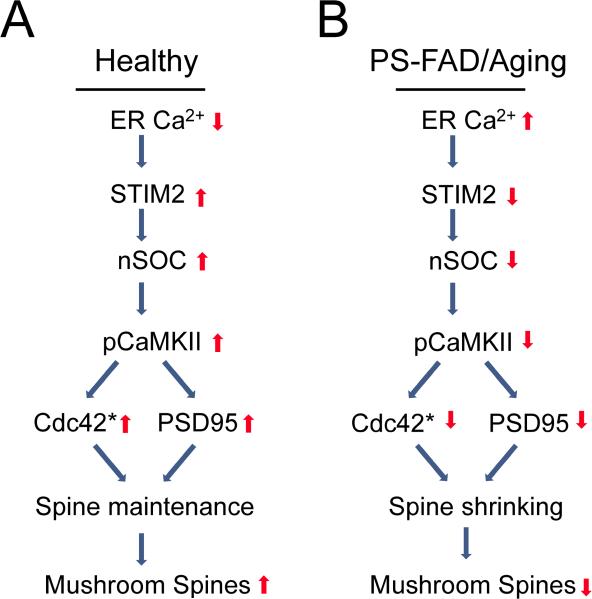
Mushroom dendritic spine structures are essential for memory storage, and the loss of mushroom spines may explain memory defects in Alzheimer's disease (AD). Here we show a significant reduction in the fraction of mushroom spines in hippocampal neurons from the presenilin-1 M146V knockin (KI) mouse model of familial AD (FAD). The stabilization of mushroom spines depends on STIM2-mediated neuronal store-operated calcium influx (nSOC) and continuous activity of Ca(2+)/calmodulin-dependent protein kinase II (CaMKII). We demonstrate that STIM2-nSOC-CaMKII pathway is compromised in KI neurons, in aging neurons, and in sporadic AD brains due to downregulation of STIM2 protein. We further establish that overexpression of STIM2 rescues synaptic nSOC, CaMKII activity, and mushroom spine loss in KI neurons. Our results identify STIM2-nSOC-CaMKII synaptic maintenance pathway as a novel potential therapeutic target for treatment of AD and age-related memory decline.


Figures

Figure 1
Figure 1. Loss of Mushroom Spines in PS1-M146V KI Hippocampal Neurons
(A) The spine shape of primary hippocampal neurons from WT or KI mice was visualized with TD-Tomato. Subcellular localization of PSD95 was analyzed by immunostaining of hippocampal cultures. (B) Total spine density and percentage of various spine types in hippocampal neuronal cultures from WT and KI mice. For spine quantification, n=21-23 neurons (from 4 batches of cultures) were analyzed for each group. All the data was collected. (C, E, G). Spine morphology in CA1 hippocampal neurons from 3 months old (C), 6 months old (E) and 12 months old (G) WT and KI mice was visualized by Lucifer yellow injections and 2-photon imaging. (D, F, H) Total spine density and percentage of mushroom (M), stubby (S) and thin (T) spine types in hippocampal neurons from 3 months old (D), 6 months old (F) and 12 months old (H) WT and KI mice. On panels (A), (C), (E) and (G) mushroom spines are marked by arrows; thin spines are marked by triangles; stubby spines are marked by chevron. Scale bars represent 10 μm at panel (A) and 5 μm at panels (C), (E) and (G). n=3 mice for each group. Values are shown as mean ± SEM. * p<0.05, ** p<0.01, **** p<0.0001 by t-test.
Figure 2
Figure 2. Reduced Synaptic Store-Operated Ca2+ Entry in PS1-M146V KI Hippocampal Neurons
(A) Fura-2 fluorescence in live hippocampal neurons. Somatic ROI is shown by a red circle. (B, C) Time course of Fura-2 Ca2+ signals (F340/F380) is shown for WT and KI hippocampal neurons following 2 min (B) or 30 min (C) store-depletion protocol. (D) GCaMP5.3 fluorescence in live hippocampal neurons. The samples for synaptic ROI are shown by a red circle. (E) Time course of synaptic GCaMP5.3 Ca2+ signals (ΔF/F0) is shown for WT and KI hippocampal neurons following 30 min store-depletion protocol. On panels (B, C and E) individual cell traces (gray) and average traces (black) are shown for each experimental group. (F) The average peak SOC responses in soma and spines of WT and KI hippocampal neurons (normalized to WT). Values are shown as mean ± SEM (All the data was collected from 3-5 batches of cultures). **p<0.01, **** p<0.0001 by t-test.
Figure 3
Figure 3. Downregulation of STIM2 Protein in PS1-M146V KI Hippocampal Neurons
(A). The expression levels of STIM1, STIM2 and TRPC1 protein were analyzed by Western blotting of lysates from WT and KI hippocampal cultures. Tubulin was used as loading control. ns – non-specific band. (B) Quantification of STIM1, STIM2 and TRPC1 expression levels in WT and KI cultures (normalized to tubulin levels). (C) Subcellular localization of STIM1 and STIM2 were analyzed by immunostaining of hippocampal cultures. MAP2 was used for neuronal labeling. Scale bar: 10μm. (D and E) STIM2 localization in WT and KI neurons transfected with TD-Tomato. Mushroom spines are marked by arrows; thin spines are marked by triangles; stubby spines are marked by chevron. Scale bars in (D): 20 μm in the left panels and 10μm in the right panel. (F) The fraction of STIM2-positive spines is shown for mushroom (M), stubby (S) and thin (T) spines in WT and KI neurons. All the data was collected from 3 batches of cultures. Values are shown as mean ± SEM. * p<0.05, **** p<0.0001 by t-test.
Figure 4
Figure 4. Downregulation of STIM2 Protein in PS1-M146V KI and Aging Mice Hippocampus and in Cortex of Alzheimer's Patients
(A) The expression levels of STIM1, STIM2 and TRPC1 proteins were analyzed by Western blotting of hippocampal lysates from 6 months old WT and KI mice. (B) Quantification for Western blotting data shown on panels (A) and Figures S4A and S4B. (C) The expression levels of STIM1, STIM2 and TRPC1 proteins were analyzed by Western blotting of hippocampal lysates from 6 months, 9 months, 12 months and 16 months old WT mice. (D) Quantification of Western blotting data shown on panel C. (E) The expression levels of STIM1, STIM2 and TRPC1 proteins were analyzed by Western blotting of normal human (Con) and AD patient's (AD) cortical lysates. (F) Quantification of Western blotting data shown on panel (E) and Figure S4E. (G) Correlation between STIM2 levels and MMSE scores. The STIM2 expression levels (normalized to tubulin) were plotted versus MMSE score for each AD patient (filled circles) and 4 control subjects (open circles). Straight line is a linear fit to all 15 data points (r2 = 0.38). Tubulin was used as a loading control in all Western blots, and signal intensity of STIM1, STIM2 and TRPC1 bands was normalized to tubulin level in the same sample. Sample in each column was from individual mouse or human tissue. Average values are shown as mean ±SEM (n = 3 mice and 11 human tissues for each group). * p<0.05, **p<0.01 by t-test or one-way ANOVA followed by Tukey test
Figure 5
Figure 5. Genetic Deletion of STIM2 Causes Impaired nSOC and Loss of Mushroom Spines in Hippocampal Neurons
(A) Time-course of Fura-2 Ca2+ signal in the soma and GCamP5.3 Ca2+ signal in the spines are shown for Stim2fl/fl hippocampal neurons transduced with NLS-GFP or NLS-Cre as indicated. Individual cell traces (gray) and average trace (black) are shown for each group. (B) The average peak SOC responses in soma and spines of Stim2fl/fl hippocampal neurons transduced with NLS-GFP or NLS-Cre (normalized to NLS-GFP). (C) Expression levels of STIM1, STIM2 and TRPC1 were analyzed by Western blotting of lysates prepared from Stim2fl/fl hippocampal cultures infected with Lenti-NLS-GFP or Lenti-NLS-Cre as indicated. Tubulin was used as a loading control. ns is a non-specific band. (D) Spine morphology of the primary hippocampal neurons from Stim2fl/fl mice transduced with NLS-GFP or NLS-Cre was visualized with TD-tomato. Mushroom spines are marked by arrows. Scale bar: 10 μm. (E) Total spine density and percentage of various spine types in hippocampal neuronal cultures from Stim2fl/fl mice transduced with NLS-GFP or NLS-Cre. M – mushroom, S- stubby, T – thin. For spine quantification, n=18-20 neurons was analyzed. The data were collected from 4 batches of cultures for each group. (F) Expression levels of STIM1, STIM2 and TRPC1 were analyzed by Western blotting of hippocampal lysates prepared from Stim2fl/fl mice injected with AAV1-NLS-GFP or AAV1-NLS-Cre as indicated. Tubulin was used as a loading control. Each sample was from individual mouse. (G) Spine morphology in hippocampal neurons from 4 months old Stim2fl/fl mice injected with AAV1-NLS-GFP or AAV1-NLS-Cre was visualized by Lucifer yellow injections and 2-photon imaging. The infected neurons were identified by GFP fluorescence. Mushroom spines are marked by arrows. Scale bar: 5 μm. (H) Total spine density and percentage of various spine types in hippocampal slices from 4 months old Stim2fl/fl mice injected with AAV1-NLS-GFP or AAV1-NLS-Cre (n=4 mice for each group). M – mushroom, S- stubby, T – thin. Values are shown as mean ±SEM. *p<0.05, **p<0.01, *** p<0.001, **** p<0.0001 by t-test.
Figure 6
Figure 6. Over-Expression of STIM2 Rescues Synaptic nSOC and Mushroom Spine Deficit in Hippocampal Neurons from PS1-M146V KI Mice
(A) Time-course of GCamP5.3 Ca2+ signal in the spines of WT and KI hippocampal neurons transfected with NLS-GFP, mSTIM1 and mSTIM2 as indicated. Individual cell traces (gray) and average trace (black) are shown for each group. (B) The peak SOC responses in spines of WT and KI hippocampal neurons transfected with NLS-GFP, mSTIM1 and mSTIM2 as indicated. The values of ΔF/F0 signals were averages for each group of cells. (C) The spine morphology of WT and KI primary hippocampal neurons transfected with NLS-GFP, mSTIM1 or mSTIM2 was visualized with TD-tomato. Mushroom spines are marked by arrows. Scale bar: 10 μm. (D) Total spine density and percentage of mushroom spines in WT and KI hippocampal neuronal cultures transfected with NLS-GFP, mSTIM1 or mSTIM2. For spine quantification, n=15-24 neurons was analyzed. The data were collected from 4 batches of cultures. (E) The expression levels of STIM1, STIM2, TRPC1 and PSD95 proteins were analyzed by Western blotting of cultured hippocampal neurons which overexpress mSTIMs by lenti-virus. (F) Quantification of TRPC1 and PSD95 proteins for Western blotting data. (G) Spine morphology in hippocampal neurons from 6 months old WT and KI mice which were injected with AAV1-NLS-GFP or AAV1-mSTIM2 was visualized by Lucifer yellow injections and 2-photon imaging. Mushroom spines are marked by arrows. Scale bar: 5 μm. (H) Percentage of mushroom spines in hippocampal slices from 6 months old WT and KI mice injected with AAV1-NLS-GFP or AAV1-mSTIM2 (n=4 mice for each group). (I) The expression levels of STIM1, STIM2, TRPC1 and PSD95 proteins were analyzed by Western blotting of hippocampal lysates from STIM2 rescued KI mice and control mice. (J) Quantification of TRPC1 and PSD95 for Western blotting data shown on panels (I). Values are shown as mean ±SEM. *p<0.05, ** p<0.01, *** p<0.001, **** p<0.0001 by one-way ANOVA or two-way ANOVA followed by Tukey test.
Figure 7
Figure 7. Synaptic CaMKII as Downstream Target for STIM2-nSOC Pathway
(A) Analysis of PSD95, pCaMKII and CaMKII levels in WT and KI hippocampal neurons treated with nSOC inhibitors (SKF96365, 30 μM and 2-APB, 30 μM) for 16 hours and in Stim2fl/fl neurons transduced with NLS-Cre and NLS-GFP in vitro and in vivo. (B) The levels of PSD95, pCaMKII and CaMKII were analyzed by Western blotting of hippocampal lysates from 6 months, 9 months and 12 months old WT mice. Sample in each lane was from individual mouse. (C) Quantification of Western blotting data shown on panel B. (D) The expression levels of pCaMKII and CaMKII levels proteins were analyzed by Western blotting of cultured hippocampal neurons which overexpress mSTIMs by lenti-virus. (E) Quantification of pCaMKII and CaMKII levels proteins for Western blotting data on panel D. (F) The expression levels of pCaMKII and CaMKII proteins were analyzed by Western blotting of hippocampal lysates from STIM2 rescued KI mice and control mice. (G) Quantification of pCaMKII and CaMKII for Western blotting data shown on panels F. (C) and (G) Average values (normalized to tubulin) are shown as mean ±SE (n=3 mice for each group). Tubulin was used as a loading control in all Western blotting experiments. Average values are shown as mean ±SEM. * p<0.05, **p<0.01, by one-way or two-way ANOVA followed by Tukey test.
Figure 8
Figure 8. Role of STIM2-nSOC-CaMKII Pathway in Maintenance of Mushroom Postsynaptic Spines
(A) In healthy neurons continuous Ca2+ influx via STIM2-nSOC pathway supports constant levels of CaMKII activity in the spines, leading to activation of Cdc42, stabilization of PSD95 and long-term stability of mushroom spines. (B) In PS-FAD and aging neurons increase in ER Ca2+ levels causes compensatory downregulation of STIM2 expression, impaired nSOC Ca2+ influx, reduced steady-state CaMKII activity in the spines, reduced Rac1/Cdc42 activity, destabilization of PSD95, and eventual loss of mushroom spines. Loss of mushroom spines results in memory impairment in aging and AD neurons. * activated Rac1/cdc42 kinase.

Similar articles

Cited by

References

    1. Akbari Y, Hitt BD, Murphy MP, Dagher NN, Tseng BP, Green KN, Golde TE, LaFerla FM. Presenilin regulates capacitative calcium entry dependently and independently of gamma-secretase activity. Biochemical and biophysical research communications. 2004;322:1145–1152. - PubMed
    1. Auffret A, Gautheron V, Mattson MP, Mariani J, Rovira C. Progressive age-related impairment of the late long-term potentiation in Alzheimer's disease presenilin-1 mutant knock-in mice. Journal of Alzheimer's disease : JAD. 2010;19:1021–1033. - PMC - PubMed
    1. Bandara S, Malmersjo S, Meyer T. Regulators of Calcium Homeostasis Identified by Inference of Kinetic Model Parameters from Live Single Cells Perturbed by siRNA. Science signaling. 2013;6:ra56. - PMC - PubMed
    1. Berna-Erro A, Braun A, Kraft R, Kleinschnitz C, Schuhmann MK, Stegner D, Wultsch T, Eilers J, Meuth SG, Stoll G, et al. STIM2 regulates capacitive Ca2+ entry in neurons and plays a key role in hypoxic neuronal cell death. Sci Signal. 2009;2:ra67. - PubMed
    1. Bezprozvanny I, Hiesinger PR. The synaptic maintenance problem: membrane recycling, Ca2+ homeostasis and late onset degeneration. Mol Neurodegener. 2013;8:23. - PMC - PubMed

Publication types