. 2014 Apr 2;82(1):208-23.
doi: 10.1016/j.neuron.2014.01.039.

Emergence of context-dependent variability across a basal ganglia network

Affiliations

Emergence of context-dependent variability across a basal ganglia network

Sarah C Woolley et al. Neuron. .

Abstract

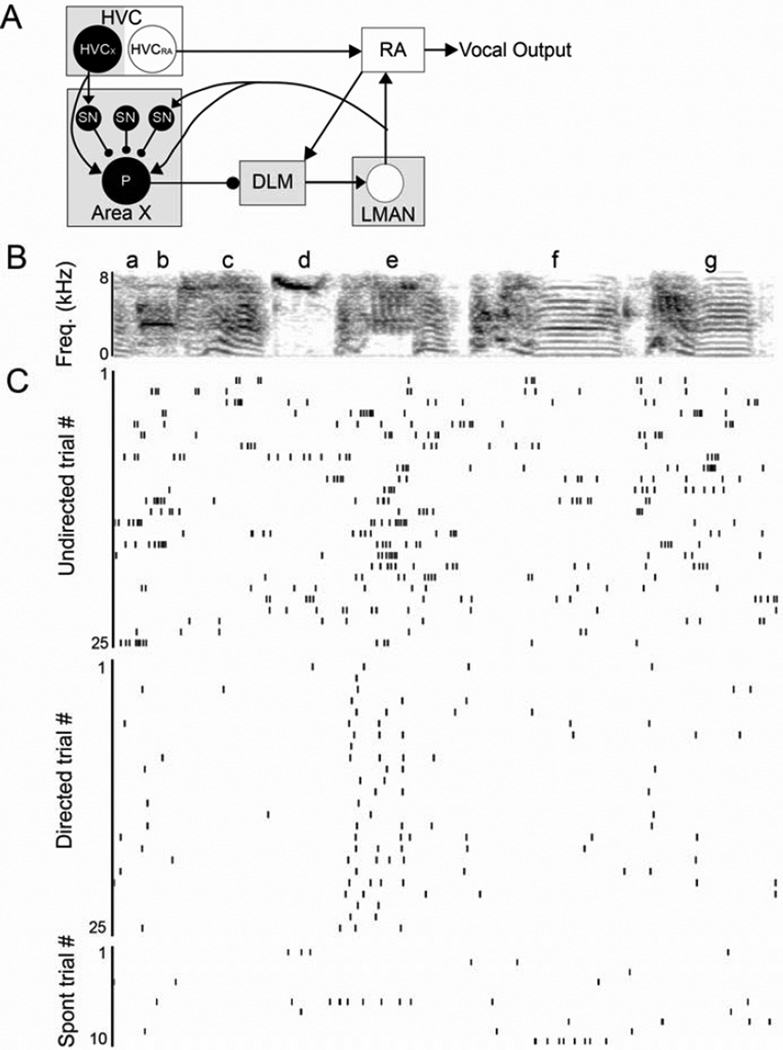
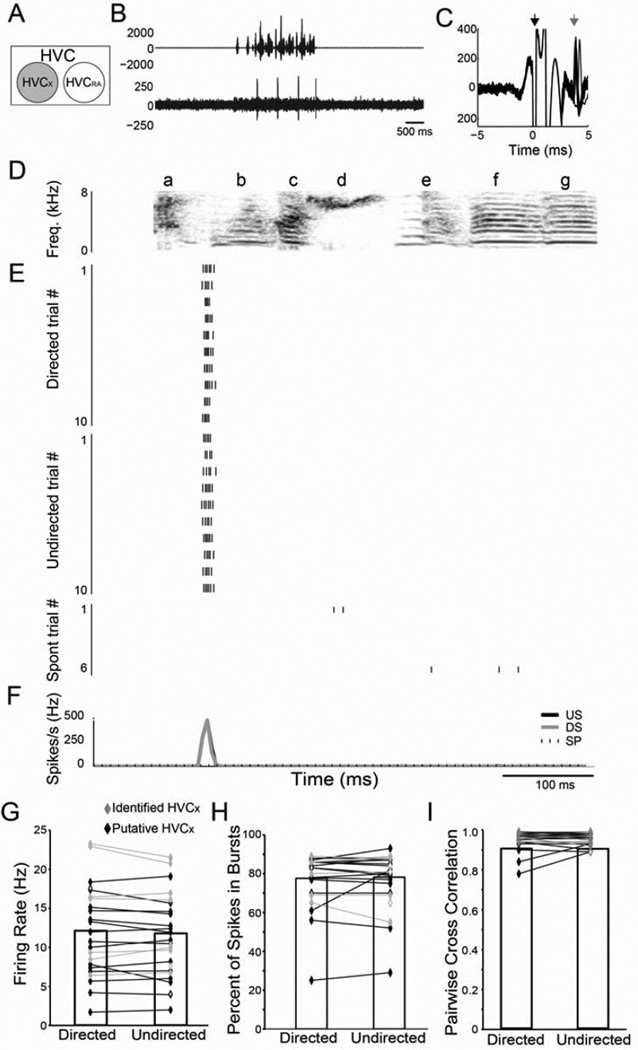
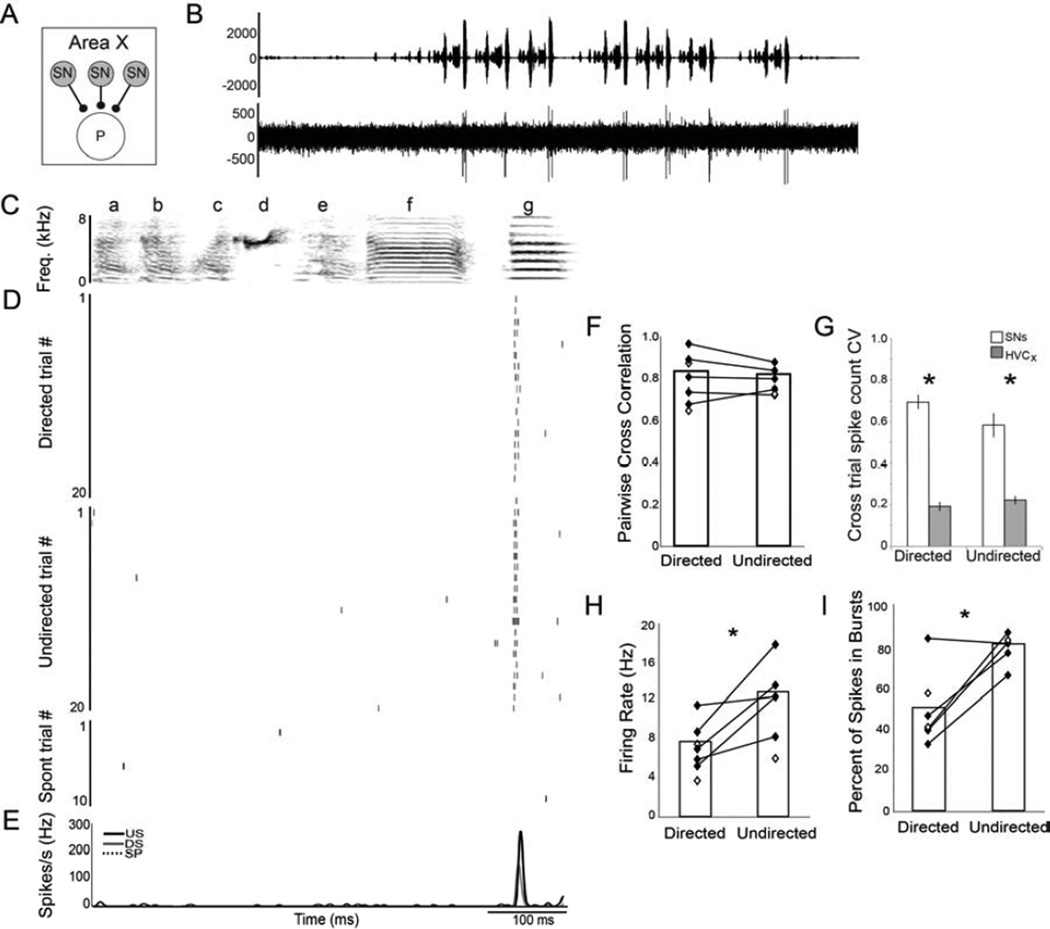
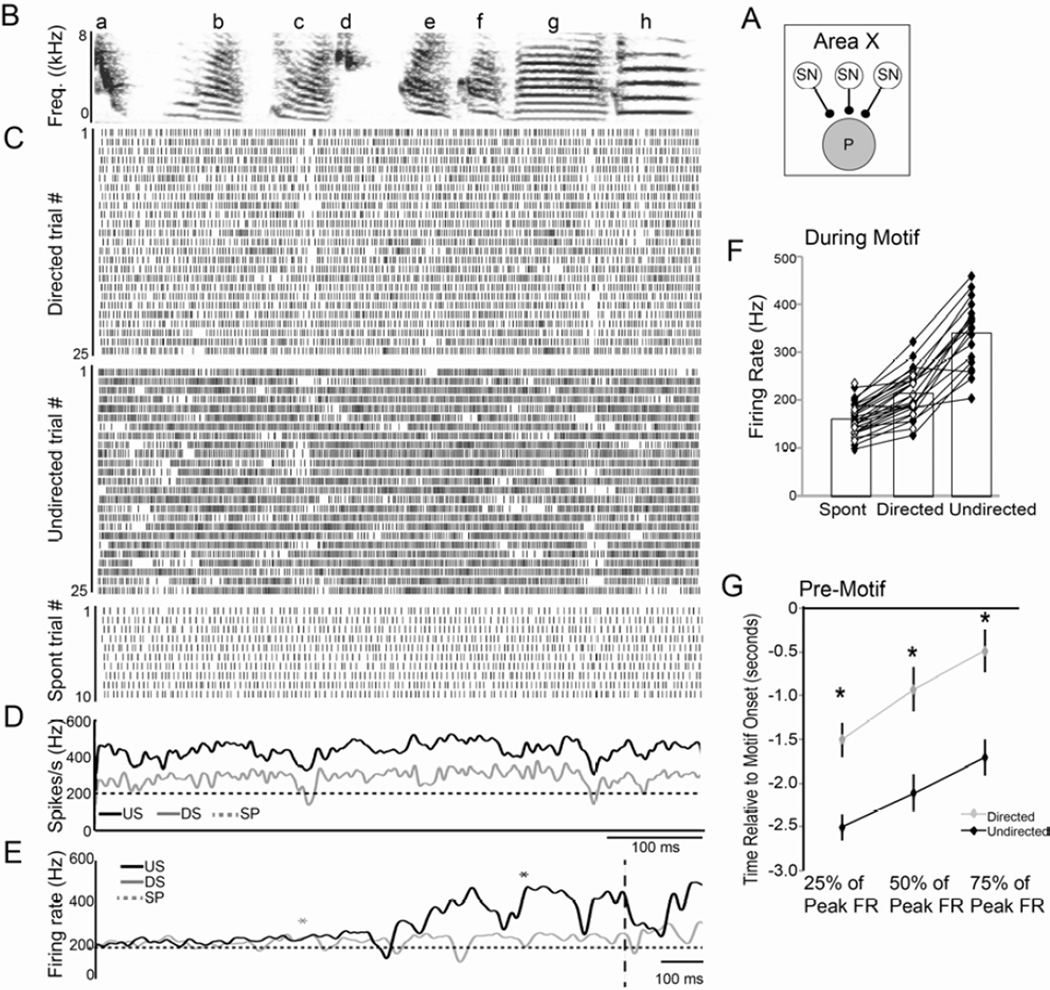
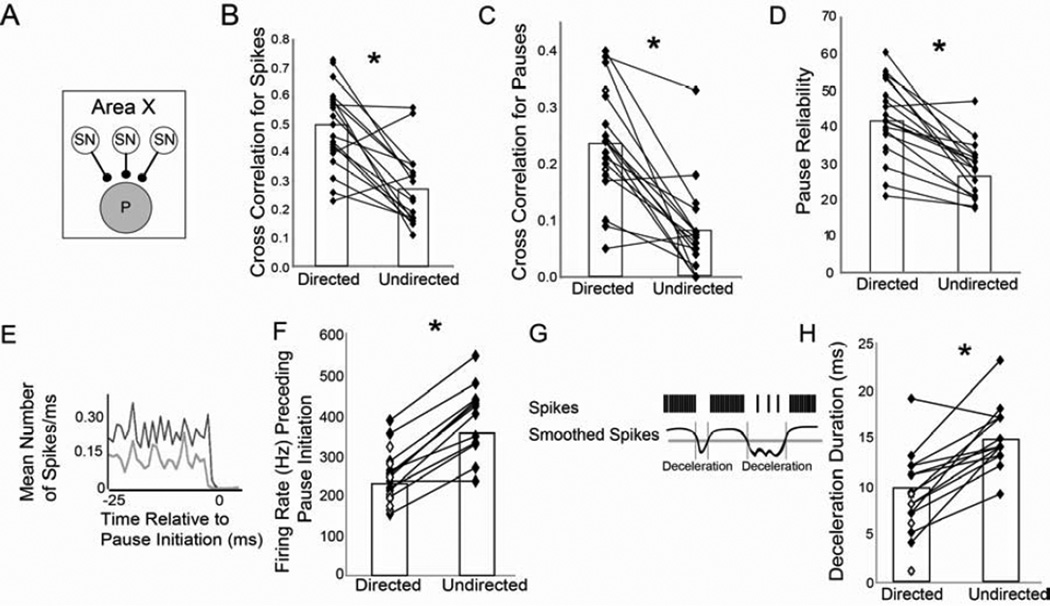
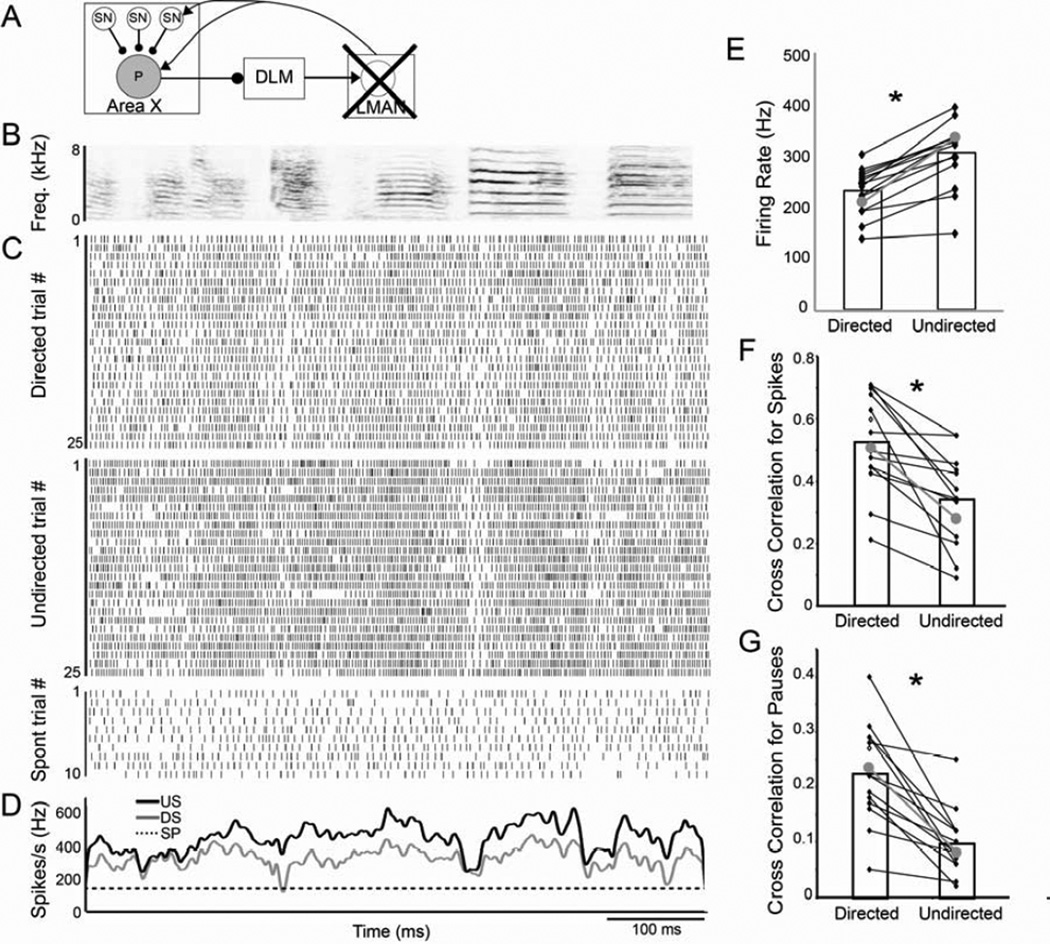
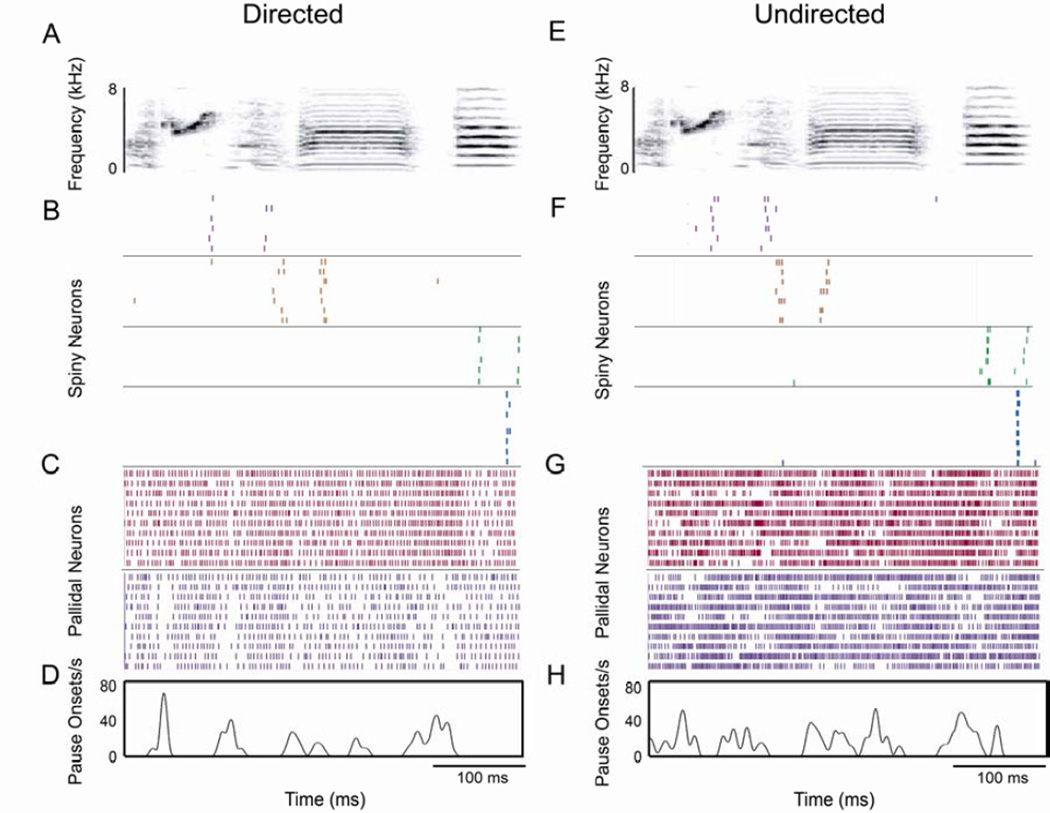
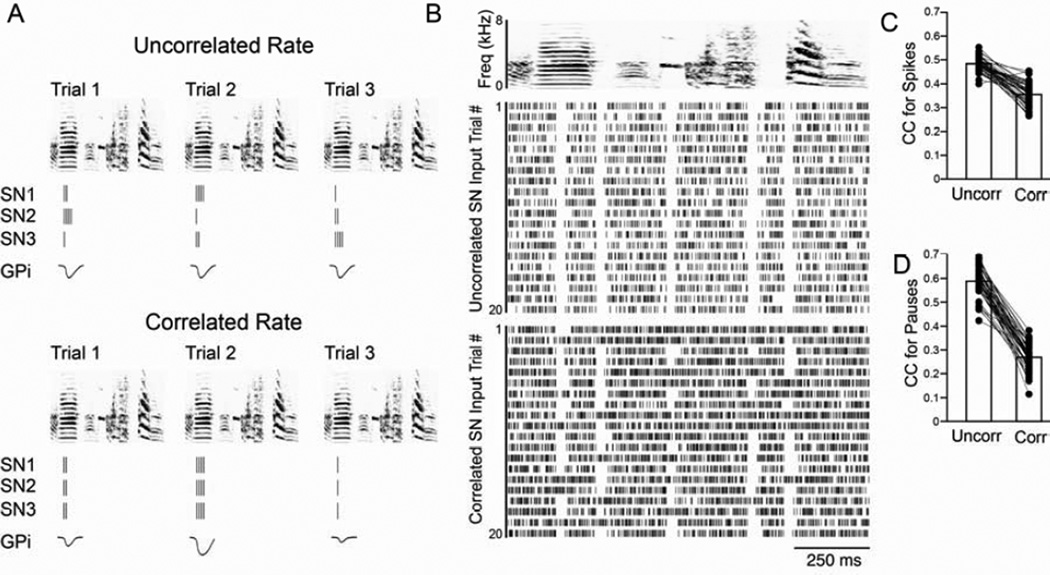
Context dependence is a key feature of cortical-basal ganglia circuit activity, and in songbirds the cortical outflow of a basal ganglia circuit specialized for song, LMAN, shows striking increases in trial-by-trial variability and bursting when birds sing alone rather than to females. To reveal where this variability and its social regulation emerge, we recorded stepwise from corticostriatal (HVC) neurons and their target spiny and pallidal neurons in Area X. We find that corticostriatal and spiny neurons both show precise singing-related firing across both social settings. Pallidal neurons, in contrast, exhibit markedly increased trial-by-trial variation when birds sing alone, created by highly variable pauses in firing. This variability persists even when recurrent inputs from LMAN are ablated. These data indicate that variability and its context sensitivity emerge within the basal ganglia network, suggest a network mechanism for this emergence, and highlight variability generation and regulation as basal ganglia functions.


Figures

Figure 1
Figure 1. Social context influences activity of single neurons in LMAN
(A) In the ‘motor’ pathway (white boxes), HVC (proper name) projects to the robust nucleus of the arcopallium (RA) which innervates motor neurons used for singing (‘vocal output’). The ‘anterior forebrain pathway’ (AFP, gray boxes) also receives input from HVC. Specifically, HVC neurons project to the basal ganglia nucleus Area X, which in turn projects to the lateral magnocellular nucleus of the anterior nidopallium (LMAN) via the medial nucleus of the dorsolateral thalamus (DLM). LMAN provides the output of the AFP to the motor pathway and sends a recurrent projection back to Area X. The connectivity of putative cell types that we recorded from (filled in black) is indicated by circles and lines; glutamatergic HVCX neurons project to GABAergic spiny neurons (SN) in Area X that inhibit pallidal output neurons (P). Pallidal neurons send strong inhibitory projections to the thalamus. The other classes of neurons in Area X (interneurons and GPe neurons) are omitted for simplicity. (B–C) As described in Kao et al., 2008, social context influences the firing rate and variability of neurons in LMAN. (B) Spectrogram of a representative song motif. (C) Raster plots of firing of a single LMAN neuron during 25 motif renditions of undirected (top) and directed (middle) song and during ten non-singing epochs (bottom).
Figure 2
Figure 2. Social context has no effect on the firing of individual HVCX neurons
(A) Recordings from HVCX neurons (gray circle) (B) Amplitude oscillogram of a song (top) and raw trace of the associated neural activity. (C) Trace of the stimulus artifact (black arrow) and evoked spikes (gray arrow) resulting from antidromic stimulation of HVC from Area X. (D) Spectrogram of a representative song motif (‘abcdefg’). (E) Raster plots of a single HVCX neuron during ten motif renditions of directed (DS; top) and undirected (US; middle) song and during six non-singing epochs (SP; bottom). (F) Mean firing pattern during DS (gray line) and US (black line) singing and during spontaneous activity (SP; dashed line). There were no significant differences in firing rate (G), percent of spikes in bursts (H) or the CC (I) between DS and US for identified HVCX neurons (gray diamonds) or putative HVCX single units (black diamonds). For this and all subsequent figures, open diamonds indicate unpaired data and * indicates p<0.05.
Figure 3
Figure 3. Social context modulates the firing rate but not the precision of SNs
(A) Recordings from spiny neurons (SNs; gray circles) in Area X. (B) Amplitude oscillogram of a song (top) and a raw trace of the associated single unit activity. (C) Spectrogram of a representative song motif (‘abcdefg’). (D) Raster plots of firing of a single SN during 20 motif renditions of directed (DS; top) and undirected (US; middle) song and during 10 non-singing epochs (bottom). (E) Mean firing pattern during DS (gray line) and US (black line) and during spontaneous activity (SP; dashed line). (F) Like HVCX neurons, SN firing was highly precise and equally stereotyped for both behavioral conditions, indicated by the high pairwise CCs that were not significantly different between social contexts. (G) HVCX and Area X SNs differed in the variability of their cross-trial firing rates, in particular the variance (CV) of the number of spikes per trial was significantly higher for SNs than HVCX neurons regardless of social context. (H) The average SN firing rate was slightly but significantly higher during US than during DS. (I) A larger percentage of spikes were produced in bursts than as single spikes during US compared to DS. See also Fig. S1.
Figure 4
Figure 4. Social context modulates firing of GPi neurons in Area X
(A) Recordings from pallidal projection neurons in Area X (P; gray circle). (B) Spectrogram of a representative song motif (‘abcdefgh’). (C) Raster plots of singing-related activity of a GPi neuron during 25 motif renditions each of directed song (DS; top) and undirected song (US; middle) and during spontaneous activity (SP; bottom). (D) The mean firing rate over time during US (black line) and DS (gray line) singing as well as during SP (dashed line). The pattern of activity during DS and US is highly similar, despite the difference in firing rate. (E) Average firing rate for DS (gray line) and US (black line) and SP (dashed line) prior to the start of the motif (vertical dashed line). Asterisks indicate the first introductory note for DS (gray) and US (black). During US, the firing rate increases earlier prior to the motif and to the introductory notes (Fig. S2) than during DS. (F) Group data showing the highly consistent firing rate increases between SP, DS and US (all groups are significantly different from each other). (G) Group data showing the time relative to the onset of the motif (time 0) when activity increased to 25, 50, and 75 percent of the peak firing rate. The US firing rate (black) reaches each of those benchmarks significantly earlier than does the DS firing rate (gray). See also Fig. S2.
Figure 5
Figure 5. Social context modulates pauses in GPi neuron firing
For the population of GPi cells (A), the variability of the spike trains was consistently higher during undirected singing (US) than directed singing (DS), illustrated by the significantly lower CC for US (B). (C) Similarly, pause onset times across the motif were also more variable during US, as evidenced by the lower CC. (D) Within pause events, the reliability of pauses across trials was significantly lower during US. (E–F) The firing rate immediately preceding a pause was significantly higher during US than DS. (E) Depicted is the mean spike rate preceding a pause for a single neuron during US (black) and DS (gray). (F) For all but one cell, the activity immediately preceding a pause was significantly greater during US. (G) To measure the duration of ‘decelerations’ in the firing rate we smoothed each spike train (black curve; see Experimental Procedures) then thresholded the smoothed spike trains at 2 SD below the mean (gray horizontal line). Durations of these ‘decelerations’ were then calculated as the difference between onsets and offsets determined based on threshold crossings of the smoothed curve (gray vertical lines). (H) Group data showing that durations of decelerations were significantly longer during US than DS. See also Fig. S3.
Figure 6
Figure 6. LMAN lesions do not eliminate context-dependent differences in variability
(A) Recordings from GPi neurons (P; gray circle) in LMAN lesioned males. (B) Spectrogram of a representative song motif. (C) Raster plots of firing of a single GPi neuron during 25 motif renditions of directed (DS; top) and undirected song (US; middle) and during ten non-singing epochs (bottom). (D) Mean firing pattern during singing (DS in gray, US in black) and spontaneous activity (SP; dashed line). (E) As was the case for GPi neurons in unlesioned birds (gray dots and line in E–F are the means for unlesioned birds), the firing rate of GPi neurons in birds with LMAN lesions was significantly higher during US than DS. In addition, the variability was significantly higher during US than DS, indicated by the lower cross correlation of the spike trains (F) as well as of the pauses (G).
Figure 7
Figure 7. Singing-related activity of a population of SNs and GPi neurons
Sample plots of the song-aligned activity for a randomly selected subset of trials during directed (DS; A–D) and undirected (US; E–H) singing of four SNs and two GPi neurons recorded in a single male. (A, E) Representative spectrograms of DS (A) and US (E). (B, F) Raster plots of four SNs ordered based on the timing of their activity relative to the motif. Different neurons are indicated by different colors and separated by black lines. (C, G) Raster plots of two GPi neurons indicated by different colors and separated by black lines. (D, H) Average pause rate for the second (purple) GPi neuron, generated from 19 DS and 21 US trials. Note the larger number of singing-related events, distributed across the song, compared to SNs.
Figure 8
Figure 8. Increasing the rate correlation in SNs increases pause variability in GPi neurons
(A) Illustration of how altering the degree of rate correlation among SNs could influence the output of GPi neurons. The top panel depicts the responses of three SNs (SN 1–3) and one GPi neuron to three different motif renditions (trials 1–3) when the rates of the SNs are uncorrelated. The SN responses are depicted as raster plots, the GPi neuron response is the inhibitory potential created by the SN inputs, with greater deflection from zero indicating a greater response. The bottom panel depicts the responses of these same neurons when the firing rates are correlated. Note that the GPi responses are predicted to be of similar size in the uncorrelated case, while the GPi responses in the correlated condition vary depending on the quantity of spikes in the SN burst. (B) Example of the output of the model. Top panel is a generic spectrogram. The activity of a hypothetical GPi neuron in response to uncorrelated (middle panel) and correlated (bottom panel) SN inputs is depicted as raster plots. The group data for 50 runs of the model shows that the CC of spikes (C) and pauses (D), like the data from GPi neurons, was higher for the uncorrelated, directed-like repetitions than for the correlated, undirected-like repetitions. See also Fig. S4.

Comment in

Similar articles

Cited by

References

    1. Ali F, Otchy TM, Pehlevan C, Fantana AL, Burak Y, Olveczky BP. The Basal Ganglia is necessary for learning spectral, but not temporal, features of birdsong. Neuron. 2013;80:494–506. - PMC - PubMed
    1. Andalman AS, Fee MS. A basal ganglia-forebrain circuit in the songbird biases motor output to avoid vocal errors. Proc. Natl. Acad. Sci. U.S.A. 2009;106:12518–12523. - PMC - PubMed
    1. Bar Gad I, Bergman H. Stepping out of the box: information processing in the neural networks of the basal ganglia. Curr. Opin. Neurobiol. 2001;11:689–695. - PubMed
    1. Bergman H, Feingold A, Nini A, Raz A, Slovin H, Abeles M, Vaadia E. Physiological aspects of information processing in the basal ganglia of normal and parkinsonian primates. TINS. 1998;21:32–38. - PubMed
    1. Bottjer SW, Miesner EA, Arnold AP. Forebrain lesions disrupt development but not maintenance of song in passerine birds. Science. 1984;224:901–903. - PubMed

Publication types

LinkOut - more resources