. 2014 Apr 2;82(1):235-48.
doi: 10.1016/j.neuron.2014.02.006.

State dependence of noise correlations in macaque primary visual cortex

Affiliations

State dependence of noise correlations in macaque primary visual cortex

Alexander S Ecker et al. Neuron. .

Abstract

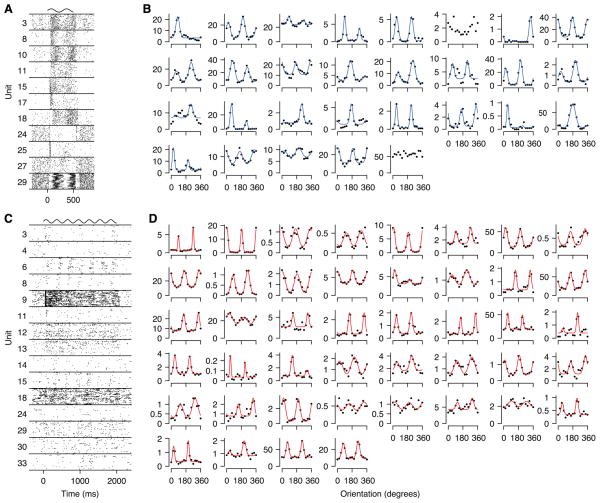
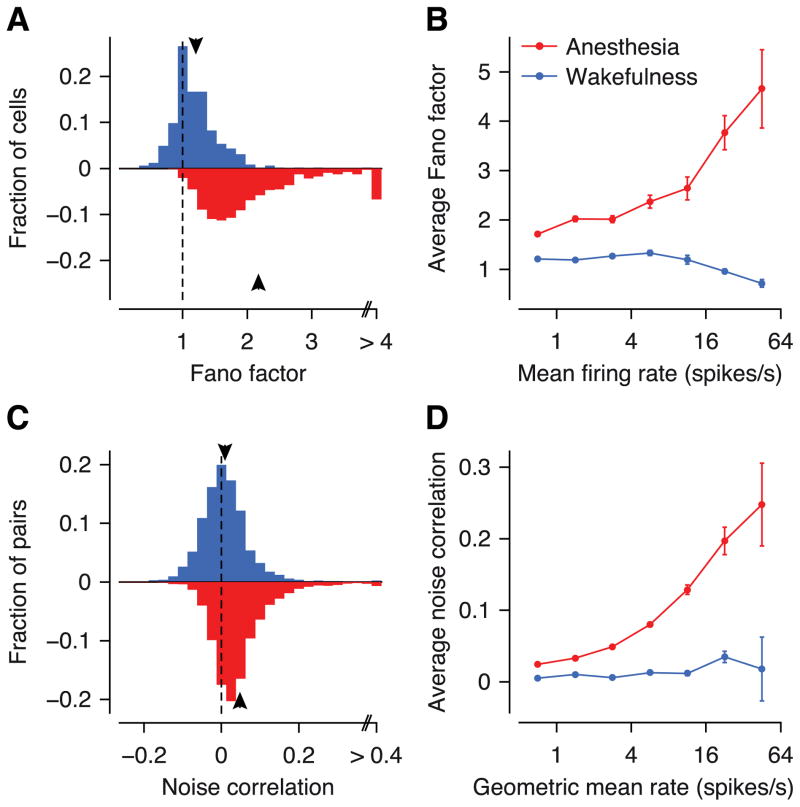
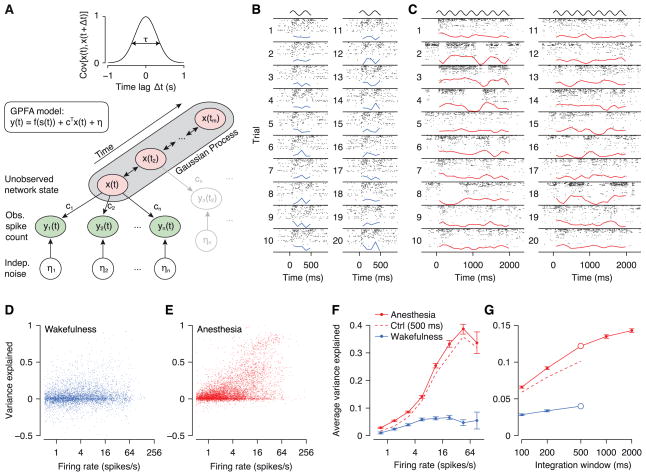
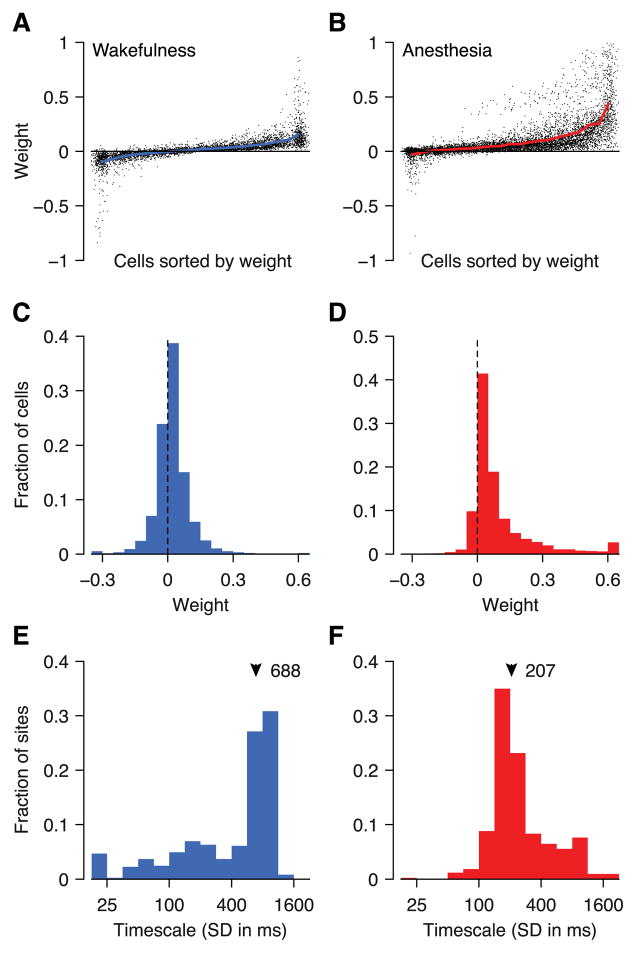
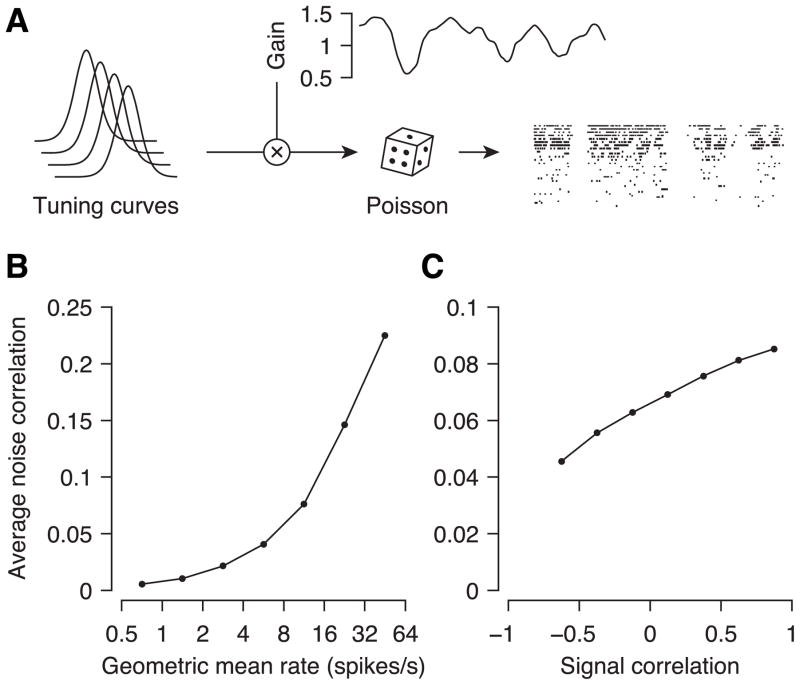
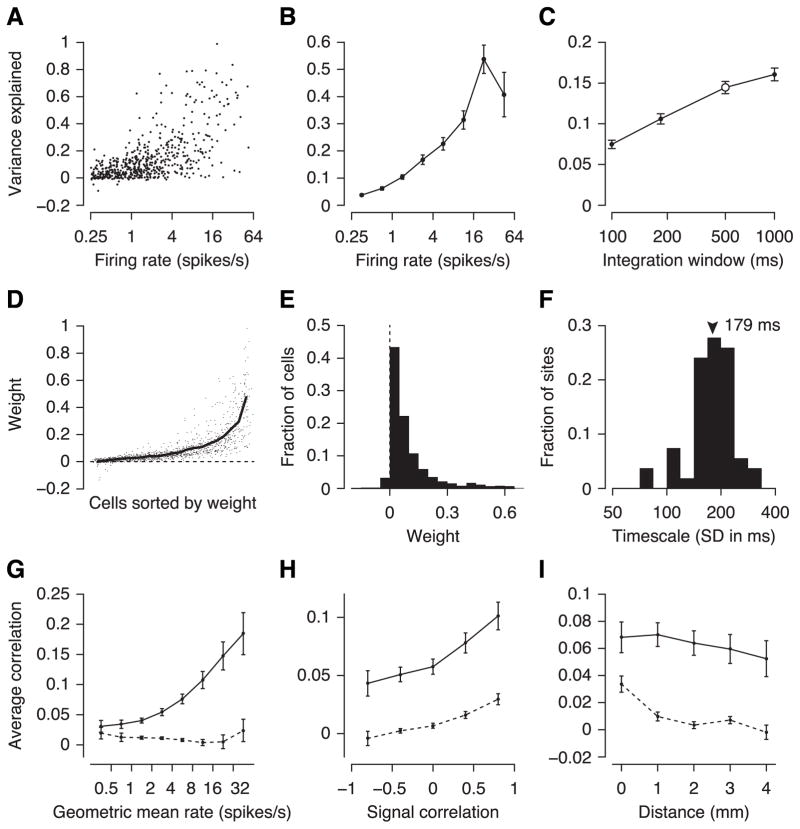
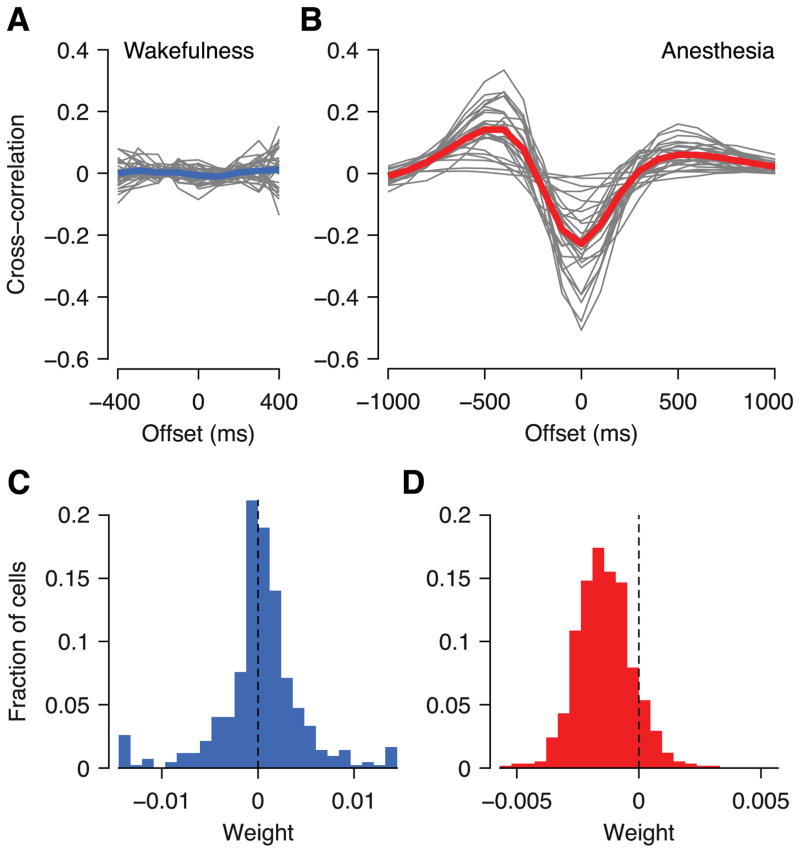
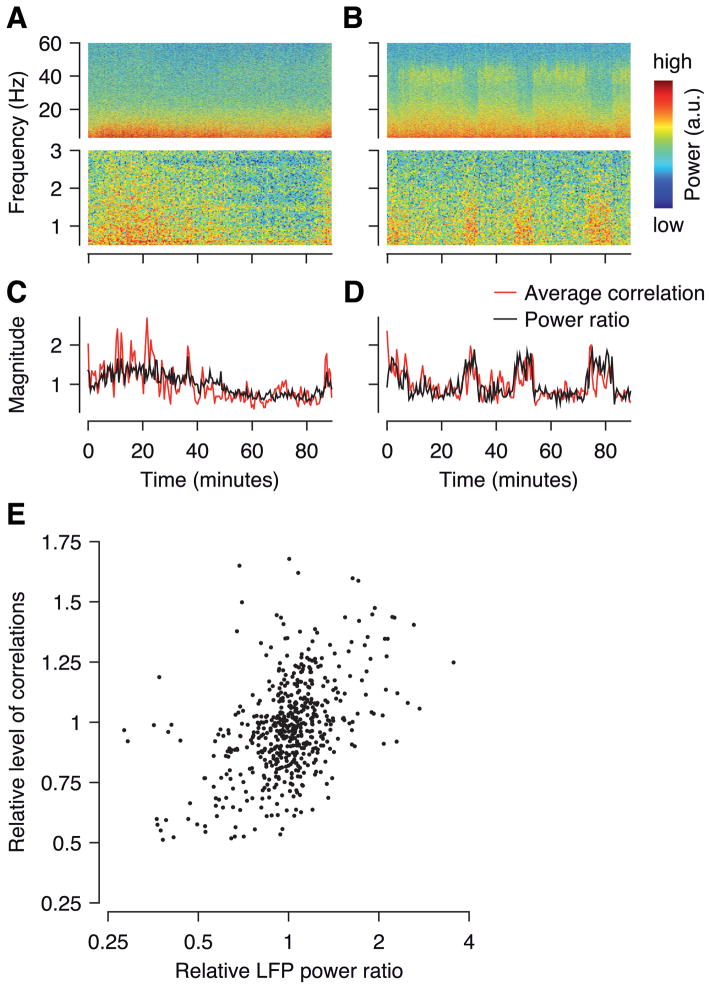
Shared, trial-to-trial variability in neuronal populations has a strong impact on the accuracy of information processing in the brain. Estimates of the level of such noise correlations are diverse, ranging from 0.01 to 0.4, with little consensus on which factors account for these differences. Here we addressed one important factor that varied across studies, asking how anesthesia affects the population activity structure in macaque primary visual cortex. We found that under opioid anesthesia, activity was dominated by strong coordinated fluctuations on a timescale of 1-2 Hz, which were mostly absent in awake, fixating monkeys. Accounting for these global fluctuations markedly reduced correlations under anesthesia, matching those observed during wakefulness and reconciling earlier studies conducted under anesthesia and in awake animals. Our results show that internal signals, such as brain state transitions under anesthesia, can induce noise correlations but can also be estimated and accounted for based on neuronal population activity.


Figures

Figure 1
Figure 1. Recordings of population activity in V1
A, Spike rasters for a subset of the neurons recorded in one example session during wakefulness. The sinusoid at the top indicates the stimulus duration (500 ms) and its temporal frequency. Numbers: neuron numbers in B, counted from left to right, top to bottom. B, Tuning curves for all neurons in the same session as in A. Solid lines: least squares fit, shown only for cells significantly tuned to orientation (27/29 cells at p < 0.01, non-corrected). C, Spike rasters during anesthesia (as in A). D, Tuning curves (as in B; all 44 neurons significantly tuned at p < 0.001).
Figure 2
Figure 2. Fano factors and noise correlations during wakefulness (blue) and anesthesia (red)
A, Distribution of Fano factors. Arrows: means. B, Dependence of Fano factors on firing rates. Error bars: SEM. C, Distribution of noise correlations. D, Dependence of noise correlations on geometric mean firing rates.
Figure 3
Figure 3. Gaussian Process Factor Analysis (GPFA)
A, Schematic of the GPFA model. Spike count variability is generated by an unobserved (one-dimensional) network state (x) linearly driving neural activity (weights c) plus independent noise (η). The network state evolves smoothly in time, which is modeled by a Gaussian Process with temporal covariance shown at the top (correlation timescale τ is learned from the data). B, Population rasters for an example session recorded in an awake animal. Each numbered row shows the rasters of all recorded neurons during a single trial. All trials were under identical stimulus conditions (500 ms drifting grating, indicated by sine wave at the top). Blue line: estimate of the network state (x). The visible rate modulations are locked to the phase of the stimulus, but not to the estimated network state (which in this case had very little explanatory power). C, As in B, but under anesthesia. The estimated network state captures the population rate dynamics very well (see e.g. trials 1–4), but is unrelated to the stimulus (stimulus duration: 2 s). D, Scatter plot of variance explained (VE) vs. firing rate during wakefulness. Each dot is a single neuron under one stimulus condition. VE is computed in 500-ms windows. E, As in D, but under anesthesia. F, Binned and averaged representation of D and E. Error bars: SEM. Dashed lines: model fit on anesthetized data using only the first 500 ms of each trial for better comparison with awake data (error bars omitted for clarity; they were comparable to those for the solid red line). G, Average VE versus size of integration window. Open circles: 500 ms window, which was used for panels D–F. Dashed line: control analysis as in panel F.
Figure 4
Figure 4. GPFA model parameters
Distribution of weights (variable c, Eq. 1) during wakefulness (A, C) and under anesthesia (B, D). Timescale of network state dynamics during wakefulness (E) and under anesthesia (F). The timescale is the parameter (τ) in the squared-exponential temporal correlation function of the latent variable (x) in the GPFA model.
Figure 5
Figure 5. Accounting for network state reduces noise correlations under anesthesia
Raw (solid lines) and residual (after accounting for network state; dashed lines) noise correlations during wakefulness (blue) and under anesthesia (red). Dependence on firing rates (A), signal correlations (B) and distance between cells (C). Raw correlations in panel A are as in Figure 2D, except that here the model is fit for each condition separately. Error bars: SEM.
Figure 6
Figure 6. Model of state fluctuations as common fluctuations in excitability
A, Illustration of the model. Cells have tuning curves with identical shapes and regularly spaced preferred orientations. Each cell’s firing rate is given by the tuning curve multiplied by the common gain, which changes slowly as in our data. Spikes are generated by independent inhomogeneous Poisson processes with the given rates. The resulting noise correlations increase with firing rates (B) and signal correlations (C), as in the data.
Figure 7
Figure 7. GPFA model during spontaneous activity under anesthesia
A–B, Variance explained (VE) versus firing rates (as in Figure 3D–F). C, VE vs. integration time (as in Figure 3G). D–E, Distribution of weights (as in Figure 4B, D). F, Distribution of timescales (as in Figure 4G). G–I, Residual correlations versus firing rate, signal correlation and distance, respectively (as in Figure 5A–C).
Figure 8
Figure 8. Local field potential is correlated with inferred network state and predicts trial-to-trial variability under anesthesia but not during wakefulness
A, Cross-correlation between low-frequency LFP (0.5–10 Hz) and network state inferred by GPFA model during wakefulness. Gray lines: individual sessions; blue line: average across all sessions. B, As in A, but under anesthesia. C, Distribution of LFP weights in Generalized Linear Model taking stimulus and LFP into account; during wakefulness. D, As in C, but under anesthesia.
Figure 9
Figure 9. LFP power ratio correlates with overall level of noise correlations
A–B, Spectrogram of LFP over the course of two example recordings (~90 minutes). C–D, LFP power ratio (black line, power in 0.5–2 Hz band divided by that in the gamma band, 30–70 Hz) and average level of correlations (red line, variance of the network state inferred by GPFA) for the same sessions. Both quantities are normalized by the session average. E, Population analysis. LFP power ratio versus overall correlation (variance of network state inferred by GPFA) in 20 separate blocks per recording (27 recordings in total, i.e. n = 540). Both quantities normalized by the session average for each session. One outlier cropped for clarity.

References

    1. Abbott LF, Dayan P. The Effect of Correlated Variability on the Accuracy of a Population Code. Neural Computation. 1999;11(1):91–101. - PubMed
    1. Angel A. Central Neuronal Pathways and the Process of Anaesthesia. British Journal of Anaesthesia. 1993;71(1):148–163. - PubMed
    1. Averbeck BB, Latham PE, Pouget A. Neural correlations, population coding and computation. Nat Rev Neurosci. 2006;7(5):358–366. - PubMed
    1. Bach M, Krüger J. Correlated neuronal variability in monkey visual cortex revealed by a multi-microelectrode. Experimental Brain Research. 1986;61(3):451–456. - PubMed
    1. Bair W, Zohary E, Newsome WT. Correlated Firing in Macaque Visual Area MT: Time Scales and Relationship to Behavior. The Journal of Neuroscience. 2001;21(5):1676–1697. - PMC - PubMed

Publication types

Substances