Review
. 2014 Jun;39(11):1784-95.
doi: 10.1111/ejn.12558. Epub 2014 Apr 3.

Olfactory coding in the insect brain: data and conjectures

Affiliations
Review

Olfactory coding in the insect brain: data and conjectures

C Giovanni Galizia. Eur J Neurosci. 2014 Jun.

Abstract

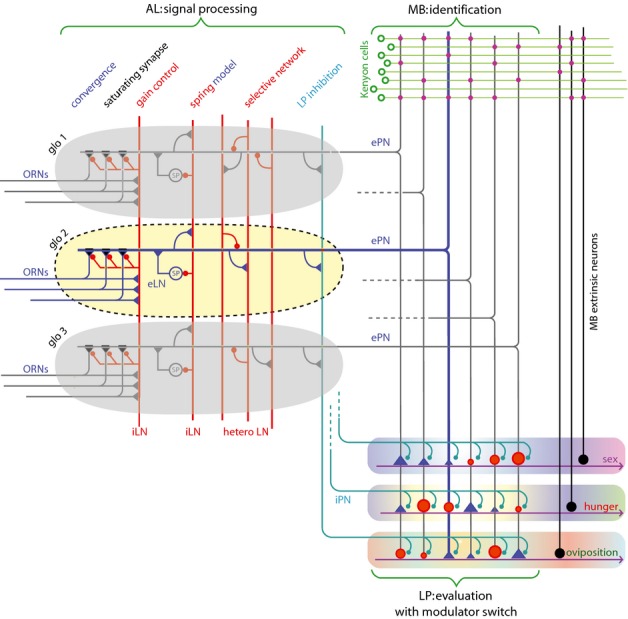
Much progress has been made recently in understanding how olfactory coding works in insect brains. Here, I propose a wiring diagram for the major steps from the first processing network (the antennal lobe) to behavioral readout. I argue that the sequence of lateral inhibition in the antennal lobe, non-linear synapses, threshold-regulating gated spring network, selective lateral inhibitory networks across glomeruli, and feedforward inhibition to the lateral protocerebrum cover most of the experimental results from different research groups and model species. I propose that the main difference between mushroom bodies and the lateral protocerebrum is not about learned vs. innate behavior. Rather, mushroom bodies perform odor identification, whereas the lateral protocerebrum performs odor evaluation (both learned and innate). I discuss the concepts of labeled line and combinatorial coding and postulate that, under restrictive experimental conditions, these networks lead to an apparent existence of 'labeled line' coding for special odors. Modulatory networks are proposed as switches between different evaluating systems in the lateral protocerebrum. A review of experimental data and theoretical conjectures both contribute to this synthesis, creating new hypotheses for future research.

Keywords: antennal lobe; mushroom bodies; neural networks; sensory coding.


Figures

Figure 1
Figure 1
The insect olfactory system. Schematic of the insect olfactory system, with the AL (signal processing), MBs (odor identification) and LP (odor evaluation). Three glomeruli are shown as examples for the AL, with only one glomerulus highlighted for clarity. Many ORNs converge on few PNs (ePNs; convergence). The ORN–PN synapse has a saturating response property (saturating synapse). ORNs also feed on a network of inhibitory interglomerular LNs (iLNs) that project back onto the ORN–PN synapse (gain control). An interglomerular network of LNs, probably including spontaneously active (SP) excitatory LNs (eLNs) regulate PN baseline activity (spring model). A heterogeneous network of LNs, some of which are peptidergic, creates selective interglomerular inhibition (selective network). Multiglomerular inhibitory PNs project to the LP (LP inhibition). Uniglomerular ePNs project to both the MB for odor identification and learning, and the LP for odor evaluation. In the MB, they synapse onto a large population of intrinsic KCs creating a connectivity matrix. The resulting activity pattern is read out by MB extrinsic neurons, which in turn project to the LP. In the LP, odors are evaluated using unidimensional evaluators, with input from ‘positive’ neurons being excitatory and weighted, and input from ‘negative’ neurons being inhibitory and weighted (the mechanisms here probably involve further neurons, e.g. to create inhibitory input; driving strength is indicated by the size of the symbol used). Different evaluators are present in the LP, e.g. for sexual odors (sex), food-related odors (hunger), or suitable oviposition sites (oviposition), and each glomerulus plays a different role in each evaluator. The brain switches between these readout systems using modulatory transmitters or peptides. These modulators may simultaneously affect (or select) appropriate selective LN networks in the AL (not shown). Excitatory connections are symbolised by blue triangles, inhibitory connections by red circles.
Figure 2
Figure 2
Convergence of ORNs onto PNs. Many ORNs converge onto few PNs. In this illustration, every pixel of the photograph corresponds to one ORN family. An original image (upper row, center) is shown in a low-noise (upper row, left) or a high-noise (upper row, right) situation. In this illustration, Gaussian noise has been added to the image, simulating noisy receptor cells. When 100 cells are averaged for each pixel, the image quality is considerably increased (bottom row). In honeybees, receptor cell types have populations of 400 cells each, on average. Noise goes down with the square root of the number of averaged ORNs (see text).
Figure 3
Figure 3
Saturating synapse. Using the same analogy between ORNs and pixels in a photograph as in Fig. 2, the effect of a saturating ORN–PN synapse is shown. The original image (upper left) is transformed via a saturating synapse (response curve, upper row, center) into an image where the darker areas (weak sensory input) are enhanced (more visible). The bottom row shows the corresponding histograms – a dark image (histogram with most values to the left) is transformed into a balanced image (histogram with values across the dynamic range). A saturating synapse ensures reliable responses also to weak sensory input. See text for the saturating function used.
Figure 4
Figure 4
Gain control. Using the same analogy of a photograph as in Fig. 2, here I add a gain control network that takes the overall activity into account. Thus, dark images are transformed into brighter images (upper row), whereas bright images are darkened (lower row). In both cases, the result is a better exploitation of the dynamic range of the system, thus improving the possibilities for downstream networks (notably the MBs) to extract the relevant activity pattern. As the global input across ORNs increases, the saturating synapse response curve is shifted to the right due to inhibitory interglomerular LN presynaptic inhibition (see text for the functions used here).
Figure 5
Figure 5
Spring model. When the PNs are kept near to threshold, they become more sensitive for weak inputs. In this visualisation, a weak image was used as fictive input, and an activity threshold was assumed. When a pixel value was above threshold, it was clipped to white, whereas below threshold it was clipped to black. Adding a weak noisy signal still keeps most pixels below threshold (A; top – visualisation of the picture; bottom – an example with a sine wave as signal; here, the threshold is the blue line, activity above threshold is given in red and the original sine wave without noise is shown in yellow). Adding more noise allows visualisation of the weak picture (B, upper; in the lower sine wave case the periodicity is now visible in the suprathreshold pixels), whereas adding too much noise removes the picture information (C; with close to random spatial distribution of white and black pixels). This mechanism has been described as stochastic resonance for visual perception. The figure was inspired by Fig. 1 in Simonotto et al. (1997). Although the pictures in this visualisation are static, adding an appropriate amount of noise (i.e. keeping the PNs close to threshold) is most effective in a dynamic situation. For a dynamic version of this phenomenon see the supplementary movies in an article about excitatory LNs (Shang et al., 2007).
Figure 6
Figure 6
Selective networks. Effect of heterogeneous inhibitory interglomerular LNs on signal processing. In the images here, I simulate the situation whereby adjacent pixels in an image would correspond to ORNs with overlapping response profiles. The closer that two pixels are in space (on the photograph), the more overlapping are the response profiles of the ORNs that they symbolise. Under these conditions, a lateral connectivity scheme whereby a glomerulus inhibits other glomeruli with a strength scaled to their response overlap corresponds to an unsharp-mask filter in image processing. In the figure, an original image (A) has been unsharp masked using increasing radii (from B to D), but with equal strength. Local details are best captured in B, global contrasts are strengthened in D. This selective lateral inhibition increases local contrast in sensory processing.
Figure 7
Figure 7
Learning in the AL network. Model of associative plasticity in the AL after differential conditioning. (A) After differential conditioning, glomerular responses increase in those glomeruli responding only to the positively reinforced odor (‘A glomerulus’), or those that do not respond to any of the trained odors (‘none glomerulus’), decrease in glomeruli that respond to the positive and negative odor, and remain unchanged if they respond only to the negative odor. (B) Two synaptic learning rules explain the data – (1) long-term potentiation (LTP) at the excitatory ORN–PN synapse under the control of the unconditioned stimulus (US; reward) as a positive reinforcer; coincident activity (red) at the ORN–PN synapse will strengthen synapses (arrow up) only if the US is present; and (2) reinforcer-independent Hebbian LTP/long-term depression (LTD) at the inhibitory LN–ORN synapse. Coincident presynaptic and postsynaptic activity (red) leads to LTP. No activity (blue) in the postsynaptic ORN and activity (red) in the presynaptic LN leads to LTD. (C) Model of learning-induced plasticity in the AL. The learning rules shown in B create the observations reported in A. See Rath et al. (2011) for details.

Similar articles

Cited by

References

    1. Ai M, Min S, Grosjean Y, Leblanc C, Bell R, Benton R. Suh GS. Acid sensing by the Drosophila olfactory system. Nature. 2010;468:691–695. - PMC - PubMed
    1. Bargmann CI. Beyond the connectome: how neuromodulators shape neural circuits. BioEssays. 2012;34:458–465. - PubMed
    1. Bargmann CI. Kaplan JM. Signal transduction in the Caenorhabditis elegans nervous system. Annu. Rev. Neurosci. 1998;21:279–308. - PubMed
    1. Barrozo RB, Gadenne C. Anton S. Switching attraction to inhibition: mating-induced reversed role of sex pheromone in an insect. J. Exp. Biol. 2010;213:2933–2939. - PubMed
    1. Benton R, Vannice KS, Gomez-Diaz C. Vosshall LB. Variant ionotropic glutamate receptors as chemosensory receptors in Drosophila. Cell. 2009;136:149–162. - PMC - PubMed

LinkOut - more resources