

Evaluation of molecular profiles in calcineurin inhibitor toxicity post-kidney transplant: input to chronic allograft dysfunction
- PMID: 24698514
- PMCID: PMC4377109
- DOI: 10.1111/ajt.12696
Evaluation of molecular profiles in calcineurin inhibitor toxicity post-kidney transplant: input to chronic allograft dysfunction
Abstract
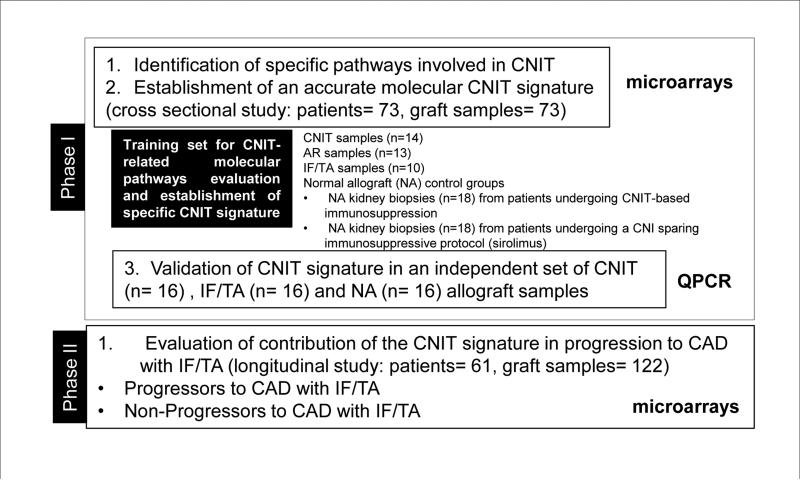
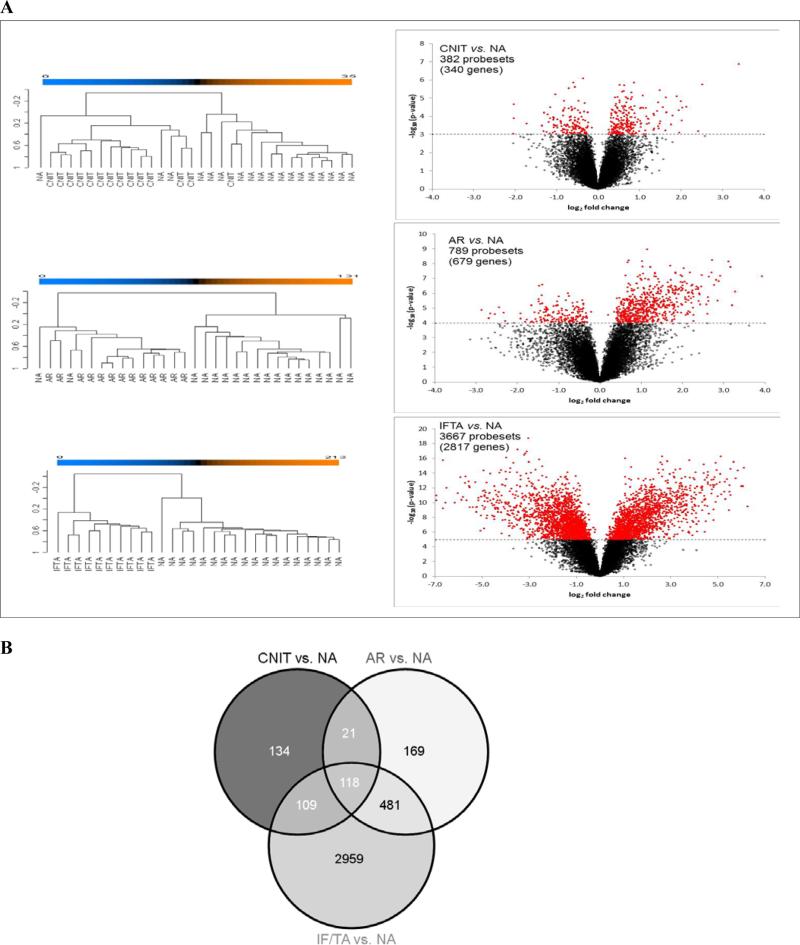
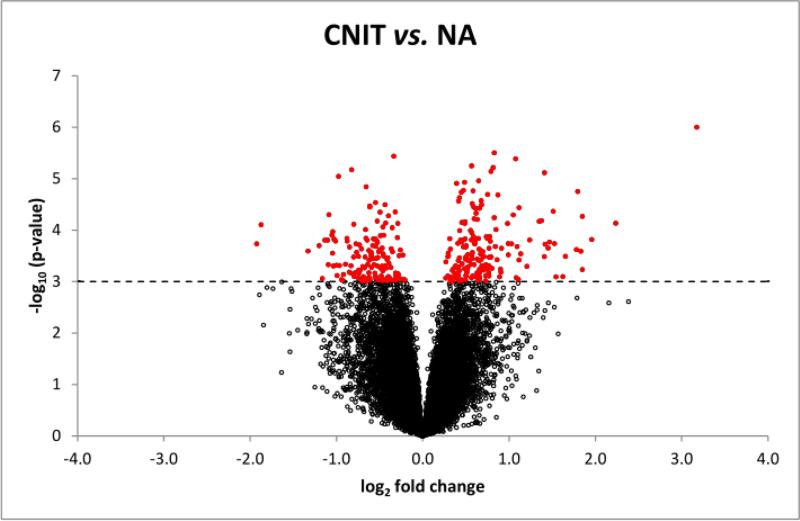
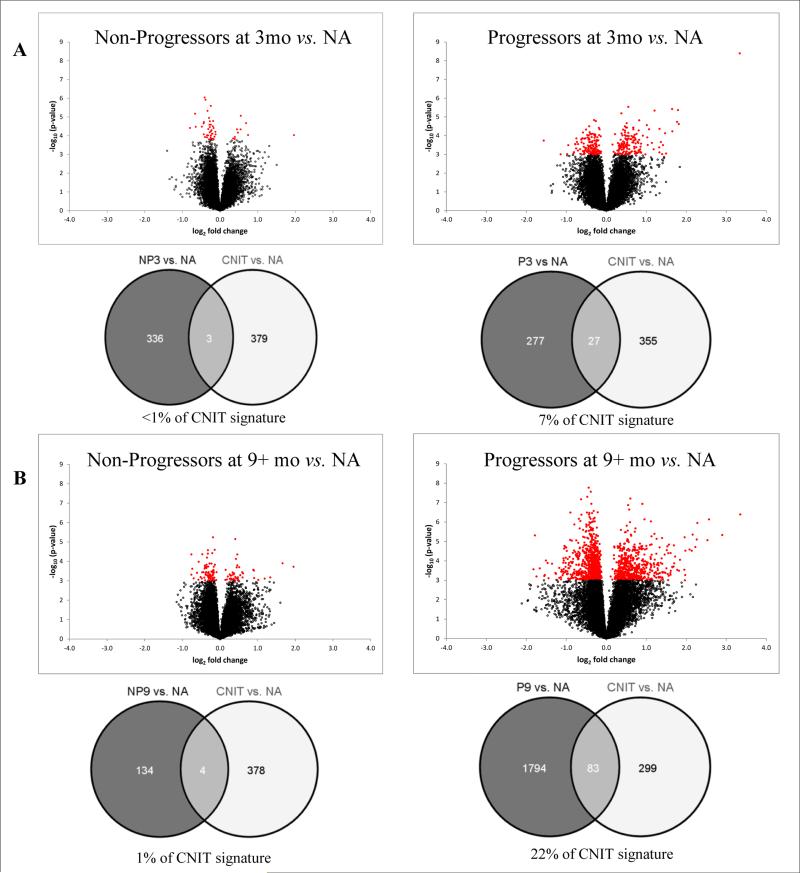
The molecular basis of calcineurin inhibitor toxicity (CNIT) in kidney transplantation (KT) and its contribution to chronic allograft dysfunction (CAD) with interstitial fibrosis (IF) and tubular atrophy (TA) were evaluated by: (1) identifying specific CNIT molecular pathways that associate with allograft injury (cross-sectional study) and (2) assessing the contribution of the identified CNIT signature in the progression to CAD with IF/TA (longitudinal study). Kidney biopsies from well-selected transplant recipients with histological diagnosis of CNIT (n = 14), acute rejection (n = 13) and CAD with IF/TA (n = 10) were evaluated. Normal allografts (n = 18) were used as controls. To test CNIT contribution to CAD progression, an independent set of biopsies (n = 122) from 61 KT patients collected at 3 and ~12 months post-KT (range = 9-18) were evaluated. Patients were classified based on 2-year post-KT graft function and histological findings as progressors (n = 30) or nonprogressors to CAD (n = 31). Molecular signatures characterizing CNIT samples were identified. Patients classified as progressors showed an overlap of 7% and 22% with the CNIT signature at 3 and at ~12 months post-KT, respectively, while the overlap was <1% and 1% in nonprogressor patients, showing CNIT at the molecular level as a nonimmunological factor involved in the progression to CAD.
Keywords: Biomarkers; calcineurin inhibitors; kidney transplant; toxicity.
© Copyright 2014 The American Society of Transplantation and the American Society of Transplant Surgeons.
Figures
Similar articles
-
An Integrated Transcriptomic Approach to Identify Molecular Markers of Calcineurin Inhibitor Nephrotoxicity in Pediatric Kidney Transplant Recipients.Int J Mol Sci. 2021 May 21;22(11):5414. doi: 10.3390/ijms22115414. Int J Mol Sci. 2021. PMID: 34063776 Free PMC article.
-
Renin-Angiotensin System Blockage and Avoiding High Doses of Calcineurin Inhibitors Prevent Interstitial Fibrosis and Tubular Atrophy in Kidney Transplant Recipients.Exp Clin Transplant. 2017 Feb;15(Suppl 1):32-36. doi: 10.6002/ect.mesot2016.O19. Exp Clin Transplant. 2017. PMID: 28260428
-
Molecular classifiers for acute kidney transplant rejection in peripheral blood by whole genome gene expression profiling.Am J Transplant. 2014 May;14(5):1164-72. doi: 10.1111/ajt.12671. Epub 2014 Apr 11. Am J Transplant. 2014. PMID: 24725967 Free PMC article. Clinical Trial.
-
Chronic allograft dysfunction: major contributing factors.Iran J Kidney Dis. 2012 Mar;6(2):88-93. Iran J Kidney Dis. 2012. PMID: 22388603 Review.
-
Recent Advances on Biomarkers of Early and Late Kidney Graft Dysfunction.Int J Mol Sci. 2020 Jul 29;21(15):5404. doi: 10.3390/ijms21155404. Int J Mol Sci. 2020. PMID: 32751357 Free PMC article. Review.
Cited by
-
Methods to increase reproducibility in differential gene expression via meta-analysis.Nucleic Acids Res. 2017 Jan 9;45(1):e1. doi: 10.1093/nar/gkw797. Epub 2016 Sep 14. Nucleic Acids Res. 2017. PMID: 27634930 Free PMC article.
-
The cannabinoid receptor 1 is involved in renal fibrosis during chronic allograft dysfunction: Proof of concept.J Cell Mol Med. 2019 Nov;23(11):7279-7288. doi: 10.1111/jcmm.14570. Epub 2019 Aug 30. J Cell Mol Med. 2019. PMID: 31469511 Free PMC article.
-
Zoledronate dysregulates fatty acid metabolism in renal tubular epithelial cells to induce nephrotoxicity.Arch Toxicol. 2018 Jan;92(1):469-485. doi: 10.1007/s00204-017-2048-0. Epub 2017 Sep 4. Arch Toxicol. 2018. PMID: 28871336 Free PMC article.
-
Cannabinoid Receptor 1 Inhibition in Chronic Kidney Disease: A New Therapeutic Toolbox.Front Endocrinol (Lausanne). 2021 Jul 7;12:720734. doi: 10.3389/fendo.2021.720734. eCollection 2021. Front Endocrinol (Lausanne). 2021. PMID: 34305821 Free PMC article. Review.
-
An Integrated Transcriptomic Approach to Identify Molecular Markers of Calcineurin Inhibitor Nephrotoxicity in Pediatric Kidney Transplant Recipients.Int J Mol Sci. 2021 May 21;22(11):5414. doi: 10.3390/ijms22115414. Int J Mol Sci. 2021. PMID: 34063776 Free PMC article.
References
-
- Nankivell BJ, Kuypers DR. Diagnosis and prevention of chronic kidney allograft loss. Lancet. 2011;378:1428–1437. - PubMed
-
- Arias M, Serón D, Moreso F, Bestard O, Praga M. Chronic renal allograft damage: existing challenges. Transplantation. 2011;91:S4–25. - PubMed
-
- Pascual J, Pérez-Sáez MJ, Mir M, Crespo M. Chronic renal allograft injury: early detection, accurate diagnosis and management. Transplant Rev (Orlando) 2012;26:280–290. - PubMed
-
- Merion RM, Ashby VB, Wolfe RA, Distant DA, Hulbert-Shearon TE, Metzger RA, et al. Deceased-donor characteristics and the survival benefit of kidney transplantation. JAMA. 2005;294(21):2726–33. - PubMed
-
- Rao PS, Ojo A. The alphabet soup of kidney transplantation: SCD, DCD, ECD-fundamentals for the practicing nephrologist. Clin J Am Soc Nephrol. 2009;4:1827–1831. - PubMed
Publication types
MeSH terms
Substances
Grants and funding
LinkOut - more resources
Full Text Sources
Other Literature Sources
Medical
Molecular Biology Databases
Miscellaneous
