. 2014 Sep:53:67-77.
doi: 10.1016/j.jaut.2014.02.011. Epub 2014 Mar 31.

Longitudinally extensive NMO spinal cord pathology produced by passive transfer of NMO-IgG in mice lacking complement inhibitor CD59

Affiliations

Longitudinally extensive NMO spinal cord pathology produced by passive transfer of NMO-IgG in mice lacking complement inhibitor CD59

Hua Zhang et al. J Autoimmun. 2014 Sep.

Abstract

Spinal cord pathology with inflammatory, demyelinating lesions spanning three or more vertebral segments is a characteristic feature of neuromyelitis optica (NMO). NMO pathogenesis is thought to involve binding of immunoglobulin G anti-aquaporin-4 autoantibodies (NMO-IgG) to astrocytes, causing complement-dependent cytotoxicity (CDC) and secondary inflammation, demyelination and neuron loss. We investigated the involvement of CD59, a glycophosphoinositol (GPI)-anchored membrane protein on astrocytes that inhibits formation of the terminal C5b-9 membrane attack complex. CD59 inhibition by a neutralizing monoclonal antibody greatly increased NMO-IgG-dependent CDC in murine astrocyte cultures and ex vivo spinal cord slice cultures. Greatly increased NMO pathology was also found in spinal cord slice cultures from CD59 knockout mice, and in vivo following intracerebral injection of NMO-IgG and human complement. Intrathecal injection (at L5-L6) of small amounts of NMO-IgG and human complement in CD59-deficient mice produced robust, longitudinally extensive white matter lesions in lumbar spinal cord. Pathology was most severe at day 2 after injection, showing loss of AQP4 and GFAP, C5b-9 deposition, microglial activation, granulocyte infiltration, and demyelination. Hind limb motor function was remarkably impaired as well. There was partial remyelination and recovery of motor function by day 5. Our results implicate CD59 as an important modulator of the immune response in NMO, and provide a novel animal model of NMO that closely recapitulates human NMO pathology. Up-regulation of CD59 on astrocytes may have therapeutic benefit in NMO.

Keywords: Aquaporin-4; Astrocyte; Complement-dependent cytotoxicity; Demyelination; NMO.


Figures

Fig. 1
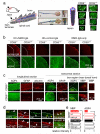
Fig. 1. CD59 expression in mice
a. CD59 and AQP4 immunofluorescence in brain cortex, optic nerve and spinal cord of CD59+/+ and CD59−/− mice. GM grey matter, WM white matter. CD59 antibody isotype control shown on the right. b. AQP4, MBP and CD59 immunofluorescence in spinal cord white matter. c. High magnification of spinal cord white matter and grey matter showing CD59 immunostaining with different cell markers - AQP4, MBP, Tuj1 and Iba1. Arrows indicates co-expression, arrowheads astrocyte end-feet, V vessel. d. CD59 and AQP4 immunofluorescence in kidney and skeletal muscle of CD59+/+ and CD59−/− mice. e. CD59, AQP4 and β-actin immunoblot of brain and peripheral tissue homogenates.
Fig. 2
Fig. 2. CD59 neutralization or deletion protects against NMO-IgG- and complement-dependent cytotoxicity in astrocyte cultures
a. AQP4, CD59 and CD55 immunofluorescence in primary astrocyte cultures from CD59+/+ and CD59−/− mice. Insert shows CD55 staining of mouse lung as positive control. b. NMO-IgG binding to astrocyte cultures shown as normalized ratio of NMO-IgG to AQP4 fluorescence (‘relative binding’), as a function of NMO-IgG concentration (S.E., n=6 ). Differences not significant. c. CDC (by Alamar blue assay) in cultures incubated with 5% (left) or 2% (right) human complement and NMO-IgG (0-20 μg/ml) (S.E., n=6, * P < 0.05, comparing with CD59+/+ astrocytes). d. (top) Experimental protocol. MAC, membrane attack complex. (middle) CDC in CD59+/+ astrocyte cultures without and after treatment mCD59a neutralizing Ab (CD59 Ab, 10 μg/mL, S.E., n=6, # P < 0.05, comparing with the untreated group) or PI-PLC (0.5 U/mL) (S.E., n=6, * P < 0.05, comparing with the untreated group). (bottom) CDC in control and PI-PLC-treated CD59−/− astrocyte cultures (S.E., n=6).
Fig. 3
Fig. 3. CD59 neutralization or deletion protects against NMO-IgG-dependent CDC and demyelination in ex vivo spinal cord slice cultures
a. Vibratome-cut spinal cord slices from CD59+/+ and CD59−/− mice were cultured on a porous support for 7 days, followed by addition of NMO-IgG (5 μg/mL) and submaximal human complement (5%), CD59 Ab (10 μg/mL) or PI-PLC (0.5 U/mL). (left) AQP4, GFAP and MBP immunofluorescence of spinal cord slices. (right) Summary of pathology scores (S.E., 5 slices per condition, * P < 0.001). b. (left) C5b-9 immunofluorescence after 1, 2.5 and 6 h incubation with human complement (5 %) and NMO-IgG (10 μg/mL), with or without CD59 Ab (10 μg/mL) or PI-PLC (0.5 U/mL). (right) C9neo / AQP4 immunofluorescence ratios (S.E., 6 slices per condition, * P < 0.01).
Fig. 4
Fig. 4. Greatly increased NMO pathology in CD59−/− mice following intracerebral infusion of NMO-IgG and human complement
a. Diagram of the mini-pump infusion model. b. NMO-IgG (‘human IgG’ using anti-human secondary antibody), AQP4 and MBP immunofluorescence at 3 days after continuous infusion of NMO-IgG and complement in CD59+/+ and CD59−/− mice. White line indicates the needle track and dashed line the lesion area (representative of 6 mice per group). c. Higher magnification showing AQP4, MBP, CD45 and Iba1 immunofluorescence in the lesion and in contralateral brain. Dashed line indicates the boundary of AQP4 loss. L: lesion area. d. Summary of areas of AQP4 and MBP loss, and relative MBP vs. AQP4 loss (S.E., n=6, * P < 0.05).
Fig. 5
Fig. 5. Longitudinally extensive white-matter lesions in CD59−/− mice after intrathecal injection of NMO-IgG and human complement
a. (left) Diagram of the intrathecal injection model: 10 μg of recombinant NMO-IgG (or control IgG) and 5 μL human complement in total volume of 10 μL was injected. (middle) Evan’s blue dye diffusion at 1 and 24 h after intrathecal injection at L6 (representative of 5 mice per time point). (right) Diagram of spinal cord showing lesion volume along with transverse sections (arrows indicate lesion). Scale bar: 200 μm. Representative of 3 mice per group. b. Human IgG and AQP4 immunofluorescence in transverse spinal cord sections of CD59+/+ and CD59−/− mice treated as indicated. Dashed line indicates the edge of white matter, solid line the interface between white and grey matter, and arrow the lesion. c. AQP4, GFAP, and albumin immunofluorescence in longitudinal (left) and transverse (right) spinal cord sections in CD59+/+ and CD59−/− mice at 2 days after receiving NMO-IgG and human complement. Dashed line indicates the edge of white matter and arrow the lesion. High magnification of boxed regions shown at the right. Representative of 5 mice per group. d. High magnification showing AQP4, GFAP, MBP, C9neo, human IgG, cleaved caspase3/7 (apoptotic cell marker), Siglec-F (eosinophil marker), Ly6G (neutrophil marker) and Iba1 (macrophage/microglia marker) immunofluorescence. WM: white matter. Dashed line indicates the edge of white matter, solid line interface between white and grey matter, white arrow the lesion, white arrowhead infiltrating cells, and yellow arrow apoptotic motor neurons. e. AQP4 and MBP immunofluorescence in L5 spinal cord sections, showing relative intensity normalized to control CD59+/+ or CD59 −/− sections. For each mouse, 3 different sections were averaged (S.E., n=5-6 mice, * P < 0.05).
Fig. 6
Fig. 6. Progression of NMO pathology in CD59−/− mice following intrathecal injection of NMOIgG
a. Hind paw stride length at day 2 (S.E., 6-8 mice per group, * P < 0.01). b. Motor scores in CD59+/+ and CD59−/− mice, treated with control or NMO-IgG and human complement (S.E., 6-8 mice per group, * P < 0.01). c. Motor scores in CD59−/− mice receiving two NMO sera (or control serum) and human complement at 3 days (S.E., n=4, * P < 0.01). d. AQP4, GFAP, MBP, Iba1 and Ly6G immunofluorescence at 1 day after intrathecal injection (representative of 5 mice). Dashed line indicates the edge of white matter, solid line the interface between white and grey matter, white arrowhead infiltrating cells. e. AQP4, GFAP, MBP and Iba1 immunofluorescence in white and grey matter at 5 days after intrathecal injection. Solid line indicates interface between white and grey matter, yellow arrow reactive astrocytes, white arrowhead aggregated microglia/macrophage, white arrow the lesion (representative of 5 mice per group). f. AQP4 and MBP immunofluorence in L5 spinal cord sections at different days after intrathecal injection, showing relative intensity normalized to control CD59+/+ or CD59 −/− sections. For each mouse, 3 different sections were averaged (S.E., n=5-6 mice, * P < 0.05). g. (left) Olig2 and MBP immunofluorescence in white matter at day 5. White arrow indicates the lesion. (right) Olig2-positive cells in each group (S.E., 5 mice studied with 5 contiguous sections analyzed per mouse, * P < 0.01).
Fig. 7
Fig. 7. CD59 up-regulation in CD59+/+ mice following induction of NMO pathology
a. (left) Expression of CD59 and AQP4 at the L4 level at 2 days after intrathecal injection of control or NMOIgG and human complement, showing micrographs from two mice. CD59−/− mouse shown as control (representative of 5 mice per group). b. CD59 and β-actin immunoblot of spinal cord homogenates of three CD59+/+ mice. Data representative of 3 sets of experiments (S.E. n=3, * P < 0.05). c. (left) Diagram of brain infusion model. (right) CD59 and AQP4 immunofluorescence in boxed regions. Dashed line indicates the edge of AQP4 loss, L lesion area (representative of 5 mice per group).

Similar articles

Cited by

References

    1. Jarius S, Paul F, Franciotta D, Waters P, Zipp F, Hohlfeld R, et al. Mechanisms of disease: aquaporin-4 antibodies in neuromyelitis optica. Nat Clin Pract Neurol. 2008;4:202–14. - PubMed
    1. Wingerchuk DM, Lennon VA, Lucchinetti CF, Pittock SJ, Weinshenker BG. The spectrum of neuromyelitis optica. Lancet Neurol. 2007;6:805–15. - PubMed
    1. Papadopoulos MC, Verkman AS. Aquaporin water channels in the nervous system. Nat Rev Neurosci. 2013;14:265–77. - PMC - PubMed
    1. Jarius S, Wildemann B. AQP4 antibodies in neuromyelitis optica: diagnostic and pathogenetic relevance. Nat Rev Neurol. 2010;6:383–92. - PubMed
    1. Lennon VA, Kryzer TJ, Pittock SJ, Verkman AS, Hinson SR. IgG marker of optic-spinal multiple sclerosis binds to the aquaporin-4 water channel. J Exp Med. 2005;202:473–7. - PMC - PubMed

Publication types

MeSH terms

Supplementary concepts