. 2014 May:242:224-32.
doi: 10.1016/j.jmr.2014.02.018. Epub 2014 Mar 1.

Dipolar Assisted Assignment Protocol (DAAP) for MAS solid-state NMR of rotationally aligned membrane proteins in phospholipid bilayers

Affiliations

Dipolar Assisted Assignment Protocol (DAAP) for MAS solid-state NMR of rotationally aligned membrane proteins in phospholipid bilayers

Bibhuti B Das et al. J Magn Reson. 2014 May.

Abstract

A method for making resonance assignments in magic angle spinning solid-state NMR spectra of membrane proteins that utilizes the range of heteronuclear dipolar coupling frequencies in combination with conventional chemical shift based assignment methods is demonstrated. The Dipolar Assisted Assignment Protocol (DAAP) takes advantage of the rotational alignment of the membrane proteins in liquid crystalline phospholipid bilayers. Improved resolution is obtained by combining the magnetically inequivalent heteronuclear dipolar frequencies with isotropic chemical shift frequencies. Spectra with both dipolar and chemical shift frequency axes assist with resonance assignments. DAAP can be readily extended to three- and four-dimensional experiments and to include both backbone and side chain sites in proteins.

Keywords: MAS; Membrane protein; Solid state NMR; Vpu.


Figures

Figure 1
Figure 1
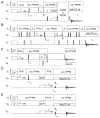
Multidimensional pulse schemes for dipolar assisted assignment protocol experiments. (A) Intra or inter residue correlation of 1H-15N DC/15N(Cα)13CX or 1H-15N DC/15N(C)13CX. (B) 1H-15N DC/1315N13CO. (C) 1Hα-13Cα DC/13C CS/13C CS. (D) 1H-15N DC/1Hα-13Cα DC/13Cα CS. (E) 1Hα-13Cα DC/15N CS/13Cα CS. Thin and wide solid lines are for 90° and 180° pulses. Delta symbol represents the delay for z-filter. CP and DCP represents cross polarization and double cross polarization under SPECIFIC CP condition. CS stands for chemical shift ϕ represents the phase change under States mode.
Figure 2
Figure 2
Rotational alignment of uniformly 13C,15N labeled single trans-membrane helix from Vpu in DMPC proteoliposome. (A) 13C detected one-dimensional spectra recorded at various temperatures ranging from 5 °C to 25 °C. Data were collected using 1H to 13C cross-polarization under 5 kHz magic angle sample spinning. (B) Graphical plot showing the variation in intensity ratios (central peak to the first sideband on the left) as a function of temperature. Central peak is marked with an arrow in A and asterisks denote spinning side bands. One-dimensional data were acquired with 100 kHz spectral width, 15 ms acquisition time, and 2 s recycle delay for 16 scans (5 °C), 32 scans (10 °C, 15 °C, 20 °C) and 64 scans (25 °C).
Figure 3
Figure 3
13C detected two-dimensional correlation spectra of uniformly 13C, 15N labeled Vpu-TM. (A) 13C/13C correlation spectrum obtained from 50 ms proton driven spin diffusion (PDSD) mixing. Single resonance assignment for 13C shifts in P3, L11and S23 are labeled. Chemical shift dispersion for other residues such as Ala, Val, Ile, Glu, Gln, Trp, and Lys are also been labeled. (B) Two-dimensional N(CA)CX correlation spectra. 20 ms DARR mixing was used for carbon spin exchange in B. Residue numbers are marked following the sequential resonance assignment. Homo- and hetero- nuclear correlation two-dimensional spectra were acquired with 128 scans (13C/13C) and 512 scans (13C/15N) with a 2 s recycle delay. Experiments were carried out with 242 ppm (13C), 80 ppm (13C) and 32 ppm (15N) spectral widths for direct and indirect acquisition. The acquisition periods were 12 ms for direct and 4 ms (13C)/6 ms (15N) for indirect detection. 100 μs, 500 μs and 3000 μs contact times were used for 1H to 13C, 1H to 15N and 15N to 13C cross-polarization, respectively.
Figure 4
Figure 4
Strip-plots for resonance assignment for residues V9–V12 in uniformly13C,15N labeled Vpu TM. Two-dimensional 13C/13C correlation plot from NCACX (red) and NCOCX (blue) data extracted at 15N shifts. 13C shifts are marked according to their positions in backbone and side chains. Three-dimensional data were acquired with 256 scans (NCACX) and 512 scans (NCOCX). The experiments were carried out under similar conditions to those described in Figure 3 except that the homonuclear spin diffusion was obtained with 40 ms DARR mixing, and 40 ppm and 20 ppm 13C spectral widths for NCACX and NCOCX, respectively.
Figure 5
Figure 5
13C-detected two-dimensional separated local field NMR spectra. (A) 15N edited spectrum correlating 13Cα chemical shifts and 1H-15N dipolar couplings. The spectrum was obtained using the pulse scheme shown in Figure 1A without the 15N chemical shift evolution and spin diffusion mixing periods. (B) 13C CS/1H-13C DC correlation spectrum. All spectra were recorded under 11.111 kHz MAS at 25 °C. Two-dimensional data were acquired with 512 scans (A) and 128 scans (B) using a 2 s recycle delay. Dwell times of 90 μs for A and 30 μs for B were used in the indirect dimensions to record the spectra. A 12 ms acquisition time was used for direct 13C detection.
Figure 6
Figure 6
13C detected three-dimensional separated local field spectra of uniformly 13C,15N labeled Vpu TM. (A) and (B) Two-dimensional SLF planes correlating 13Cα CS/1H-15N DC extracted from a three-dimensional SLF data set for 15N shifts at 121.6 ppm and 122.8 ppm, respectively. The spectrum was recorded using the pulse scheme shown in Figure 1A without incorporating the spin diffusion mixing. (C) and (D) Two-dimensional SLF planes correlating 13Cα CS/1Hα-13Cα DC for 15N shifts at 121.6 ppm and 122.8 ppm, respectively. The experiment correlating 13Cα CS/15N CS/1Hα-13Cα DC was acquired using the pulse scheme in Figure 1E. (E) and (F) Two-dimensional SLF planes correlating 1H-15N/1Hα-13Cα dipolar frequencies extracted from a three-dimensional SLF data set for 13C shifts at 65.7 ppm and 53.5 ppm, respectively. The three-dimensional data was collected using the pulse scheme in Figure 1D. (G) 13C/13C two-dimensional plane obtained at 9.9 kHz 1Hα-13Cα DC. Three-dimensional SLF data correlating 1Hα-13Cα DC/13C CS/13C CS recorded using the pulse scheme shown in Figure 1C. All spectra were collected at a spinning frequency of 11.111 kHz and 25 °C sample temperature. t1 noise from lipid signals is denoted with asterisks. The three-dimensional data in A–F were collected with 512 scans (A–F) or128 scans (G). A 2 s recycle delay and 90 μs dwell time were used in the experiments.
Figure 7
Figure 7
13C detected three-dimensional SLF data correlating 13C and 15N isotropic chemical shifts with 1H-15N dipolar frequencies. (A) N(CA)CX two-dimensional plane obtained at 2.4 kHz 1H-15N dipolar coupling (DC) frequency. The three-dimensional data were collected using the pulse scheme shown in Figure 1A with a 20 ms DARR (dipolar assisted rotational resonance) mixing. (B) N(CO)CX 2D-plane at 2.55 kHz 1H-15N DC. The three-dimensional data were collected using the pulse scheme shown in Figure 1A with 40 ms DARR mixing. (C) CONCA two-dimensional correlation plane obtained for 2.55 kHz 1H-15N DC. The three-dimensional data were collected using the pulse scheme shown in Figure 1B with 1.44 ms TEDOR mixing. Dashed lines illustrate the connectivity for residues A14 and V13 for 15N and 13C shifts. (D) 13C/13C two-dimensional plane obtained at 7.4 kHz 1Hα-13Cα DC. Three-dimensional SLF data correlating 1Hα-13Cα DC/13C CS/13C CS recorded using the pulse scheme shown in Figure 1C. The three-dimensional data were collected with 1024 scans (A–C), 128 scans (D), 2 s recycle delay and 90 μs dwell time.
Figure 8
Figure 8
Dipolar wave plot for 1H-15N dipolar frequencies as a function of residue type. Comparison between the dipolar waves of normalized dipolar couplings (x) with order parameter S = 0.8 obtained from 14-O-PC/6-O-PC bicelles (q = 3.2) at 42°C and those of dipolar couplings (o) obtained from DMPC liposomes at a spinning rate of 11.111 kHz and 25°C.

Similar articles

Cited by

References

    1. McDermott A. Structure and dynamics of membrane proteins by magic angle spinning solid-state NMR. Annu Rev Biophys. 2009;38:385–403. - PubMed
    1. Opella SJ. Structure Determination of Membrane Proteins by Nuclear Magnetic Resonance Spectroscopy. Annual Review of Analytical Chemistry. 2013;6:305–328. - PMC - PubMed
    1. Schuetz A, Wasmer C, Habenstein B, Verel R, Greenwald J, Riek R, Böckmann A, Meier BH. Protocols for the Sequential Solid-State NMR Spectroscopic Assignment of a Uniformly Labeled 25 kDa Protein: HET-s(1–227) ChemBioChem. 2010;11:1543–1551. - PubMed
    1. Shi L, Lake EM, Ahmed MA, Brown LS, Ladizhansky V. Solid-state NMR study of proteorhodopsin in the lipid environment: secondary structure and dynamics. Biochimica et Biophysica Acta (BBA)-Biomembranes. 2009;1788:2563–2574. - PubMed
    1. Tang W, Knox RW, Nevzorov AA. A spectroscopic assignment technique for membrane proteins reconstituted in magnetically aligned bicelles. J Biomol NMR. 2012;54:307–316. - PubMed

Publication types

MeSH terms