. 2014 Apr 3;10(4):e1004267.
doi: 10.1371/journal.pgen.1004267. eCollection 2014 Apr.

CNNM2 mutations cause impaired brain development and seizures in patients with hypomagnesemia

Affiliations

CNNM2 mutations cause impaired brain development and seizures in patients with hypomagnesemia

Francisco J Arjona et al. PLoS Genet. .

Abstract

Intellectual disability and seizures are frequently associated with hypomagnesemia and have an important genetic component. However, to find the genetic origin of intellectual disability and seizures often remains challenging because of considerable genetic heterogeneity and clinical variability. In this study, we have identified new mutations in CNNM2 in five families suffering from mental retardation, seizures, and hypomagnesemia. For the first time, a recessive mode of inheritance of CNNM2 mutations was observed. Importantly, patients with recessive CNNM2 mutations suffer from brain malformations and severe intellectual disability. Additionally, three patients with moderate mental disability were shown to carry de novo heterozygous missense mutations in the CNNM2 gene. To elucidate the physiological role of CNNM2 and explain the pathomechanisms of disease, we studied CNNM2 function combining in vitro activity assays and the zebrafish knockdown model system. Using stable Mg(2+) isotopes, we demonstrated that CNNM2 increases cellular Mg2+ uptake in HEK293 cells and that this process occurs through regulation of the Mg(2+)-permeable cation channel TRPM7. In contrast, cells expressing mutated CNNM2 proteins did not show increased Mg(2+) uptake. Knockdown of cnnm2 isoforms in zebrafish resulted in disturbed brain development including neurodevelopmental impairments such as increased embryonic spontaneous contractions and weak touch-evoked escape behaviour, and reduced body Mg content, indicative of impaired renal Mg(2+) absorption. These phenotypes were rescued by injection of mammalian wild-type Cnnm2 cRNA, whereas mammalian mutant Cnnm2 cRNA did not improve the zebrafish knockdown phenotypes. We therefore concluded that CNNM2 is fundamental for brain development, neurological functioning and Mg(2+) homeostasis. By establishing the loss-of-function zebrafish model for CNNM2 genetic disease, we provide a unique system for testing therapeutic drugs targeting CNNM2 and for monitoring their effects on the brain and kidney phenotype.


Conflict of interest statement

The authors have declared that no competing interests exist.

Figures
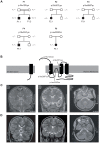
Figure 1
Figure 1. Pedigrees and magnetic resonance imaging (MRI) studies of families with primary hypomagnesemia.
(A) Pedigrees of families F1–F5. Filled symbols represent affected individuals, mutant alleles are indicated by a minus (−) and plus (+) sign, respectively. (B) Localization of the mutations in the CNNM2 protein structure (Uniprot Q9H8M5). CNNM2 contains a long signal peptide (64 amino acids) that is cleaved at the membrane of the endoplasmic reticulum. The remaining part of the CNNM2 protein is trafficked to the plasma membrane, where it becomes functionally active. White dots show the locations of the mutations. (C–D) MRI of the brain of patient F1.1 (C, T2 weighed images) and patient F2.1 (D, T2 weighed images). Left: Coronal images demonstrating a defect in myelinization of U-fibers (arrows) in patient F1.1 in contrast to a normal myelin pattern in patient F2.1. Center: Coronal T2 weighted images showing widened outer cerebrospinal liquor spaces (dashed arrows) and lack of opercularization (solid arrows) in patient F1.1, whereas a regular brain volume and insular lobe is observed in patient F2.1. Right: Absence of cerebellar structural abnormalities in patients F1.1 and F2.1 on axial T2 weighted images at the level of the trigeminal nerve.
Figure 2
Figure 2. CNNM2 increases Mg2+ uptake in HEK293 cells.
(A) Time curve of 25Mg2+ uptake in mock (circles) and CNNM2 (squares) transfected cells. (B) Representation of the normalized Mg2+ uptake after 5 minutes. (C) 25Mg2+ uptake in the presence of inhibitors of ion transporters, black bars represent mock cells and white bars represent CNNM2-transfected cells. (D) Dose-response curve of 25Mg2+ transport inhibition by 2-APB in mock (circles) and CNNM2 (squares) transfected cells. (E) The effect of Na+ and Cl availability on 25Mg2+ uptake in mock (black bars) and CNNM2 (white bars) transfected cells. (F) 25Mg2+ uptake as a function of extracellular 25Mg2+ availability in mock (circles) and CNNM2 (squares) transfected cells. (G) 25Mg2+ extrusion in mock (circles) and CNNM2 (squares) transfected cells. Each data point represent the mean of 3 independent experiments ± SEM. * indicates significant differences compared to mock (P<0.05).
Figure 3
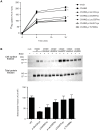
Figure 3. CNNM2 mutations impair Mg2+ uptake in HEK293 cells.
(A) Time curve of 25Mg2+ uptake in mock, wild-type CNNM2 and mutant CNNM2 transfected cells. Symbols indicate cells transfected with the vector empty (• mock) or containing Cnnm2 sequences encoding for wild-type or mutant CNNM2 proteins (▪ CNNM2, ▴ CNNM2-p.Glu122Lys, ▾ CNNM2-p.Ser269Trp, ⧫ CNNM2-p.Leu330Phe, ○ CNNM2-p.Glu357Lys, □ CNNM2-p.Thr568Ile). Each data point represent the mean of 3 independent experiments ± SEM. * indicates significant differences compared to mock (P<0.05). (B) Representative immunoblots showing that p.Glu122Lys and p.Ser269Trp mutations reduce CNNM2 membrane expression (upper blot) and a CNNM2 expression control (lower blot). Quantification of cell surface expression of wild-type (WT) and mutant CNNM2 proteins corrected for total protein expression. Results are the mean ± SEM of 3 independent experiments. * indicate significant differences compared to WT CNNM2 transfected cells (P<0.05).
Figure 4
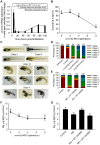
Figure 4. Knockdown of cnnm2a results in Mg wasting in zebrafish larvae (5 dpf).
(A) mRNA expression of cnnm2a in developing zebrafish. Expression patterns were analysed by RT-qPCR (n = 6 per time point). (B) Survival curve at 5 dpf (n = 3 per experimental condition). The dose of zero represents injection with control-MO. (C) Morphological phenotypes in zebrafish larvae (5 dpf) in cnnm2a knockdown experiments. (D) Distribution of morphological phenotypes in zebrafish larvae (5 dpf) untreated (wild-type) or injected with different doses of cnnm2a-MO or control-MO. Numbers on top of the bars indicate the number of animals in each experimental condition. (E) Distribution of morphological phenotypes in zebrafish larvae at 5 dpf in rescue experiments. The wild-type phenotype (class I) was restored in morphants by co-injection of cnnm2a-MO (2 ng MO/embryo) with wild-type (WT) CNNM2 cRNA (50 pg cRNA/embryo), but not with mutant (MT, p.Glu357Lys) CNNM2 cRNA (50 pg cRNA/embryo). (F) Magnesium content in zebrafish injected with different doses of cnnm2a-MO, the dose of zero represents injection with control-MO (n = 10 per experimental condition except in 8 ng MO-injected zebrafish where n = 5). (G) Rescue of Mg wasting in morphant zebrafish by co-injection of cnnm2a-MO (2 ng MO/embryo) with cRNA encoding for wild-type (WT) CNNM2 (50 pg cRNA/embryo). Co-injection with cRNA encoding for mutant (MT, p.Glu357Lys) CNNM2 (50 pg cRNA/embryo) did not restore Mg levels (n = 10 per experimental condition). Data are presented as mean ± SEM. Different letters indicate significant differences between mean values in experimental groups (P<0.05).
Figure 5
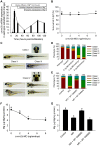
Figure 5. Knockdown of cnnm2b results in Mg wasting and brain malformations in zebrafish larvae (5 dpf).
(A) mRNA expression of cnnm2b in developing zebrafish. Expression patterns were analysed by RT-qPCR (n = 6 per time point). (B) Survival curve at 5 dpf (n = 3 per experimental condition). The dose of zero represents injection with control-MO. (C) Morphological phenotypes in zebrafish larvae (5 dpf) in cnnm2b knockdown experiments. (D) Distribution of morphological phenotypes in zebrafish larvae (5 dpf) untreated (wild-type) or injected with different doses of cnnm2b-MO or control-MO. Brain malformations (widened cerebrospinal fluid spaces, class IV phenotype) are prominent in morphants injected with 4–8 ng MO/embryo. Numbers on top of the bars indicate the number of animals in each experimental condition. (E) Distribution of morphological phenotypes in zebrafish larvae at 5 dpf in rescue experiments. The wild-type phenotype (class I) was restored in morphants by co-injection of cnnm2b-MO (8 ng MO/embryo) with wild-type (WT) CNNM2 cRNA (50 pg cRNA/embryo), but not with mutant (MT, p.Glu357Lys) CNNM2 cRNA (50 pg cRNA/embryo). (F) Magnesium content in zebrafish injected with different doses of cnnm2b-MO. The dose of zero represents injection with control-MO (n = 10 per experimental condition). (G) Rescue of Mg wasting in morphant zebrafish by co-injection of cnnm2b-MO (8 ng MO/embryo) with cRNA encoding for wild-type (WT) CNNM2 (50 pg cRNA/embryo). Co-injection with cRNA encoding for mutant (MT, p.Glu357Lys) CNNM2 (50 pg cRNA/embryo) did not restore Mg levels (n = 10 per experimental condition). Data are presented as mean ± SEM. Different letters indicate significant differences between mean values in experimental groups (P<0.05).
Figure 6
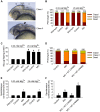
Figure 6. Dysfunctional cnnm2a causes brain abnormalities and increased spontaneous contractions in zebrafish embryos (25 hpf).
(A) Phenotypes in zebrafish embryos untreated (wild-type) or following treatment with cnnm2a-MO (2 ng MO/embryo) or control-MO. Abbreviations indicate the following parts in the zebrafish embryonic brain: M, midbrain; T, tectum; MHB, midbrain-hindbrain boundary; FV, fourth ventricle; and H, hindbrain. (B) Distribution of phenotypes and (C) Mg content (n = 10 per experimental condition) in zebrafish embryos untreated (wild-type) or injected with 2 ng of cnnm2a-MO or control-MO and exposed to a medium with a concentration of Mg2+ of 0.33 or 25 mM. Numbers on top of the bars indicate the number of animals in each experimental condition. (D) Restoration of normal brain development by co-injection of cnnm2a-MO (2 ng MO/embryo) with cRNA encoding for wild-type (WT) CNNM2 (50 pg cRNA/embryo), and not by co-injection with cRNA encoding for mutant (MT, p.Glu357Lys) CNNM2 (50 pg cRNA/embryo). (E) Spontaneous contractions in zebrafish embryos untreated (wild-type) or injected with 2 ng of cnnm2a-MO or control-MO and exposed to a medium with a concentration of Mg2+ of 0.33 or 25 mM (n = 30 per experimental condition). (F) Restoration of normal spontaneous contraction activity (n = 30 per experimental condition) by co-injection of cnnm2a-MO (2 ng MO/embryo) with cRNA encoding for wild-type (WT) CNNM2 (50 pg cRNA/embryo), and not by co-injection with cRNA encoding for mutant (MT, p.Glu357Lys) CNNM2 (50 pg cRNA/embryo). Data are presented as mean ± SEM. *P<0.05 versus wild-type and control. # P<0.05 versus Mg2+-normal (0.33 mM Mg2+) medium. Data are presented as mean ± SEM. Different letters indicate significant differences between mean values in experimental groups (P<0.05).
Figure 7
Figure 7. Dysfunctional cnnm2b causes brain abnormalities and increased spontaneous contractions in zebrafish embryos (25 hpf).
(A) Phenotypes in zebrafish embryos untreated (wild-type) or following treatment with cnnm2b-MO (8 ng MO/embryo) or control-MO. See Figure 6 for an explanation of the abbreviations shown. (B) Distribution of phenotypes and (C) Mg content (n = 10 per experimental condition) in zebrafish embryos untreated (wild-type) or injected with 8 ng of cnnm2b-MO or control-MO and exposed to a medium with a concentration of Mg2+ of 0.33 or 25 mM. Numbers on top of the bars indicate the number of animals in each experimental condition. (D) Restoration of normal brain development by co-injection of cnnm2b-MO (8 ng MO/embryo) with cRNA encoding for wild-type (WT) CNNM2 (50 pg cRNA/embryo), and not by co-injection with cRNA encoding for mutant (MT, p.Glu357Lys) CNNM2 (50 pg cRNA/embryo). (E) Spontaneous contractions in zebrafish embryos untreated (wild-type) or injected with 8 ng of cnnm2b-MO or control-MO and exposed to a medium with a concentration of Mg2+ of 0.33 or 25 mM (n = 30 per experimental condition). (F) Restoration of normal spontaneous contraction activity (n = 30 per experimental condition) by co-injection of cnnm2b-MO (8 ng MO/embryo) with cRNA encoding for wild-type (WT) CNNM2 (50 pg cRNA/embryo), and not by co-injection with cRNA encoding for mutant (MT, p.Glu357Lys) CNNM2 (50 pg cRNA/embryo). Data are presented as mean ± SEM. *P<0.05 versus wild-type and control. # P<0.05 versus Mg2+-normal (0.33 Mm Mg2+) medium. Data are presented as mean ± SEM. Different letters indicate significant differences between mean values in experimental groups (P<0.05).

References

    1. Dimke H, Monnens L, Hoenderop JG, Bindels RJ (2012) Evaluation of Hypomagnesemia: Lessons From Disorders of Tubular Transport. Am J Kidney Dis 62: 377–83. - PubMed
    1. Moser J, Kilb W, Werhahn KJ, Luhmann HJ (2006) Early developmental alterations of low-Mg2+ -induced epileptiform activity in the intact corticohippocampal formation of the newborn mouse in vitro . Brain Res 1077: 170–177. - PubMed
    1. Jin J, Wu LJ, Jun J, Cheng X, Xu H, et al. (2012) The channel kinase, TRPM7, is required for early embryonic development. Proc Natl Acad Sci USA 109: E225–E233. - PMC - PubMed
    1. van de Graaf SF, Bindels RJ, Hoenderop JG (2007) Physiology of epithelial Ca2+ and Mg2+ transport. Rev Physiol Biochem Pharmacol 158: 77–160. - PubMed
    1. Runnels LW (2011) TRPM6 and TRPM7: A Mul-TRP-PLIK-cation of channel functions. Curr Pharm Biotechnol 12: 42–53. - PMC - PubMed

Publication types

MeSH terms