

Waste not, want not: why rarefying microbiome data is inadmissible
- PMID: 24699258
- PMCID: PMC3974642
- DOI: 10.1371/journal.pcbi.1003531
Waste not, want not: why rarefying microbiome data is inadmissible
Abstract
Current practice in the normalization of microbiome count data is inefficient in the statistical sense. For apparently historical reasons, the common approach is either to use simple proportions (which does not address heteroscedasticity) or to use rarefying of counts, even though both of these approaches are inappropriate for detection of differentially abundant species. Well-established statistical theory is available that simultaneously accounts for library size differences and biological variability using an appropriate mixture model. Moreover, specific implementations for DNA sequencing read count data (based on a Negative Binomial model for instance) are already available in RNA-Seq focused R packages such as edgeR and DESeq. Here we summarize the supporting statistical theory and use simulations and empirical data to demonstrate substantial improvements provided by a relevant mixture model framework over simple proportions or rarefying. We show how both proportions and rarefied counts result in a high rate of false positives in tests for species that are differentially abundant across sample classes. Regarding microbiome sample-wise clustering, we also show that the rarefying procedure often discards samples that can be accurately clustered by alternative methods. We further compare different Negative Binomial methods with a recently-described zero-inflated Gaussian mixture, implemented in a package called metagenomeSeq. We find that metagenomeSeq performs well when there is an adequate number of biological replicates, but it nevertheless tends toward a higher false positive rate. Based on these results and well-established statistical theory, we advocate that investigators avoid rarefying altogether. We have provided microbiome-specific extensions to these tools in the R package, phyloseq.
Conflict of interest statement
The authors have declared that no competing interests exist.
Figures
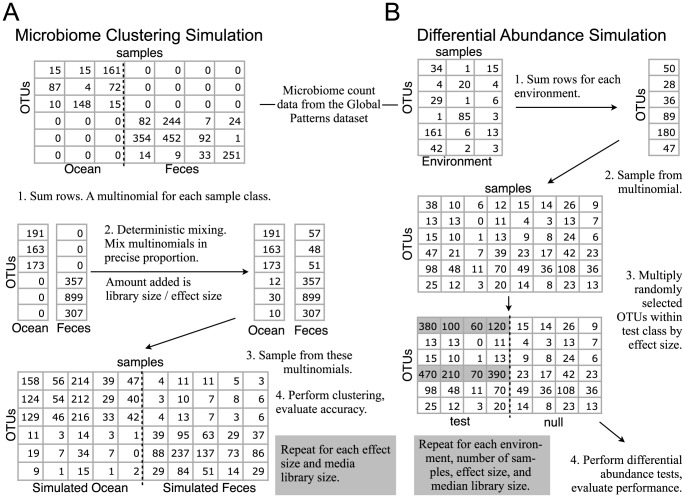
 ), respectively. The horizontal axis is the effect size, which in this context is the ratio of target to non-target values in the multinomials that were used to simulate microbiome counts. Each multinomial is derived from two microbiomes that have negligible overlapping OTUs (Fecal and Ocean microbiomes in the Global Patterns dataset [48]). Higher values of effect size indicate an easier clustering task. For simulation details and precise definitions of abbreviations see Simulation A of the Methods section.
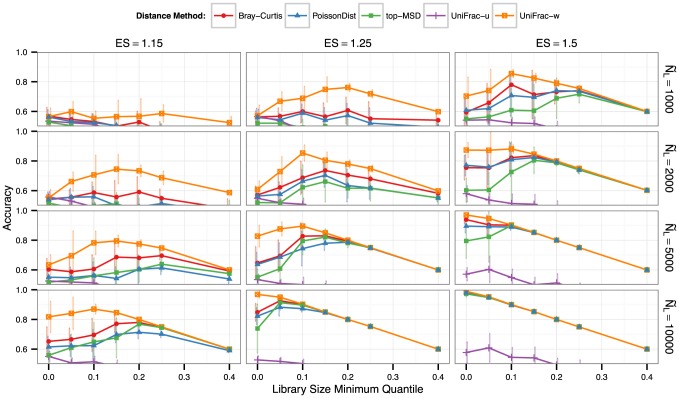
 ), and distance method applied after rarefying, respectively. Because discarded samples cannot be accurately clustered, the line
  is the maximum achievable accuracy.
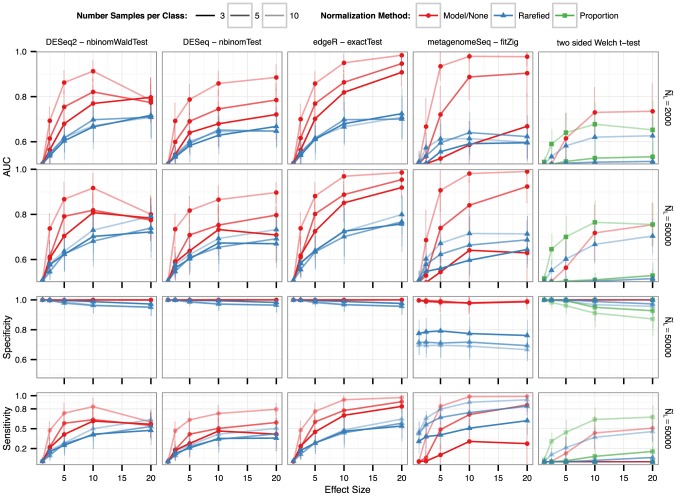
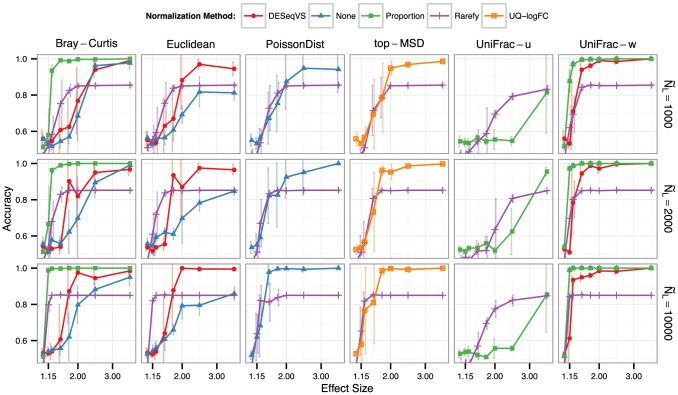
 , while the darkness of line shading indicates the number of samples per simulated experiment. Color shade and shape indicate the normalization method. See Methods section for the definitions of each normalization and testing method. For all methods, detection among multiple tests was defined using a False Discovery Rate (Benjamini-Hochberg [52]) significance threshold of 0.05.
References
-
- Shendure J, Ji H (2008) Next-generation DNA sequencing. Nature Biotechnology 26: 1135–1145. - PubMed
-
- Mortazavi A, Williams BA, McCue K, Schaeffer L, Wold B (2008) Mapping and quantifying mammalian transcriptomes by RNA-Seq. Nature Methods 5: 621–628. - PubMed
-
- Pace NR (1997) A molecular view of microbial diversity and the biosphere. Science 276: 734–740. - PubMed
MeSH terms
Grants and funding
LinkOut - more resources
Full Text Sources
Other Literature Sources
Medical
Molecular Biology Databases
