Estimating mean first passage time of biased random walks with short relaxation time on complex networks
- PMID: 24699325
- PMCID: PMC3974760
- DOI: 10.1371/journal.pone.0093348
Estimating mean first passage time of biased random walks with short relaxation time on complex networks
Abstract
Biased random walk has been studied extensively over the past decade especially in the transport and communication networks communities. The mean first passage time (MFPT) of a biased random walk is an important performance indicator in those domains. While the fundamental matrix approach gives precise solution to MFPT, the computation is expensive and the solution lacks interpretability. Other approaches based on the Mean Field Theory relate MFPT to the node degree alone. However, nodes with the same degree may have very different local weight distribution, which may result in vastly different MFPT. We derive an approximate bound to the MFPT of biased random walk with short relaxation time on complex network where the biases are controlled by arbitrarily assigned node weights. We show that the MFPT of a node in this general case is closely related to not only its node degree, but also its local weight distribution. The MFPTs obtained from computer simulations also agree with the new theoretical analysis. Our result enables fast estimation of MFPT, which is useful especially to differentiate between nodes that have very different local node weight distribution even though they share the same node degrees.
Conflict of interest statement
Figures


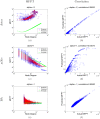
 , 0, 1 respectively. For most cases, the tail of the first passage time distribution can be predicted fairly accurately except for Figure 2(j), which is due to the high relaxation time as shown in Table 2.

 for certain values of
  and cannot be adequately shown in the figure. The spectral dimension generally peaks in the interval [−1, 1] and drops significantly for
  of greater magnitude. This is especially true for the BA and ER networks (from infinity to a finite value). In the extreme case, by setting
  , the ‘random walk’ is no longer random as the node with largest degree will always be chosen at every step. Similar reasoning also applies for
  . Therefore, towards both extremes, we would expect the random walk to become more localized and hence falls into the compact exploration regime.
 is less than 2, the MFPT is not found to be independent of node degree. Instead, the MFPT exhibits a power-law relationship with respect to the node degree. The disparity arises probably as a result of self-loops, which affects both the RTO probability distribution and the estimated
  .
.References
-
- Barabsi AL, Albert R (1999) Emergence of scaling in random networks. Science 286: 509–512. - PubMed
-
- de Martino D, Dall’Asta L, Bianconi G, Marsili M (2009) Congestion phenomena on complex networks. Physical Review E 79: 015101. - PubMed
-
- Yan G, Zhou T, Hu B, Fu ZQ, Wang BH (2006) Efficient routing on complex networks. Physical Review E 73: 046108. - PubMed
-
- Ling X, Hu MB, Jiang R, Wu QS (2010) Global dynamic routing for scale-free networks. Phys Rev E 81: 016113. - PubMed
Publication types
MeSH terms
LinkOut - more resources
Full Text Sources
Other Literature Sources
Miscellaneous

