. 2014 Apr 3;10(4):e1004048.
doi: 10.1371/journal.ppat.1004048. eCollection 2014 Apr.

IFITM3 restricts influenza A virus entry by blocking the formation of fusion pores following virus-endosome hemifusion

Affiliations

IFITM3 restricts influenza A virus entry by blocking the formation of fusion pores following virus-endosome hemifusion

Tanay M Desai et al. PLoS Pathog. .

Abstract

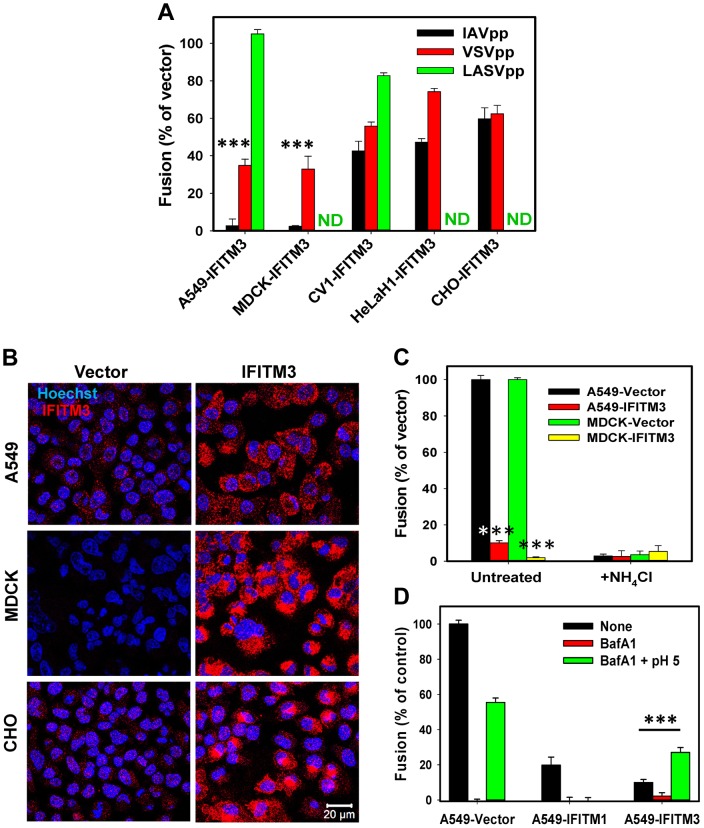
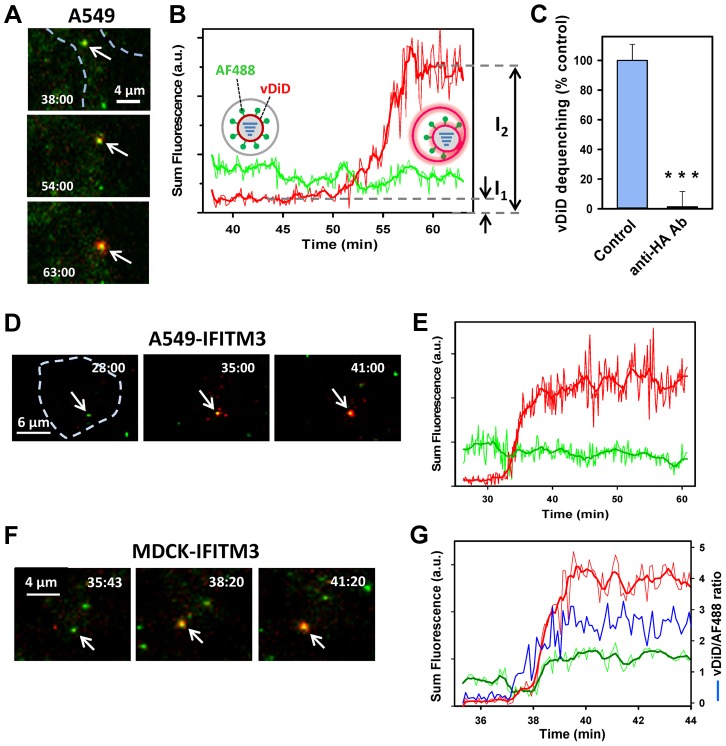
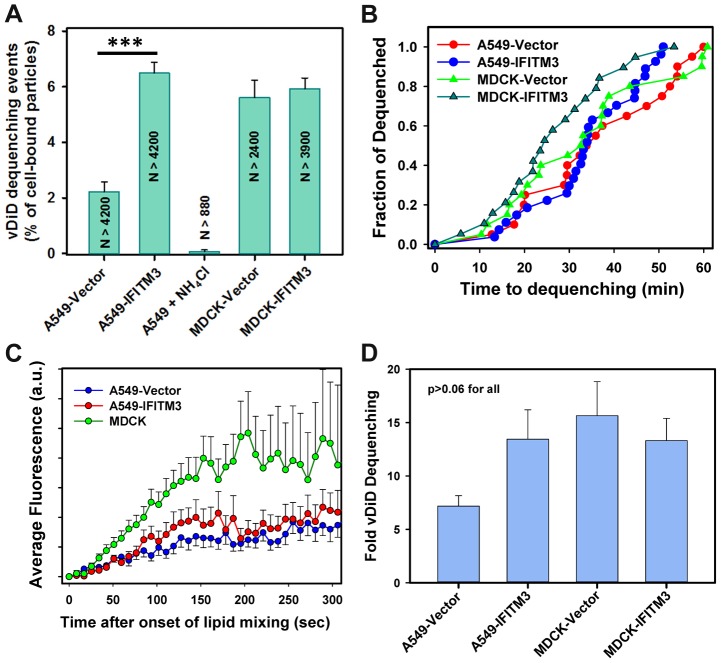
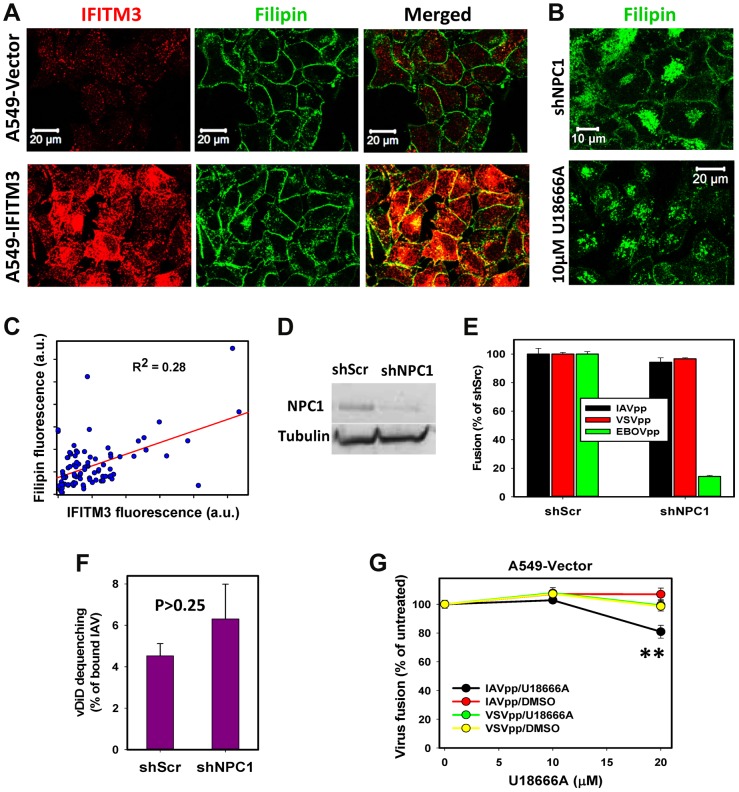
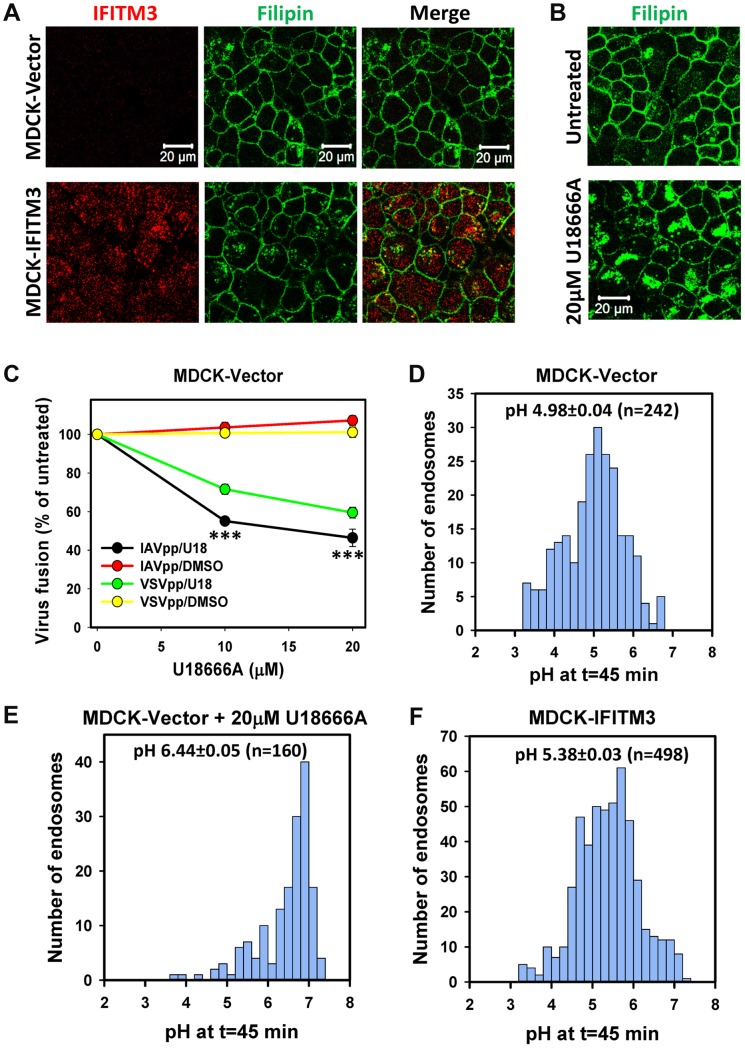
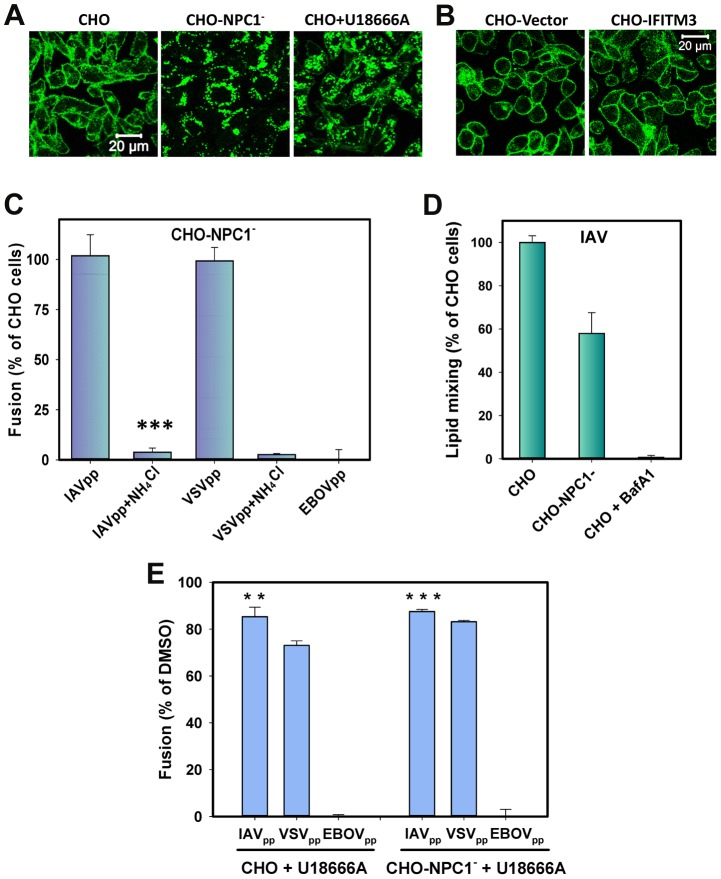
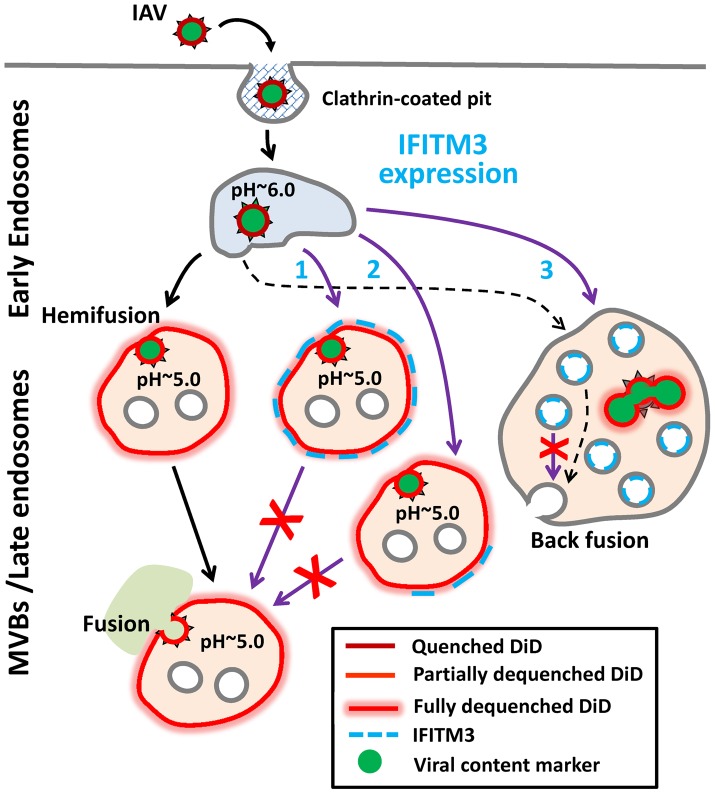
Interferon-induced transmembrane proteins (IFITMs) inhibit infection of diverse enveloped viruses, including the influenza A virus (IAV) which is thought to enter from late endosomes. Recent evidence suggests that IFITMs block virus hemifusion (lipid mixing in the absence of viral content release) by altering the properties of cell membranes. Consistent with this mechanism, excess cholesterol in late endosomes of IFITM-expressing cells has been reported to inhibit IAV entry. Here, we examined IAV restriction by IFITM3 protein using direct virus-cell fusion assay and single virus imaging in live cells. IFITM3 over-expression did not inhibit lipid mixing, but abrogated the release of viral content into the cytoplasm. Although late endosomes of IFITM3-expressing cells accumulated cholesterol, other interventions leading to aberrantly high levels of this lipid did not inhibit virus fusion. These results imply that excess cholesterol in late endosomes is not the mechanism by which IFITM3 inhibits the transition from hemifusion to full fusion. The IFITM3's ability to block fusion pore formation at a post-hemifusion stage shows that this protein stabilizes the cytoplasmic leaflet of endosomal membranes without adversely affecting the lumenal leaflet. We propose that IFITM3 interferes with pore formation either directly, through partitioning into the cytoplasmic leaflet of a hemifusion intermediate, or indirectly, by modulating the lipid/protein composition of this leaflet. Alternatively, IFITM3 may redirect IAV fusion to a non-productive pathway, perhaps by promoting fusion with intralumenal vesicles within multivesicular bodies/late endosomes.


Conflict of interest statement

The authors have declared that no competing interests exist.

Figures

Figure 1
Figure 1. IFITM-mediated restriction of virus-endosome fusion in different cell types.
(A) IFITM3-mediated inhibition of viral fusion with different cell types. BlaM-Vpr carrying pseudoviruses (IAVpp, VSVpp and LASVpp, MOI = 1) were bound to IFITM3- or vector-transduced A549, MDCK, CV1, HeLaH1 or CHO cells in the cold. Fusion was allowed to proceed for 90 min at 37°C and was measured by the BlaM assay, as described in Materials and Methods. ND, not determined. Data are means and SEM from 2 independent triplicate experiments. (B) IFITM3 expression patterns in A549, MDCK and CHO cells transduced with an empty vector (left) or IFITM3 (right). Cells were fixed, permeabilized and immunostained for IFITM3 (red), as described in Materials and Methods. The nuclear stain, Hoechst-3342, is shown in blue. (C) IFITM3 restricts fusion of influenza virus-like particles containing β-lactamase reporter protein fused to the influenza matrix protein-1 (BlaM1). Experiments were carried out as described above. Data are means and SEM from 2 independent triplicate experiments. (D) Exposure to low pH overcomes the IFITM3-mediated block of IAVpp fusion. To force pseudovirus fusion at the plasma membrane, A549 cells transduced with IFITM1, IFITM3 or an empty vector were pretreated with 50 nM BafA1 for 30 min at 37°C or left untreated. IAVpp/BlaM-Vpr pseudoviruses (MOI = 1) were bound to cells of in the cold and exposed to either a pre-warmed pH 5.0 MES-citrate buffer or neutral buffer for 10 min at 37°C and further incubated in growth medium (with or without BafA1) for 90 min at 37°C. Data are means and SEM from 2 independent triplicate experiments. ***, P<0.001 by two-tailed t-test.
Figure 2
Figure 2. Lipid mixing between single IAV particles and endosomes in control and IFITM3-expressing cells.
(A–E) IAV particles co-labeled with AF488 (green) and vDiD (red) were pre-bound to A549-Vector or A549-IFITM3 cells in the cold and incubated at 37°C for 1 h. Particles exchanging vDiD with endosomes (arrows in A and D) exhibited marked increase in red signal. (A, B) Images of vDiD dequenching (extended projections) and particle fluorescence intensities obtained by tracking virions in A549 cells. A schematic illustration of IAV hemifusion with an endosome (gray), which leads to vDiD dequenching, is overlaid on the graph. I1 and I2 are fluorescence intensities immediately before dequenching and at the peak of dequenching, respectively. (C) IAV lipid mixing activity in A549-Vector cells is blocked in the presence of anti-HA antibody. AF488- and vDiD-labeled IAV were pre-incubated with 20 µg/ml of polyclonal anti-IAV antibody (Millipore, Billerica, MA) for 1 h at room temperature. Viruses were then bound to A549-Vector cells in the cold by spinoculation, and entry was initiated with warm imaging buffer supplemented with 20 µg/ml of the antibody. Images were collected from 12 fields and the average fraction of AF488 particles with the vDiD signal above the threshold level was determined and normalized to control conditions without the antibody. ***, P<0.001. (D, E) Representative images and analysis of lipid mixing in A549-IFITM3 cells. (F, G) Representative images and analysis of lipid mixing in MDCK-IFITM3 cells. The ratio of vDiD and AF488 signals (blue line) shows robust increase in the red signal in spite of variations in the green channel caused by axial displacement of the virus. Thick lines were obtained by smoothing raw fluorescence intensity data (thin lines). Cell contours are shown by dashed lines in A and D. See also corresponding movies S1, S2 and S3.
Figure 3
Figure 3. Analyses of the extent and kinetics of single IAV lipid mixing events.
(A) The fraction of AF488-labeled particles undergoing lipid mixing in A549 transduced with an empty vector or IFITM3 and in MDCK cells. Control experiments in A549 cells were carried out in the presence of NH4Cl. Error bars are SEM from 11 independent experiments. ***, P<0.001. (B) The distribution of waiting times for onset of IAV lipid mixing in A549 and MDCK cells transduced with IFITM3 or an empty vector. The time intervals from shifting to 37°C to the onset of vDiD dequenching were determined, as described in Materials and Methods, and plotted as normalized fraction of events as a function of time. Pairwise comparison of all curves yields P>0.2. (C) Ensemble averages of initial vDiD dequenching profiles. The dequenching traces were aligned at the onset of hemifusion and averaged for each time point. Error bars are SEM. (D) The extent of vDiD dequenching was calculated based on I2/I1 ratio, as illustrated in Fig. 2B.
Figure 4
Figure 4. IFITM3 blocks fusion pore formation between single influenza viruses and endosomes.
Pseudoviruses bearing WSN HA and NA glycoproteins were co-labeled with HIV-1 Gag-iCherry (viral content marker, red) and YFP-Vpr (viral core marker, green). Viruses were pre-bound in the cold to A549-Vector cells (A, B) or MDCK-Vector cells (C, D) and their entry was initiated by raising the temperature. (A, C) Images of IAVpp are extended projections of 3 Z-stacks illustrating the loss of the mCherry signal (arrow) upon virus-endosome fusion. A schematic illustration between image panels A and C illustrates fusion between the YFP-Vpr (green) and Gag-iCherry (red) labeled IAVpp and an endosome (gray). (B, D) Mean mCherry and YFP fluorescence intensities obtained by tracking the particles shown in panels A and C. (E) Normalized efficiencies of IAVpp fusion (content release) with A549 and MDCK cells transduced with an empty vector or with IFITM3. The middle bar shows the lack of mCherry release in A549-Vector cells in the presence of NH4Cl. ***, P<0.001. See movies S4 and S5.
Figure 5
Figure 5. IFITM3 restriction of IAV fusion with A549 cells is not related to cholesterol accumulation in endosomes.
(A) Sub-cellular distributions of cholesterol and IFITM3 in A549-Vector and A549-IFITM3 cells. Cholesterol and IFITM3 staining was done using filipin and anti-IFITM3 antibody, respectively. Images show confocal slices through the middle section of cells. (B) Filipin staining of A549 cells transduced with shRNA against NPC1 (upper panel) and of cells pretreated with 10 µM U18666A for 18 h (lower panel). (C) Intracellular filipin and IFITM3 signals are poorly correlated. Individual regions of interests within 91 cells were drawn to exclude plasma membrane fluorescence, followed by background subtraction and summation of fluorescence intensity within each region of interest. (D) Western blotting analysis of NPC1 expression in A549 cells transduced with scrambled shRNA (A549.shScr) or with shRNA specific to NPC1 (A549.shNPC1). Tubulin was used as a loading control. (E) IAVpp, VSVpp and EBOVpp fusion with A549.shScr and A549.shNPC1 cells measured by the BlaM assay. Data are means and SEM from 2 triplicate experiments (IAVpp and VSVpp) and 1 triplicate experiment (EBOVpp). (F) Single IAV lipid mixing activity in A549.shScr and A549.shNPC1 cells. Cells were allowed to bind AF488- and vDiD-labeled IAV in the cold and incubated at 37°C for 1 h. The number of vDiD dequenching events was normalized to the total number of cell-bound particles from two experiments (n>690 particles) for each cell line. Error bars are standard deviations. (G) Dose-dependence of U18666A effect on viral fusion. A549 cells were pre-incubated for 18 h with indicated concentrations of U18666A or DMSO (control). BlaM-Vpr-carrying pseudoviruses (MOI = 1) were allowed to fuse with cells for 90 min at 37°C in the presence of U18666A or DMSO. Data are means and SEM from 2 triplicate experiments. **, P = 0.005.
Figure 6
Figure 6. IFITM3-mediated restriction of IAV fusion is not related to cholesterol accumulation in endosomes of MDCK cells.
(A) Sub-cellular distributions of cholesterol (filipin staining) and IFITM3 (antibody staining) in MDCK-Vector and MDCK-IFITM3 cells. Images show confocal sections through the middle of cells. (B) Filipin staining of MDCK cells pretreated with 20 µM U18666A for 18 h or mock-treated cells. (C) Dose-dependence of U18666A effect on viral fusion. MDCK-Vector cells were pretreated for 18 h with indicated concentrations of U18666A or DMSO (control). BlaM-Vpr-carrying pseudoviruses (MOI = 1) were allowed to fuse with cells for 90 min at 37°C in the presence of U18666A or DMSO. Data are means and SEM from 2 triplicate experiments. (D–F) pH distributions in IAV-carrying endosomes of MDCK cells measured using AF488- and CypHer5E-labeled viruses. Viruses were pre-bound to cells in the cold and incubated at 37°C for 45 min before acquiring images. Calculated pH values are shown for MDCK cells without (D) and with pretreatment with 20 µM U18666A for 18 h (E), as well as for MDCK-IFITM3 cells (F). Data are from 10 image fields each.
Figure 7
Figure 7. Cholesterol accumulation in endosomes of CHO cells does not inhibit viral fusion.
(A) Filipin staining of untreated and U18666A-treated (40 µM) CHO cells and of CHO-NPC1 cells devoid of NPC1. (B) Filipin staining of CHO-Vector and CHO-IFITM3 cells. Images in panels A and B show confocal sections through the middle of cells. (B) Confocal images of CHO-Vector and CHO-IFITM3 cells stained with filipin. (C) IAVpp (MOI = 2), VSVpp (MOI = 1) or EBOVpp (MOI = 2) were pre-bound to CHO or CHO-NPC1 cells in the cold, incubated at 37°C for 90 min, and the resulting fusion activity was measured by the BlaM assay. Results are plotted as the relative extents of fusion CHO-NPC1 cells after normalizing to fusion with CHO cells. Control experiments were carried out in 70 mM NH4Cl. Data are means and SEM from 3 triplicate experiments. (D) The frequency of lipid mixing in CHO (n = 576) and CHO-NPC1 cells (n = 1241). Pre-treatment with 0.2 µM BafA1 for 30 min followed by initiation with imaging buffer containing BafA1and 70 mM NH4Cl inhibited the fusion activity: only 4 out of 1532 particles underwent lipid mixing. Error bars are standard deviations from at least 4 experiments. (E) Pretreatment of CHO cells with U18666A (40 µM, 8 h) modestly diminishes IAVpp or VSVpp fusion and abrogates EBOVpp fusion, as measured by the BlaM assay. Data are means and SEM from 2 triplicate experiments. ***, P<0.001; **, P<0.02.
Figure 8
Figure 8. Models for IFITM3-mediated restriction of IAV infection.
Purple arrows illustrate possible mechanisms of the IAV restriction by IFITM3: direct (Pathway 1) and indirect (Pathway 2) inhibition of transition from hemifusion to full fusion at the limiting membrane of an endosomes, as well as non-productive IAV fusion with ILVs in the absence of back fusion (Pathway 3). Partial dilution/dequenching of viral vDiD upon hemifusion/fusion is shown by lighter red color and full dequenching is shown by light red glow. Alternative endosomal localizations of IFITM3 (limiting membrane vs. ILVs) are shown. Dashed black arrow illustrates possible IAV fusion pathway in cells expressing low, endogenous levels of IFITM3.

References

    1. Diamond MS, Farzan M (2013) The broad-spectrum antiviral functions of IFIT and IFITM proteins. Nat Rev Immunol 13: 46–57. - PMC - PubMed
    1. Brass AL, Huang IC, Benita Y, John SP, Krishnan MN, et al. (2009) The IFITM proteins mediate cellular resistance to influenza A H1N1 virus, West Nile virus, and dengue virus. Cell 139: 1243–1254. - PMC - PubMed
    1. Perreira JM, Chin CR, Feeley EM, Brass AL (2013) IFITMs Restrict the Replication of Multiple Pathogenic Viruses. J Mol Biol 425: 4937–55 doi:10.1016/j.jmb.2013.09.024 - DOI - PMC - PubMed
    1. Mudhasani R, Tran JP, Retterer C, Radoshitzky SR, Kota KP, et al. (2013) IFITM-2 and IFITM-3 but not IFITM-1 restrict Rift Valley fever virus. J Virol 87: 8451–8464. - PMC - PubMed
    1. Li K, Markosyan RM, Zheng YM, Golfetto O, Bungart B, et al. (2013) IFITM proteins restrict viral membrane hemifusion. PLoS Pathog 9: e1003124. - PMC - PubMed

Publication types

MeSH terms