

Effects of frequency compression and frequency transposition on fricative and affricate perception in listeners with normal hearing and mild to moderate hearing loss
- PMID: 24699702
- PMCID: PMC4141891
- DOI: 10.1097/AUD.0000000000000040
Effects of frequency compression and frequency transposition on fricative and affricate perception in listeners with normal hearing and mild to moderate hearing loss
Abstract
Objectives: The authors have demonstrated that the limited bandwidth associated with conventional hearing aid amplification prevents useful high-frequency speech information from being transmitted. The purpose of this study was to examine the efficacy of two popular frequency-lowering algorithms and one novel algorithm (spectral envelope decimation) in adults with mild to moderate sensorineural hearing loss and in normal-hearing controls.
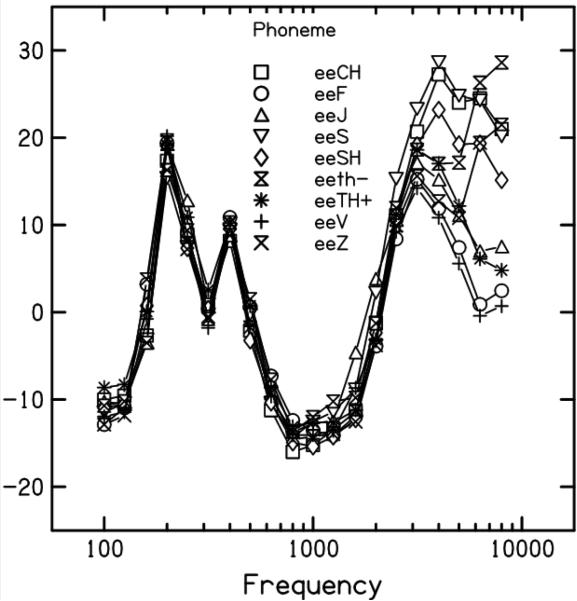
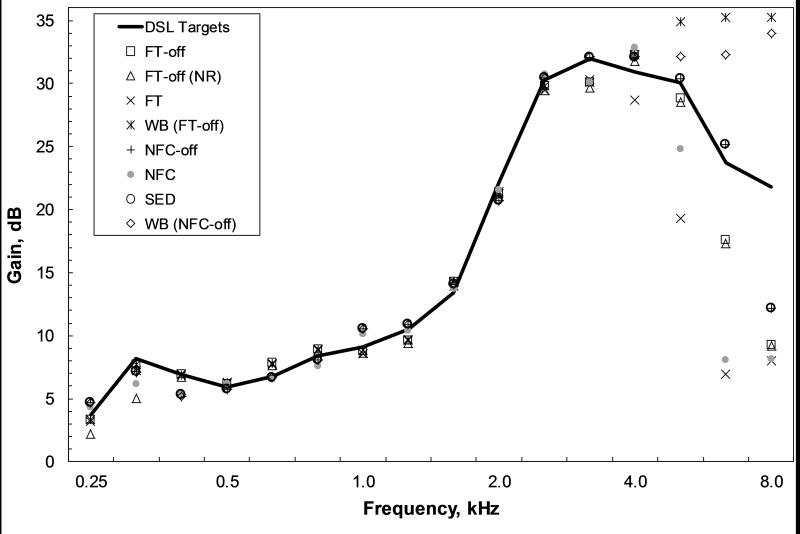
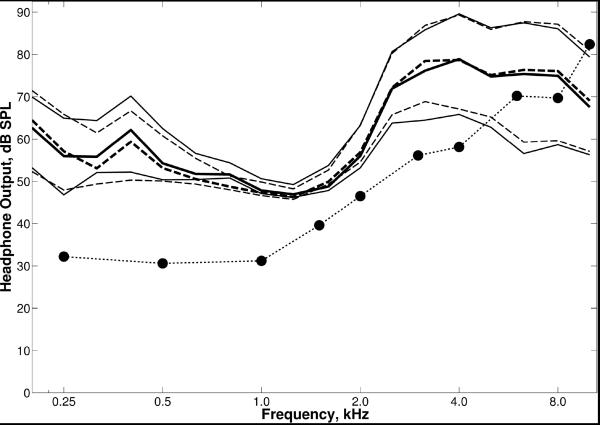
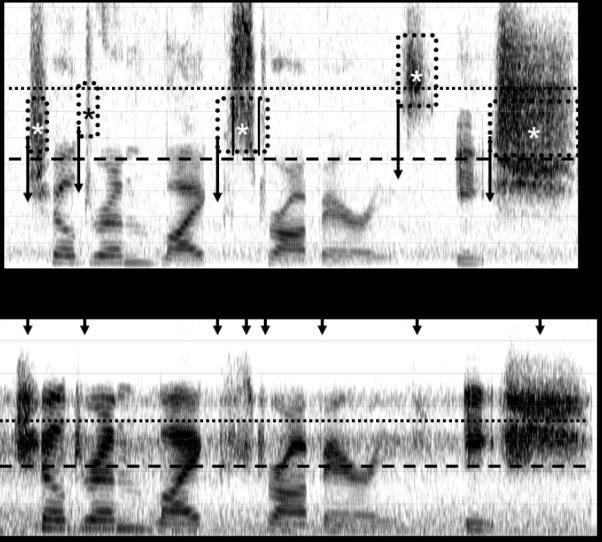
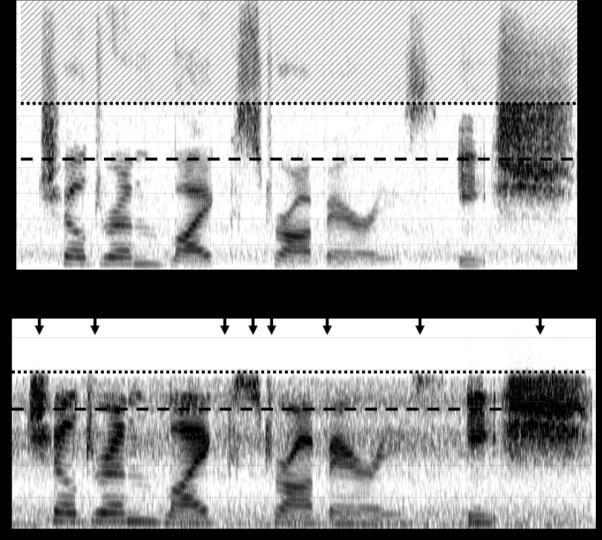
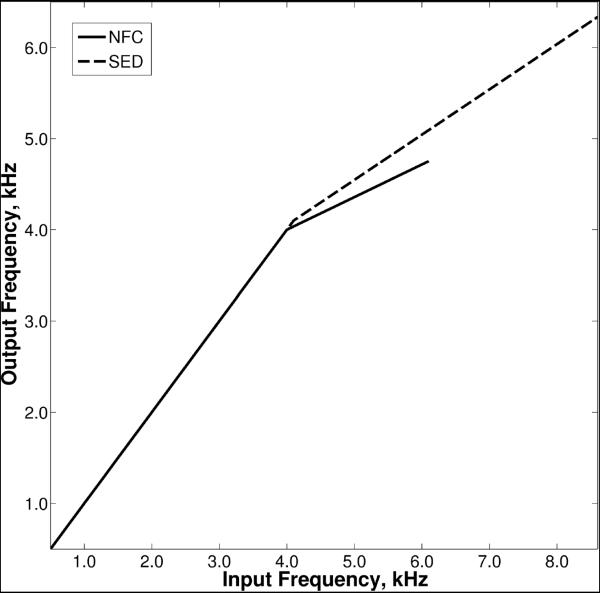
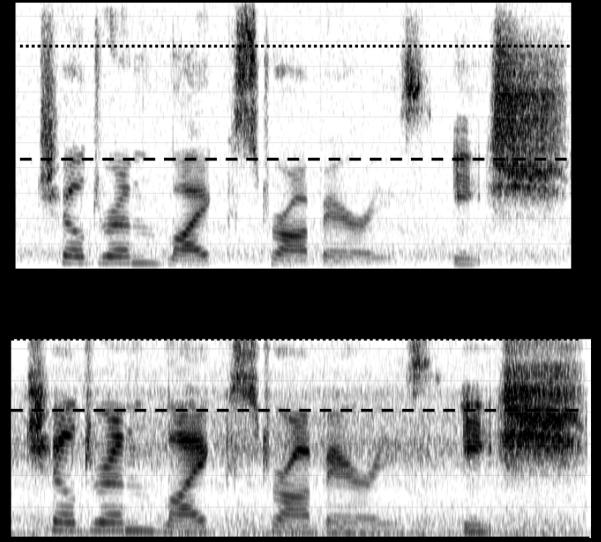
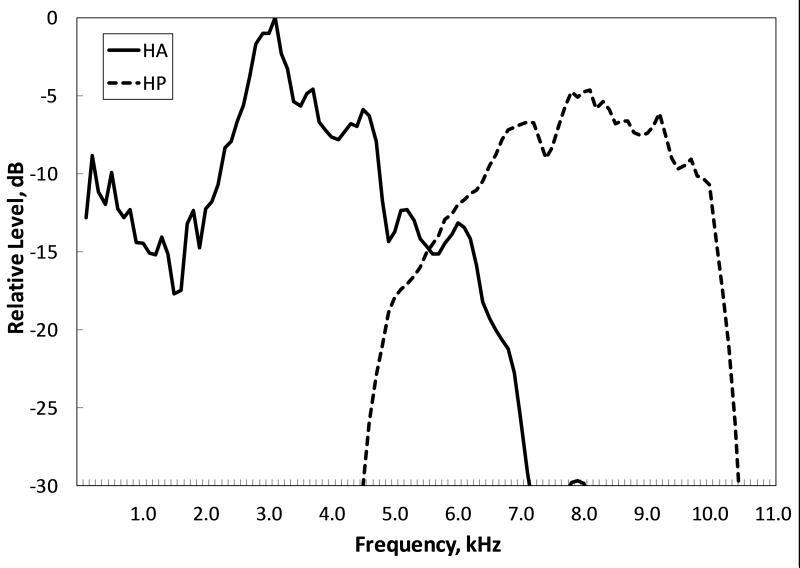
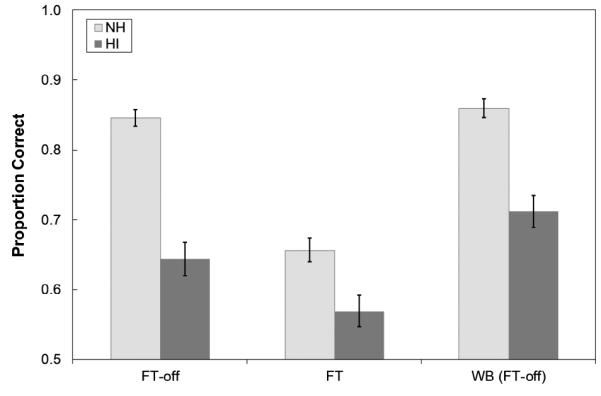
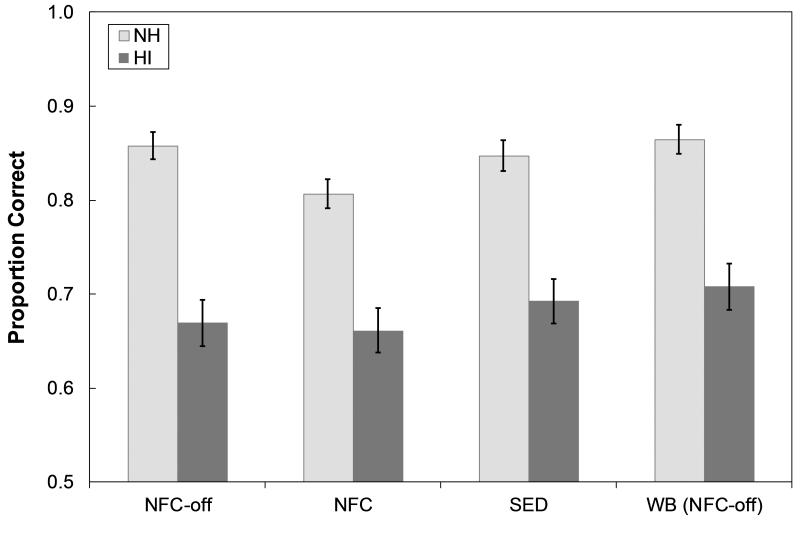
Design: Participants listened monaurally through headphones to recordings of nine fricatives and affricates spoken by three women in a vowel-consonant context. Stimuli were mixed with speech-shaped noise at 10 dB SNR and recorded through a Widex Inteo IN-9 and a Phonak Naída UP V behind-the-ear (BTE) hearing aid. Frequency transposition (FT) is used in the Inteo and nonlinear frequency compression (NFC) used in the Naída. Both devices were programmed to lower frequencies above 4 kHz, but neither device could lower frequencies above 6 to 7 kHz. Each device was tested under four conditions: frequency lowering deactivated (FT-off and NFC-off), frequency lowering activated (FT and NFC), wideband (WB), and a fourth condition unique to each hearing aid. The WB condition was constructed by mixing recordings from the first condition with high-pass filtered versions of the source stimuli. For the Inteo, the fourth condition consisted of recordings made with the same settings as the first, but with the noise-reduction feature activated (FT-off). For the Naída, the fourth condition was the same as the first condition except that source stimuli were preprocessed by a novel frequency compression algorithm, spectral envelope decimation (SED), designed in MATLAB, which allowed for a more complete lowering of the 4 to 10 kHz input band. A follow-up experiment with NFC used Phonak's Naída SP V BTE, which could also lower a greater range of input frequencies.
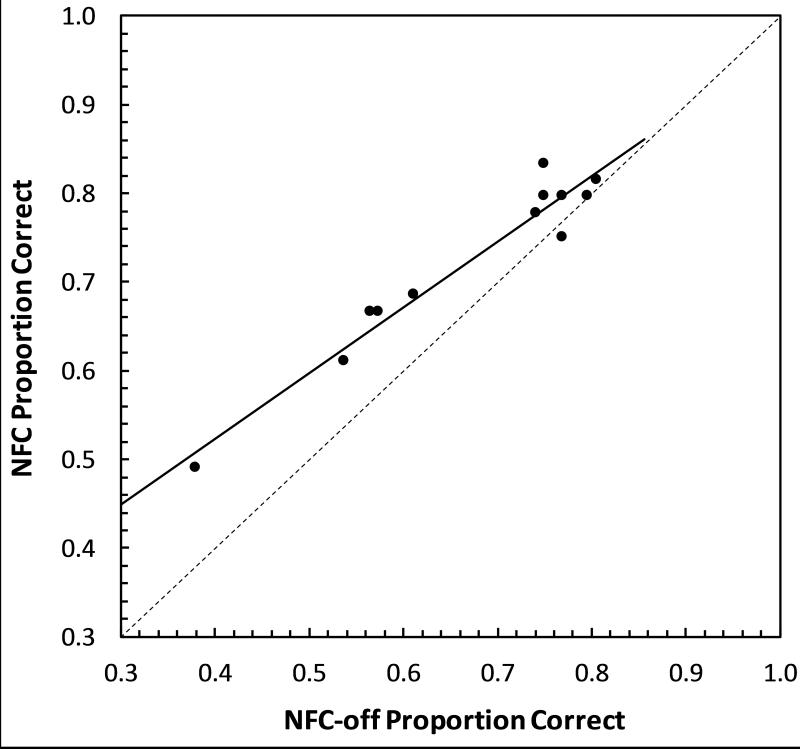
Results: For normal-hearing and hearing-impaired listeners, performance with FT was significantly worse compared with that in the other conditions. Consistent with previous findings, performance for the hearing-impaired listeners in the WB condition was significantly better than in the FT-off condition. In addition, performance in the SED and WB conditions were both significantly better than in the NFC-off condition and the NFC condition with 6 kHz input bandwidth. There were no significant differences between SED and WB, indicating that improvements in fricative identification obtained by increasing bandwidth can also be obtained using this form of frequency compression. Significant differences between most conditions could be largely attributed to an increase or decrease in confusions for the phonemes /s/ and /z/. In the follow-up experiment, performance in the NFC condition with 10 kHz input bandwidth was significantly better than NFC-off, replicating the results obtained with SED. Furthermore, listeners who performed poorly with NFC-off tended to show the most improvement with NFC.
Conclusions: Improvements in the identification of stimuli chosen to be sensitive to the effects of frequency lowering have been demonstrated using two forms of frequency compression (NFC and SED) in individuals with mild to moderate high-frequency sensorineural hearing loss. However, negative results caution against using FT for this population. Results also indicate that the advantage of an extended bandwidth as reported here and elsewhere applies to the input bandwidth for frequency compression (NFC/SED) when the start frequency is ≥4 kHz.
Figures
References
-
- Alexander JM. Individual variability in recognition of frequency-lowered speech. Semin. Hear. 2013a;34:86–109.
-
- Alexander J. 20Q: The Highs and lows of frequency lowering amplification. AudiologyOnline. 2013b Article #11772.
-
- Allen JB. Short term spectral analysis, synthesis, and modification by discrete Fourier transform. IEEE ASSP. 1977;25:235–238.
-
- ANSI . ANSI S3.6-1996, American National Standards specification for audiometers. American National Standards Institute; New York: 1996.
-
- ANSI . ANSI S3.5-1997, The calculation of the speech intelligibility index. American National Standards Institute; New York: 1997.
REFERENCE NOTE
-
- Alexander JM. Poster presented at the annual meeting of the American Auditory Society. Scottsdale, AZ: Mar 8-10, 2012. 2012. Nonlinear frequency compression: Balancing start frequency and compression ratio.
Publication types
MeSH terms
Grants and funding
LinkOut - more resources
Full Text Sources
Other Literature Sources
Medical
Miscellaneous
