Randomized Controlled Trial
. 2014 Jun;24(3):119-26.
doi: 10.1007/s10286-014-0237-y. Epub 2014 Apr 4.

Normothermic central hypovolemia tolerance reflects hyperthermic tolerance

Affiliations
Randomized Controlled Trial

Normothermic central hypovolemia tolerance reflects hyperthermic tolerance

Zachary J Schlader et al. Clin Auton Res. 2014 Jun.

Abstract

Purpose: To test the hypothesis that those who are highly tolerant to lower body negative pressure (LBNP) while normothermic are also highly tolerant to this challenge while hyperthermic.

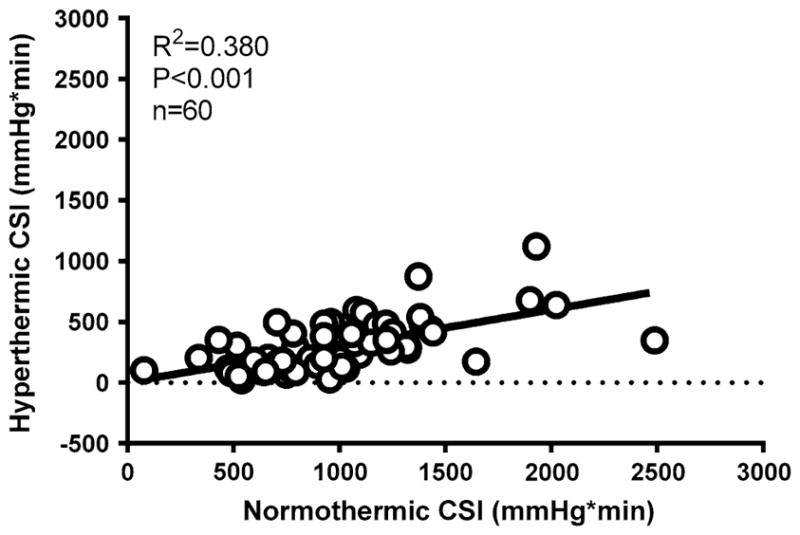
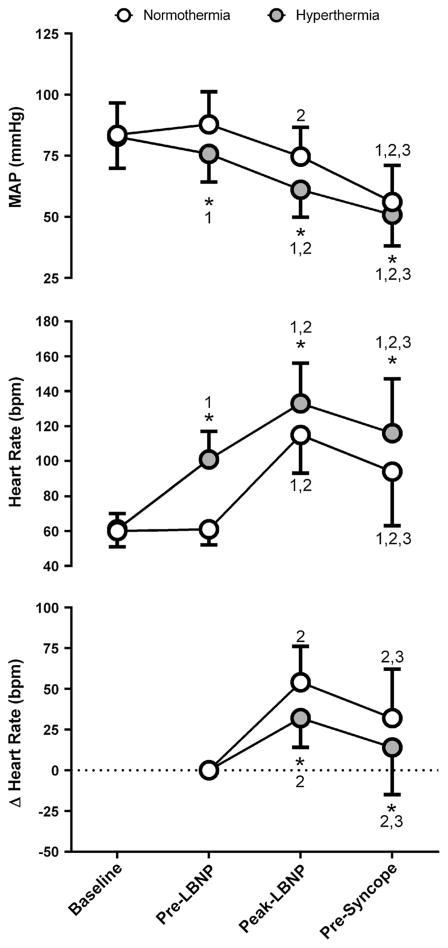
Methods: Sixty pairs of normothermic and hyperthermic LBNP tests to pre-syncope were evaluated. LBNP tolerance was quantified via the cumulative stress index (CSI), which is calculated as the sum of the product of the LBNP level and the duration of each level until test termination (i.e., 20 mmHg × 3 min + 30 mmHg × 3 min, etc.). CSI was compared between normothermic and hyperthermic trials. Internal and skin temperatures, heart rate, and arterial pressure were measured throughout.

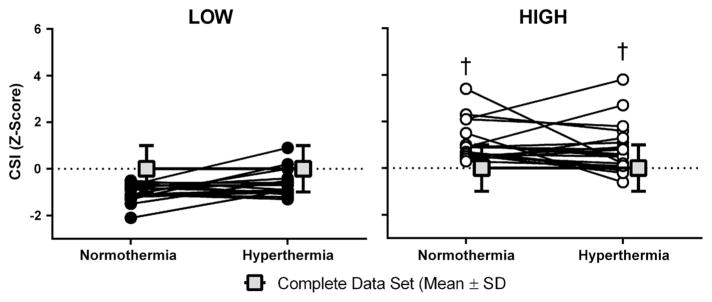
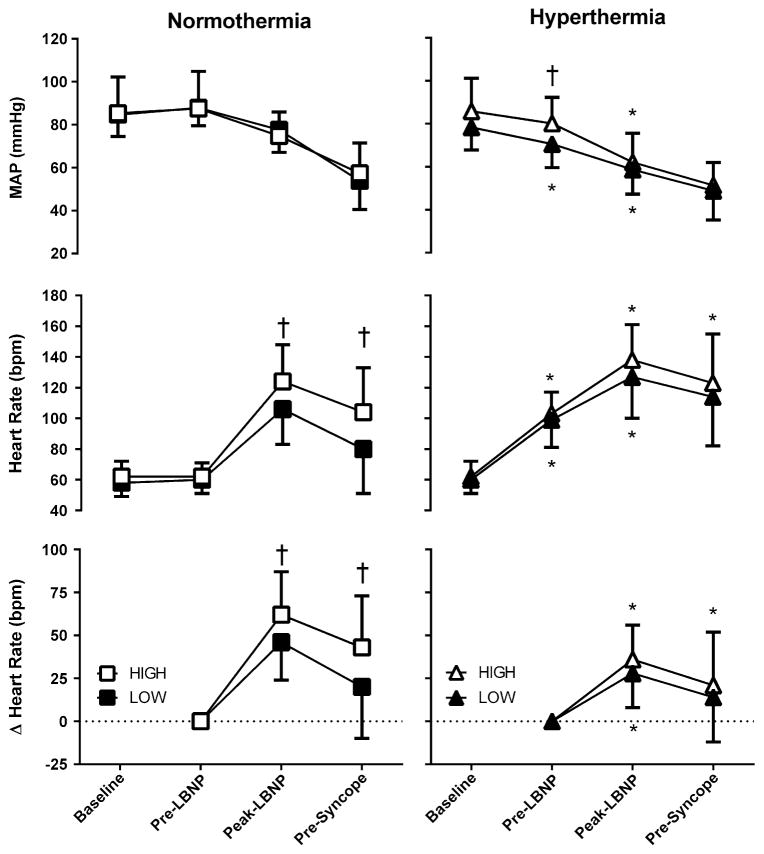
Results: Hyperthermia reduced (P < 0.001) CSI from 997 ± 437 to 303 ± 213 mmHg min. There was a positive correlation between normothermic and hyperthermic LBNP tolerance (R (2) = 0.38; P < 0.001). As a secondary analysis, the 20 trials with the highest LBNP tolerance while normothermic were identified (indicated as the HIGH group; CSI 1,467 ± 356 mmHg min), as were the 20 trials with the lowest normothermic tolerance (indicated as the LOW group; CSI 565 ± 166 mmHg min; P < 0.001 between groups). While hyperthermia unanimously reduced CSI in both HIGH and LOW groups, in this hyperthermic condition CSI was ~threefold higher in the HIGH group (474 ± 226 mmHg min) relative to the LOW group (160 ± 115 mmHg min; P < 0.001).

Conclusions: LBNP tolerance while hyperthermic is related to normothermic tolerance and, associated with this finding, those who have a high LBNP tolerance while normothermic remain relatively tolerant when hyperthermic.


Conflict of interest statement

Conflict of interest

There are no known conflicts of interest.

Figures

Fig. 1
Fig. 1
Correlation between normothermic lower body negative pressure (LBNP) tolerance [i.e., the cumulative stress index (CSI)] and hyperthermic LBNP tolerance
Fig. 2
Fig. 2
Mean arterial pressure (MAP; top), heart rate (middle), and the change (Δ) in heart rate from Pre-LBNP (bottom) during normothermic and hyperthermic LBNP at Baseline, Pre-LBNP, Peak-LBNP, and immediately prior to LBNP termination (Pre-Syncope) (mean ± SD). Asterisks indicate different from normothermia (P ≤ 0.029); 1, 2, and 3 indicate different from Baseline, Pre-LBNP, and Peak-LBNP, respectively (P ≤ 0.018). Peak-LBNP is the period with the highest heart rate achieved during the final 2 min of LBNP (i.e., prior to any bradycardia associated with progressive LBNP)
Fig. 3
Fig. 3
Individual changes in standardized (i.e., Z-score) LBNP tolerance [indexed from the cumulative stress index (CSI)] from normothermia to hyperthermia in the 20 observations with the lowest (LOW) and highest (HIGH) normothermic tolerance. The mean data from the complete data set are also depicted (n = 60 pairs; gray squares). These data indicate that during hyperthermia the HIGH group remained relatively tolerant (mean value above 0), while the LOW group remained relatively intolerant (mean value below 0). Dagger indicates HIGH group is different from LOW group (P<0.001). Mean (±SD) for each group within each condition is reported in text. An explanation of the Z-score, its interpretation, and how it was calculated is presented in “Methods”
Fig. 4
Fig. 4
Mean arterial pressure (MAP; top), heart rate (middle), and the change (Δ) in heart rate from Pre-LBNP (bottom) at Baseline, Pre-LBNP, Peak-LBNP, and immediately prior to LBNP termination (Pre- Syncope) in the 20 observations with the lowest (LOW) and highest (HIGH) normothermic tolerance during normothermia (on left) and hyperthermia (on right) (mean ± SD). Dagger indicates different from LOW (P ≤ 0.022); asterisks indicate different from normothermia for the respective group (P ≤ 0.013). Peak-LBNP is the period with the highest heart rate achieved during the final 2 min of LBNP (i.e., prior to any bradycardia associated with progressive LBNP)

Similar articles

Cited by

References

    1. Aratow M, Fortney SM, Watenpaugh DE, Crenshaw AG, Hargens AR. Transcapillary fluid responses to lower body negative pressure. J Appl Physiol (1985) 1993;74:2763–2770. - PubMed
    1. Brake DJ, Bates GP. Deep body core temperatures in industrial workers under thermal stress. J Occup Environ Med. 2002;44:125–135. - PubMed
    1. Brothers RM, Keller DM, Wingo JE, Ganio MS, Crandall CG. Heat-stress-induced changes in central venous pressure do not explain interindividual differences in orthostatic tolerance during heat stress. J Appl Physiol. 2011;110:1283–1289. - PMC - PubMed
    1. Brothers RM, Wingo JE, Hubing KA, Crandall CG. The effects of reduced end-tidal carbon dioxide tension on cerebral blood flow during heat stress. J Physiol-Lond. 2009;587:3921–3927. - PMC - PubMed
    1. Buller MJ, Welles AP, Stower J, Desantis C, Margolis L, Karis AJ, Economos D, Hoyt RW, Richter MW. Thermal work strain during marine rifle squad operations in Afghanistan (March 2010) USARIEM Technical Report 2010 - PubMed

Publication types

LinkOut - more resources