. 2014 May 16;289(20):13937-47.
doi: 10.1074/jbc.M113.534594. Epub 2014 Apr 3.

Critical role of aquaporins in interleukin 1β (IL-1β)-induced inflammation

Affiliations

Critical role of aquaporins in interleukin 1β (IL-1β)-induced inflammation

Virginie Rabolli et al. J Biol Chem. .

Abstract

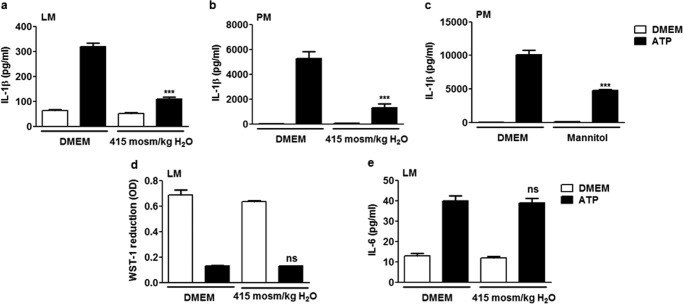
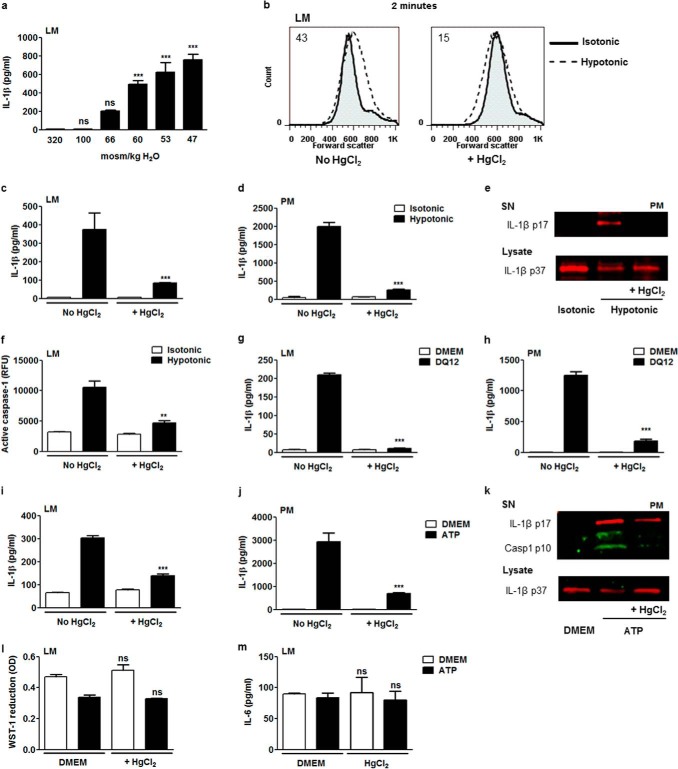
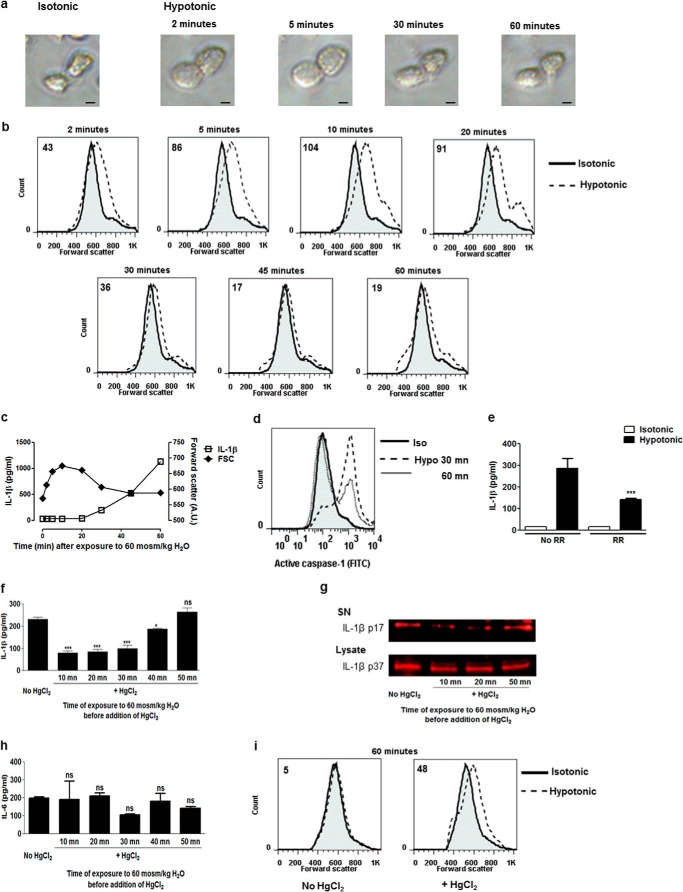
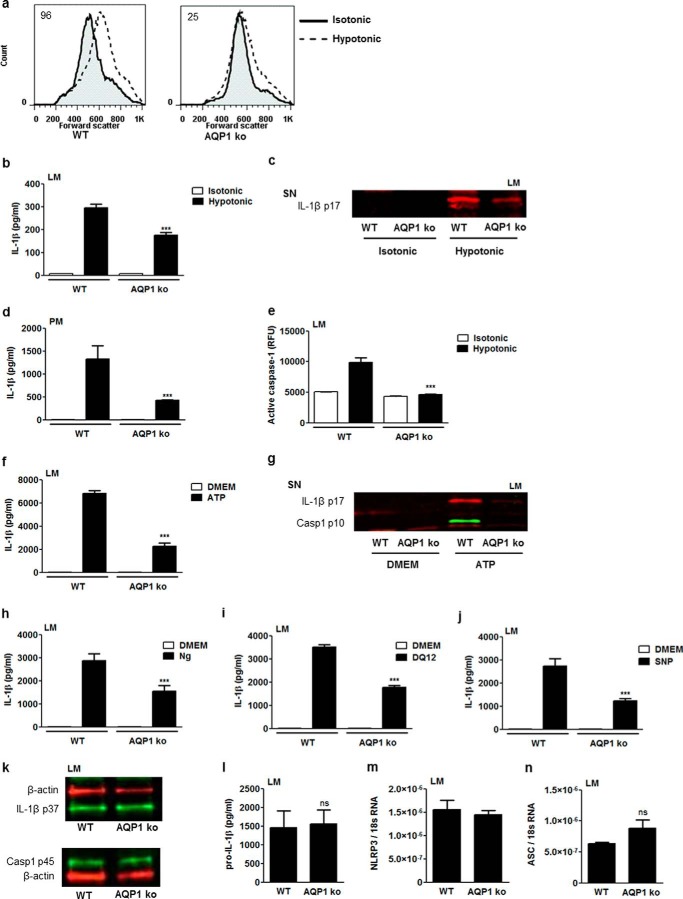
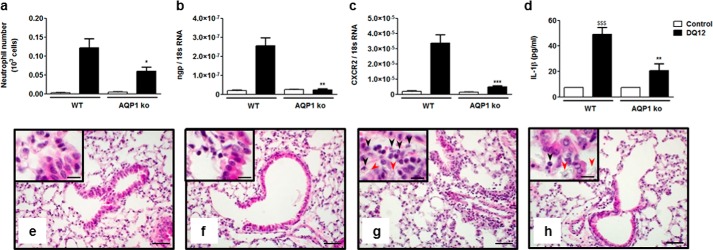
Rapid changes in cell volume characterize macrophage activation, but the role of water channels in inflammation remains unclear. We show here that, in vitro, aquaporin (AQP) blockade or deficiency results in reduced IL-1β release by macrophages activated with a variety of NLRP3 activators. Inhibition of AQP specifically during the regulatory volume decrease process is sufficient to limit IL-1β release by macrophages through the NLRP3 inflammasome axis. The immune-related activity of AQP was confirmed in vivo in a model of acute lung inflammation induced by crystals. AQP1 deficiency is associated with a marked reduction of both lung IL-1β release and neutrophilic inflammation. We conclude that AQP-mediated water transport in macrophages constitutes a general danger signal required for NLRP3-related inflammation. Our findings reveal a new function of AQP in the inflammatory process and suggest a novel therapeutic target for anti-inflammatory therapy.

Keywords: Aquaporin; Caspase; Cell Swelling; Inflammasome; Inflammation; Interleukin; RVD; Water Channel.


Figures

FIGURE 1.
FIGURE 1.
Water entry is necessary for IL-1β release in macrophages. Release of IL-1β by lung macrophages (LM) (a) or peritoneal macrophages (PM) (b) primed with LPS (0.1 μg/ml, overnight) and subsequently exposed or not exposed to ATP (5 mm) with addition or no addition of NaCl to the medium (415 mosmol/kg H2O). n = 4 replicates/condition. c, release of IL-1β by peritoneal macrophages exposed or not exposed to ATP (5 mm) with addition or no addition of mannitol to the medium (200 mm). n = 3 or 4. d, mitochondrial activity assessed by optical density (OD) of reduced WST-1 and release of IL-6 by lung macrophages exposed or not exposed to ATP (5 mm) with addition or no addition of NaCl to the medium (e). n = 3 or 4. Data are means ± S.E. ***, p < 0.001 upon exposure to hypotonic ATP with or without NaCl or mannitol addition; ns, no significant difference. p values were calculated by Student Newman-Keuls test.
FIGURE 2.
FIGURE 2.
AQP-facilitated water transport induces NLRP3 inflammasome-related caspase-1 activation and mature IL-1β release. a, IL-1β release by lung macrophages (LM) primed with LPS (0.1 μg/ml) exposed to isotonic (320 mosmol/kg H2O) or hypotonic medium (100 mosmol/kg H2O to 47 mosmol/kg H2O). n = 3 replicates/condition. b, flow cytometry forward scatter plots of lung macrophages subjected or not subjected to hypotonic shock (60 mosmol/kg H2O) in the absence or presence of HgCl2 (10 μm). Values indicated in the plots are differences between median forward scatter of cells exposed or not exposed to hypotonic shock. Levels of released IL-1β by lung (c) or peritoneal macrophages (PM) (d) exposed or not exposed to hypotonic shock (in the absence or presence of HgCl2 (10 μm). n = 3. e, Western blot analysis of mature IL-1β (IL-1β p17) in the supernatant (SN) and pro-IL-1β (IL-1β p37) in cell lysate of peritoneal macrophages exposed or not exposed to hypotonic shock in the absence or presence of HgCl2. f, fluorimetric measurement of cellular active caspase 1 in lung macrophages exposed or not exposed to hypotonic shock in the absence or presence of HgCl2 (10 μm). n = 3 or 4. Release of IL-1β by lung (g) or peritoneal macrophages (h) exposed or not exposed to silica (400 μg/ml) in the absence or presence of HgCl2 (10 μm)). n = 3 or 4. IL-1β release by lung (i) or peritoneal macrophages (j) exposed or not exposed to ATP (5 mm) in the absence or presence of HgCl2. n = 3 or 4. k, Western blot analysis of mature IL-1β and active caspase 1 (Casp1 p10) in the supernatant and pro-IL-1β in cell lysate of peritoneal macrophages exposed or not exposed to ATP in the absence or presence of HgCl2. l, mitochondrial activity assessed by optical density (OD) of reduced WST-1 and release of IL-6 by lung macrophages exposed or not exposed to ATP (5 mm) in the absence or presence of HgCl2 (10 μm) (m). n = 3 or 4. Data are means ± S.E. **, p < 0.01; ***, p < 0.001 upon exposure to hypotonic medium or ATP or no exposure, with HgCl2 or no exposure; ns, no significant difference. p values were calculated by Student Newman-Keuls test.
FIGURE 3.
FIGURE 3.
AQPs mediate IL-1β activation during the cell volume reduction process in macrophages. Shown are optical microscopy (Scale bar = 4 μm) (a) and flow cytometry forward scatter plots (b) of lung macrophages primed with LPS (0.1 μg/ml) at different time points after hypotonic shock (60 mosmol/kg H2O). Values indicated in the flow cytometry plots are differences between median forward scatter of cells exposed or not exposed to hypotonic shock. c, IL-1β release (left y axis) and flow cytometry forward scatter (FCS) (right y axis) of lung macrophages at different time points after hypotonic shock. n = 4 replicates/condition. d, flow cytometry plot of intracellular active caspase 1 content in lung macrophages 30 or 60 min after hypotonic (Hypo) shock (Iso, isotonic). Shown is the IL-1β release by lung macrophages 1 h after hypotonic shock in the absence or presence of Ruthenium Red (RR, 30 μm) (e) or HgCl2 (10 μm, added 10, 20, 30, 40, or 50 min after hypotonic shock) (f). n = 3 or 4. g, Western blot analysis of mature IL-1β (IL-1β p17) in the supernatant (SN) and pro-IL-1β (IL-1β p37) in cell lysate of lung macrophages exposed or not exposed to hypotonic shock in the absence or presence of HgCl2 (10 μm, added 10, 20, or 50 min after hypotonic shock). h, IL-6 release by lung macrophages 1 h after hypotonic shock in the absence or presence of HgCl2 (10 μm, added 10, 20, 30, 40, or 50 min after hypotonic shock). n = 3 or 4. i, flow cytometry forward scatter plots of lung macrophages 1 h after hypotonic shock in the presence or absence of HgCl2 (10 μm, added 10 min after hypotonic shock). The values indicated in the plots are differences between median forward scatter of cells exposed or not exposed to hypotonic shock. Data are means ± S.E. *, p < 0.05; ***, p < 0.001 upon exposure to hypotonic medium with Ruthenium Red or HgCl2 or no exposure; ns, no significant difference. p values were calculated by Student Newman-Keuls test.
FIGURE 4.
FIGURE 4.
AQP1 contributes to swelling, caspase 1 activation, and mature IL-1β release in macrophages. a, flow cytometry forward scatter plots of WT or AQP1 KO lung macrophages (LM) primed with LPS (0.1 μg/ml) and subsequently subjected or not subjected to hypotonic shock (60 mosmol/kg H2O). The values indicated in plots are differences between median forward scatter of cells exposed or not exposed to hypotonic shock. b, IL-1β released by WT and AQP1 KO lung macrophages exposed or not exposed to hypotonic medium for 1 h. n = 3 replicates/condition. c, Western blot analysis of mature IL-1β (IL-1β p17) in the supernatant (SN) of WT and AQP1 KO lung macrophages exposed or not exposed to hypotonic medium. d, IL-1β released by WT and AQP1 KO peritoneal macrophages (PM) exposed or not exposed to hypotonic medium (100 mosmol/kg H2O) for 1 h. n = 3. e, fluorimetric measurement of cellular active caspase 1 in WT and AQP1 KO lung macrophages exposed or not exposed to hypotonic medium (60 mosmol/kg H2O) for 1 h. n = 3. f, IL-1β release by WT and AQP1 KO lung macrophages primed with LPS (0.1 μg/ml) and subsequently exposed or not exposed to ATP (5 mm). n = 3 or 4. g, Western blot analysis of mature IL-1β and active caspase 1 (Casp1 p10) in the supernatant of WT and AQP1 KO lung macrophages exposed or not exposed to ATP. Shown is the IL-1β release by WT and AQP1 KO lung macrophages primed with LPS (0.1 μg/ml) and subsequently exposed or not exposed to nigericin (Ng, 20 μm) (h), silica (DQ12, 400 μg/ml) (i), or SNP (100 μg/ml) (j). n = 3 or 4. k, Western blot analysis of intracellular pro-IL-1β (IL-1β p37), procaspase 1 (Casp1 p45), and β-actin in LPS-primed WT and AQP1-deficient lung macrophages. l, intracellular levels of pro-IL-1β in WT and AQP1 KO lung macrophages, quantified by ELISA. n = 3 or 4. Expression of NLRP3 (m) and ASC transcripts (n) quantified by quantitative RT-PCR in WT and AQP1 KO lung. n = 3 or 4. Data are means ± S.E. ***, p < 0.001 in WT or AQP1 KO cells; ns, no significant difference. p values were calculated by Student Newman-Keuls test.
FIGURE 5.
FIGURE 5.
Acute lung inflammatory response to silica particles is reduced in AQP1-deficient mice. a, number of alveolar neutrophils (GR1+ cells) assessed by flow cytometry and expression of the pulmonary neutrophilic markers ngp (b) and CXCR2 (c) quantified by quantitative RT-PCR in WT and AQP1 KO mice 6 h after instillation of silica (DQ12, 2.5 mg) or no instillation (control). d, levels of mature IL-1β in BAL fluid collected 6 h after instillation of silica or no instillation. Data are means ± S.E. n = 3 to 6 animals/condition. e–h, hematoxylin and eosin-stained lung sections obtained from WT (e and g) or AQP1 KO mice (f and h), collected 6 h after instillation of silica (g and h) or no instillation (e and f). Black arrows identify neutrophils, and red arrows identify silica deposition. Scale bars = 50 μm (large panels) and 20 μm (insets). *, p < 0.05; **, p < 0.01; ***, p < 0.001 in silica-treated WT and AQP1 KO mice. p values were calculated by Student Newman-Keuls test.

Similar articles

Cited by

References

    1. Cassel S. L., Eisenbarth S. C., Iyer S. S., Sadler J. J., Colegio O. R., Tephly L. A., Carter A. B., Rothman P. B., Flavell R. A., Sutterwala F. S. (2008) The Nalp3 inflammasome is essential for the development of silicosis. Proc. Natl. Acad. Sci. U.S.A. 105, 9035–9040 - PMC - PubMed
    1. Thomas P. G., Dash P., Aldridge J. R., Jr., Ellebedy A. H., Reynolds C., Funk A. J., Martin W. J., Lamkanfi M., Webby R. J., Boyd K. L., Doherty P. C., Kanneganti T. D. (2009) The intracellular sensor NLRP3 mediates key innate and healing responses to influenza A virus via the regulation of caspase-1. Immunity 30, 566–575 - PMC - PubMed
    1. Hoshino T., Okamoto M., Sakazaki Y., Kato S., Young H. A., Aizawa H. (2009) Role of proinflammatory cytokines IL-18 and IL-1β in bleomycin-induced lung injury in humans and mice. Am. J. Respir. Cell Mol. Biol. 41, 661–670 - PMC - PubMed
    1. Cai S., Batra S., Wakamatsu N., Pacher P., Jeyaseelan S. (2012) NLRC4 inflammasome-mediated production of IL-1β modulates mucosal immunity in the lung against Gram-negative bacterial infection. J. Immunol. 188, 5623–5635 - PMC - PubMed
    1. Muñoz-Planillo R., Kuffa P., Martínez-Colón G., Smith B. L., Rajendiran T. M., Núñez G. (2013) K+ efflux is the common trigger of NLRP3 inflammasome activation by bacterial toxins and particulate matter. Immunity 38, 1142–1153 - PMC - PubMed

Publication types

MeSH terms

LinkOut - more resources