. 2014 Sep;60(3):908-18.
doi: 10.1002/hep.27085. Epub 2014 Jul 28.

Conjugated bile acids promote cholangiocarcinoma cell invasive growth through activation of sphingosine 1-phosphate receptor 2

Affiliations
Free PMC article

Conjugated bile acids promote cholangiocarcinoma cell invasive growth through activation of sphingosine 1-phosphate receptor 2

Runping Liu et al. Hepatology. 2014 Sep.
Free PMC article

Abstract

Cholangiocarcinoma (CCA) is an often fatal primary malignancy of the intra- and extrahepatic biliary tract that is commonly associated with chronic cholestasis and significantly elevated levels of primary and conjugated bile acids (CBAs), which are correlated with bile duct obstruction (BDO). BDO has also recently been shown to promote CCA progression. However, whereas there is increasing evidence linking chronic cholestasis and abnormal bile acid profiles to CCA development and progression, the specific mechanisms by which bile acids may be acting to promote cholangiocarcinogenesis and invasive biliary tumor growth have not been fully established. Recent studies have shown that CBAs, but not free bile acids, stimulate CCA cell growth, and that an imbalance in the ratio of free to CBAs may play an important role in the tumorigenesis of CCA. Also, CBAs are able to activate extracellular signal-regulated kinase (ERK)1/2- and phosphatidylinositol-3-kinase/protein kinase B (AKT)-signaling pathways through sphingosine 1-phosphate receptor 2 (S1PR2) in rodent hepatocytes. In the current study, we demonstrate S1PR2 to be highly expressed in rat and human CCA cells, as well as in human CCA tissues. We further show that CBAs activate the ERK1/2- and AKT-signaling pathways and significantly stimulate CCA cell growth and invasion in vitro. Taurocholate (TCA)-mediated CCA cell proliferation, migration, and invasion were significantly inhibited by JTE-013, a chemical antagonist of S1PR2, or by lentiviral short hairpin RNA silencing of S1PR2. In a novel organotypic rat CCA coculture model, TCA was further found to significantly increase the growth of CCA cell spheroidal/"duct-like" structures, which was blocked by treatment with JTE-013.

Conclusion: Our collective data support the hypothesis that CBAs promote CCA cell-invasive growth through S1PR2.


Figures

Fig 1
Fig 1
Differential expression of S1PRs in CCA cells. Total cellular RNA was isolated from (A) rat BDE1, (B) rat BDEsp, (C) rat BDEsp-TDEH10, (D) human HuCCT1, (E) CCLP1, and (F) SG231cells. mRNA levels of individual S1PRs were detected by real-time RT-PCR, as described in Materials and Methods, and normalized using β-actin or GAPDH as an internal control. Relative mRNA levels of S1PR2 and S1PR3 to S1PR1 (designated = 1) are shown. ***P < 0.001, compared to S1PR1; n = 3.
Fig 2
Fig 2
Differential expression of S1PRs in CCA cells and human CCA tissue. Total cell lysates of (A) human HuCCT1, CCLP1, and SG231 cells and (B) rat BDE1, BDEsp-TDEH10, and BDEsp-TDFE4 cells were prepared as previously described. Protein levels of S1PR1, S1PR2, and S1PR3 were determined by western blotting analysis using specific Abs. β-actin was used as loading control. Representative images are shown. (C) Fluorescent IHC staining of S1PR2 in human CCA tissues. Human CCA tumor tissue and nontumor tissue from the same patient were processed for fluorescent IHC staining of S1PR2, as described in Materials and Methods. Representative images are shown. (a) Negative control (NC) without primary and second Ab. (b) NC without primary Ab. (c and d) Nontumor tissues stained with S1PR2. (e and f) Tumor tissues stained with S1PR2.
Fig 3
Fig 3
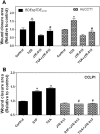
Effect of bile acids on cell proliferation in CCA cells. Rat BDEsp-TDEH10 cells or human CCLP1 cells were serum starved for 24 hours and then treated with individual bile acids, TCA, GCA, GDCA, and DCA at a concentration of 100 μM (A and C) or different concentrations of TCA (0-100 μM) for 48 hours (B and D). At the end of the treatment period, cells were harvested and analyzed using a Cellometer Vision CBA automatic cell counter (Nexcelom Bioscience, Lawrence, MA). Relative cell number, compared to control group, is shown. **P < 0.01; ***P < 0.001, compared to vehicle control; n = 3.
Fig 4
Fig 4
(A and B) Role of S1PR2 in TCA-mediated cell proliferation in rat BDEsp-TDEH10 cells. (A) Cells were plated in serum-free medium for 24 hours and then treated with TCA (100 μM) with or without JTE-013 (10 μM) for 48 hours. At the end of treatment, viable cells were quantified using the CCK-8 kit, as described in Materials and Methods. **P < 0.01, compared to vehicle control; #P < 0.05, compared to TCA group; n = 3. (B). Cells were transduced with control or S1PR2 lentiviral shRNA for 24 hours and then treated with control vehicle or TCA (100 μM) for 48 hours. Viable cells were quantified using the CCK-8 kit, as described in Materials and Methods. *P < 0.05; **P < 0.01, compared to vehicle control; n = 3. (C and D) Effect of ERK1/2 activation on TCA-mediated cell proliferation in CCA cells. Rat BDEsp-TDEH10 cells or human CCLP1 cells were serum starved for 24 hours and then treated with vehicle control, TCA (100 μM), the MEK1/2 inhibitor U0126 (10 μM), or TCA plus U0126 for 48 hours. At the end of the treatment period, cells were harvested and analyzed using a Cellometer Vision CBA automatic cell counter (Nexcelom Bioscience, Lawrence, MA). Relative cell number, compared to control group, is shown. (C) BDEsp-TDEH10 cells. (D) CCLP1 cells. *P < 0.05, compared to vehicle control; #P < 0.05, compared to TCA group; n = 3.
Fig 5
Fig 5
Effect of TCA and JTE-013 on the expansion of spheroid/“duct-like” structures formed in 3D organotypic cocultures of BDEsp-TDEH10 and BDEsp-TDFE4 cells. Rat BDEsp-TDEH10 and BDEsp-TDFE4 cells were mixed with rat-tail type I collagen gel, as described in Materials and Methods. Cells were treated with TCA (100 μM) or S1P (100 nM) with or without JTE-013 (10 μM) for 8 days. At the end of treatment, the collagen gel cultures were fixed and processed for H&E staining. The number and density of spheroid/duct-like structures were quantified as described in Materials and Methods. (A) Representative images of H&E staining of spheroid/duct-like structures formed in vehicle control versus S1P or TCA treatment groups with or without JTE-013. (B) The number of spheroid/duct-like structures/cm2 for each group was quantified as described in Materials and Methods. *P < 0.05; **P < 0.01, compared to vehicle control; #P < 0.05, compared to TCA or S1P group; n = 3. (C) Density of spheroid/duct-like structures was determined using IPLab4.0. **P < 0.01; ***P < 0.001, compared to vehicle control; ###P < 0.001, compared to TCA group; ##P < 0.01, compared to S1P group; n = 3.
Fig 6
Fig 6
(A and B) Effect of TCA on cultured BDEsp-TDEH10 cell invasion. Rat BDEsp-TDEH10 cells were plated in the upper transwell inserts and treated with TCA (100 μM) for 48 hours. At the end of treatment, the number of invasive cells on the lower surface of inserts and invasion index were analyzed as described in Materials and Methods. Representative images for each group are shown. *P < 0.05, compared to vehicle control; n = 3. (C and D) Effect of JTE-013 on TCA-induced cell invasion in cultured BDEsp-TDEH10 cells. Rat BDEsp-TDEH10 cells were plated in upper transwell inserts and pretreated with JTE-013 for 1 hour and then treated with S1P (100 nM) or TCA (100 μM) for 48 hours. At the end of treatment, the number of invasion cells on the lower surface of the inserts and invasion index were analyzed as described in Materials and Methods. *P < 0.05; ***P < 0.001, compared to vehicle control; ##P < 0.01, compared to TCA group; n = 3.
Fig 7
Fig 7
Effect of S1PR2 activation on CCA cell migration. Rat BDEsp-TDEH10 cells, human HuCCT1 cells, and CCLP1 cells were plated on six-well plates until confluent. Cells were scratched to simulate a wound and images were recorded as 0 hours. Cells were pretreated with JTE-013 (10 μM) for 1 hour, then treated with TCA (100 μM) or S1P (100 nM) for 48 hours. Images of wound areas were recorded as described in Materials and Methods. The area of wound was quantified using IPLab4.0. Relative wound closure was calculated. (A) Rat BDEsp-TDEH10 cells and human HuCCT1 cells. (B) Human CCLP1 cells. *P < 0.05, compared to control group; #P < 0.05, compared to corresponding TCA or S1P group, n = 3.
Fig 8
Fig 8
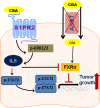
Schematic diagram of potential mechanisms by which CBAs promote CCA growth. In CCA cells, down-regulation of ASBT prevents CBAs from activating FXR-α. Accumulation of CBAs outside CCA cells will activate ERK1/2-signaling pathways through S1PR2. Activation of ERK1/2 results in the subsequent activation of the IL-6-JAK-STAT3 pathway and stimulates CCA growth. JAK, Janus kinase; STAT3, signal transducer and activator of transcription.

Comment in

References

    1. Welzel TM, Graubard BI, El-Serag HB, Shaib YH, Hsing AW, Davila JA, McGlynn KA. Risk factors for intrahepatic and extrahepatic cholangiocarcinoma in the United States: a population-based case-control study. Clin Gastroenterol Hepatol. 2007;5:1221–1228. - PMC - PubMed
    1. Razumilava N, Gores GJ. Classification, diagnosis, and management of cholangiocarcinoma. Clin Gastroenterol Hepatol. 2013;11:13–21. e11; quiz, e13-14. - PMC - PubMed
    1. Sia D, Tovar V, Moeini A, Llovet JM. Intrahepatic cholangiocarcinoma: pathogenesis and rationale for molecular therapies. Oncogene. 2013;32:4861–4870. - PMC - PubMed
    1. Sirica AE, Zhang Z, Lai GH, Asano T, Shen XN, Ward DJ, et al. A novel “patient-like” model of cholangiocarcinoma progression based on bile duct inoculation of tumorigenic rat cholangiocyte cell lines. Hepatology. 2008;47:1178–1190. - PubMed
    1. Yang H, Li TW, Peng J, Tang X, Ko KS, Xia M, Aller MA. A mouse model of cholestasis-associated cholangiocarcinoma and transcription factors involved in progression. Gastroenterology. 2011;141:378–388. 388.e1-4. - PMC - PubMed

Publication types

MeSH terms

Substances