

Transcriptional activation by NFκB increases perlecan/HSPG2 expression in the desmoplastic prostate tumor microenvironment
- PMID: 24700612
- PMCID: PMC4091977
- DOI: 10.1002/jcb.24788
Transcriptional activation by NFκB increases perlecan/HSPG2 expression in the desmoplastic prostate tumor microenvironment
Erratum in
-
Erratum: Transcriptional Activation by NFκB Increases Perlecan/HSPG2 Expression in the Desmoplastic Prostate Tumor Microenvironment. C. R. Warren, B. J. Grindel, L. Francis, D. D. Carson and M. C. Farach-Carson.J Cell Biochem. 2016 Nov;117(11):2669. doi: 10.1002/jcb.25648. Epub 2016 Jul 14. J Cell Biochem. 2016. PMID: 27603157 No abstract available.
Abstract
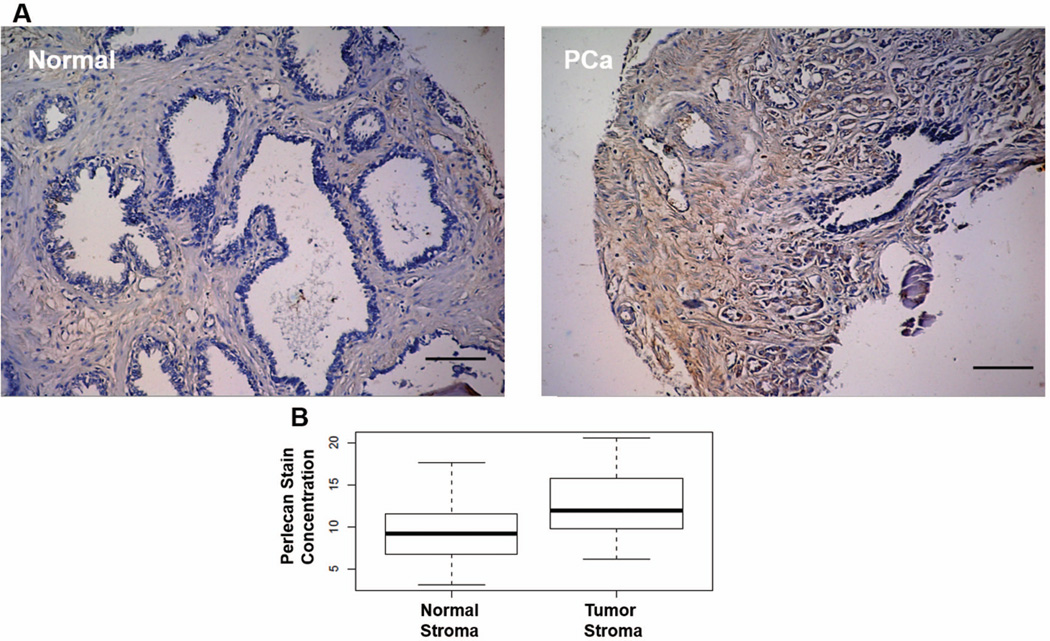
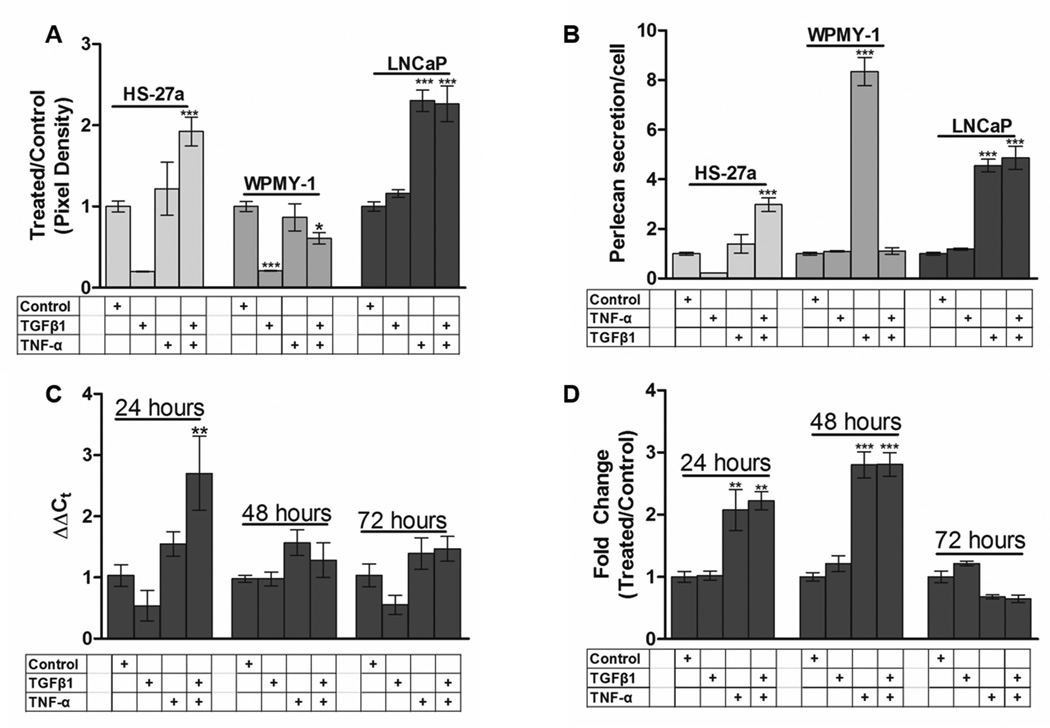
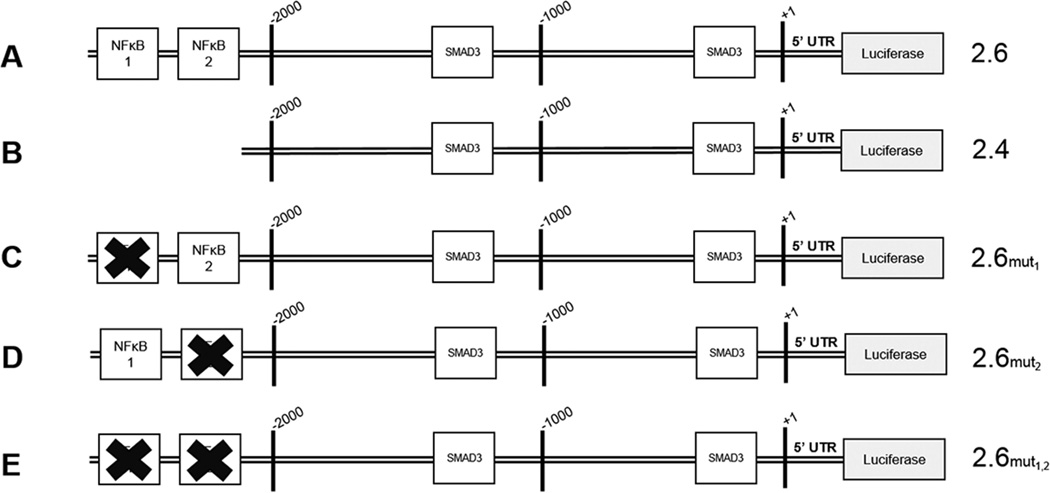
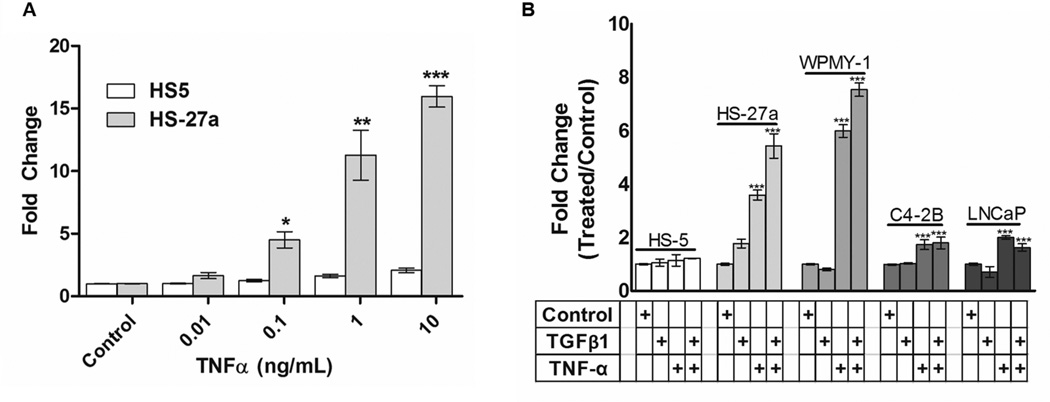
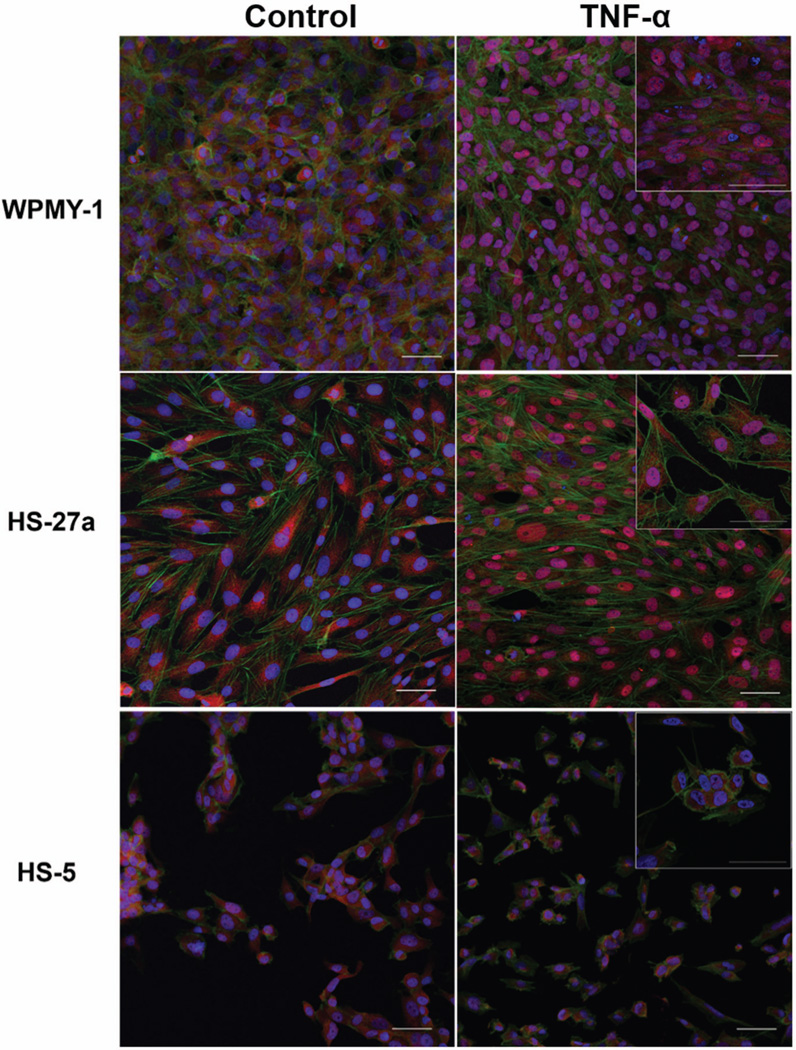
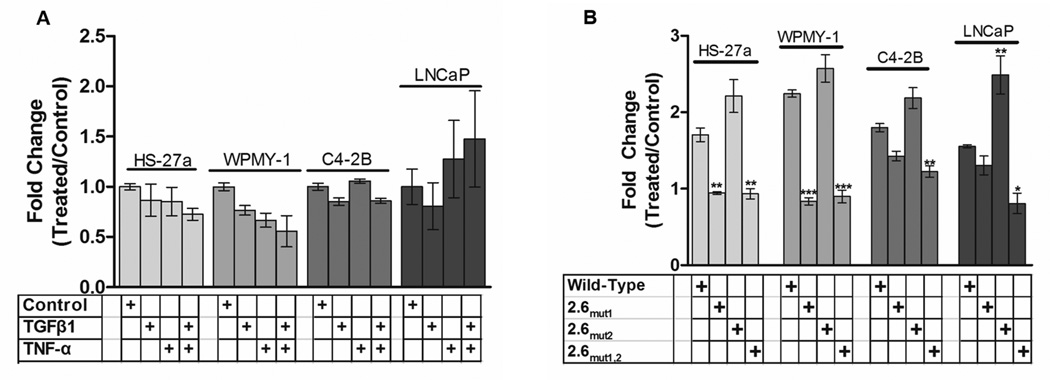
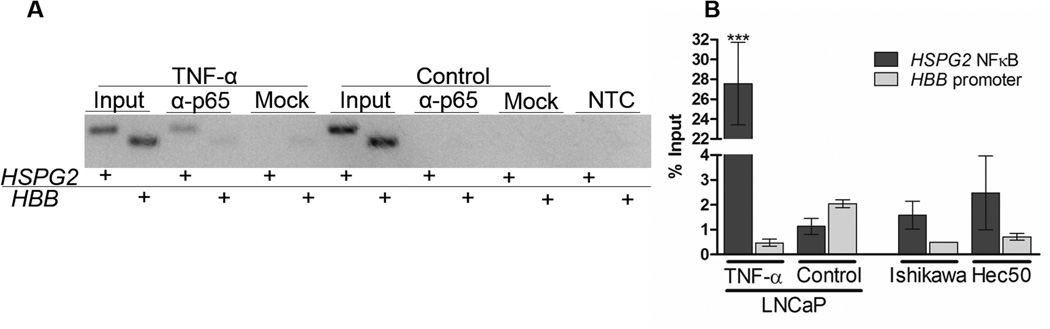
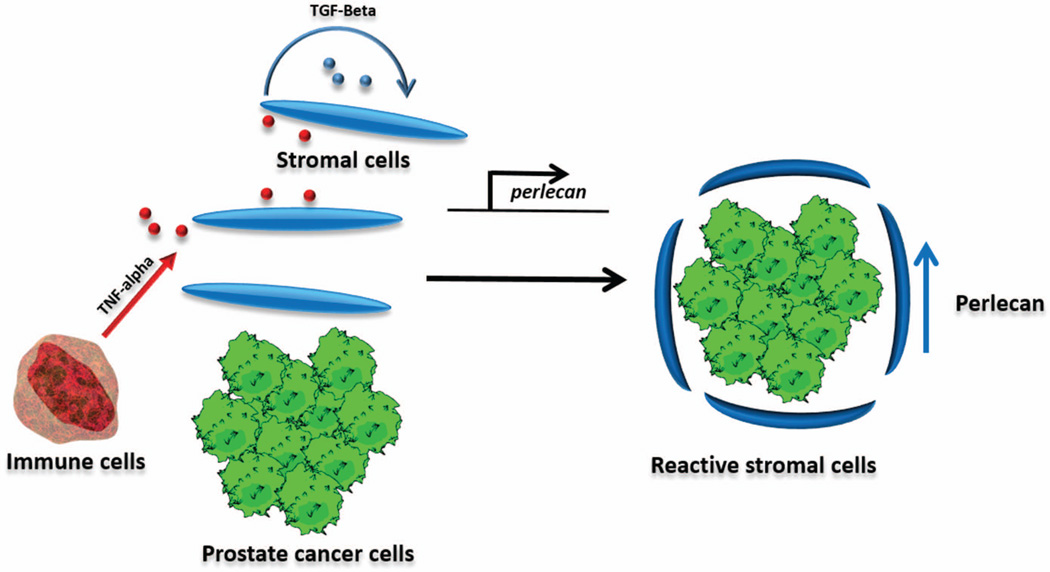
Perlecan/HSPG2, a heparan sulfate proteoglycan typically found at tissue borders including those separating epithelia and connective tissue, increases near sites of invasion of primary prostatic tumors as previously shown for other proteins involved in desmoplastic tissue reaction. Studies of prostate cancer cells and stromal cells from both prostate and bone, the major site for prostate cancer metastasis, showed that cancer cells and a subset of stromal cells increased production of perlecan in response to cytokines present in the tumor microenvironment. In silico analysis of the HSPG2 promoter revealed two conserved NFκB binding sites, in addition to the previously reported SMAD3 binding sites. By systematically transfecting cells with a variety of reporter constructs including sequences up to 2.6 kb from the start site of transcription, we identified an active cis element in the distal region of the HSPG2 promoter, and showed that it functions in regulating transcription of HSPG2. Treatment with TNF-α and/or TGFβ1 identified TNF-α as a major cytokine regulator of perlecan production. TNF-α treatment also triggered p65 nuclear translocation and binding to the HSPG2 regulatory region in stromal cells and cancer cells. In addition to stromal induction of perlecan production in the prostate, we identified a matrix-secreting bone marrow stromal cell type that may represent the source for increases in perlecan in the metastatic bone marrow environment. These studies implicate perlecan in cytokine-mediated, innate tissue responses to cancer cell invasion, a process we suggest reflects a modified wound healing tissue response co-opted by prostate cancer cells.
Keywords: CYTOKINES; GENE EXPRESSION; PERLECAN/HSPG2; PROSTATE CANCER; TGFβ; TNF-α.
© 2014 Wiley Periodicals, Inc.
Figures
Similar articles
-
SULF1 suppresses Wnt3A-driven growth of bone metastatic prostate cancer in perlecan-modified 3D cancer-stroma-macrophage triculture models.PLoS One. 2020 May 15;15(5):e0230354. doi: 10.1371/journal.pone.0230354. eCollection 2020. PLoS One. 2020. PMID: 32413029 Free PMC article.
-
Matrilysin/MMP-7 Cleavage of Perlecan/HSPG2 Complexed with Semaphorin 3A Supports FAK-Mediated Stromal Invasion by Prostate Cancer Cells.Sci Rep. 2018 May 8;8(1):7262. doi: 10.1038/s41598-018-25435-3. Sci Rep. 2018. PMID: 29740048 Free PMC article.
-
Matrilysin/matrix metalloproteinase-7(MMP7) cleavage of perlecan/HSPG2 creates a molecular switch to alter prostate cancer cell behavior.Matrix Biol. 2014 Jun;36:64-76. doi: 10.1016/j.matbio.2014.04.005. Epub 2014 May 14. Matrix Biol. 2014. PMID: 24833109 Free PMC article.
-
Border patrol: insights into the unique role of perlecan/heparan sulfate proteoglycan 2 at cell and tissue borders.Matrix Biol. 2014 Feb;34:64-79. doi: 10.1016/j.matbio.2013.08.004. Epub 2013 Aug 31. Matrix Biol. 2014. PMID: 24001398 Free PMC article. Review.
-
Modular Proteoglycan Perlecan/HSPG2: Mutations, Phenotypes, and Functions.Genes (Basel). 2018 Nov 16;9(11):556. doi: 10.3390/genes9110556. Genes (Basel). 2018. PMID: 30453502 Free PMC article. Review.
Cited by
-
The role of perlecan and endorepellin in the control of tumor angiogenesis and endothelial cell autophagy.Connect Tissue Res. 2015;56(5):381-91. doi: 10.3109/03008207.2015.1045297. Epub 2015 Jul 16. Connect Tissue Res. 2015. PMID: 26181327 Free PMC article. Review.
-
Matrix proteoglycans in tumor inflammation and immunity.Am J Physiol Cell Physiol. 2022 Sep 1;323(3):C678-C693. doi: 10.1152/ajpcell.00023.2022. Epub 2022 Jul 25. Am J Physiol Cell Physiol. 2022. PMID: 35876288 Free PMC article. Review.
-
SULF1 suppresses Wnt3A-driven growth of bone metastatic prostate cancer in perlecan-modified 3D cancer-stroma-macrophage triculture models.PLoS One. 2020 May 15;15(5):e0230354. doi: 10.1371/journal.pone.0230354. eCollection 2020. PLoS One. 2020. PMID: 32413029 Free PMC article.
-
CAF hierarchy driven by pancreatic cancer cell p53-status creates a pro-metastatic and chemoresistant environment via perlecan.Nat Commun. 2019 Aug 12;10(1):3637. doi: 10.1038/s41467-019-10968-6. Nat Commun. 2019. PMID: 31406163 Free PMC article.
-
Cryptococcus neoformans-Infected Macrophages Release Proinflammatory Extracellular Vesicles: Insight into Their Components by Multi-omics.mBio. 2021 Mar 30;12(2):e00279-21. doi: 10.1128/mBio.00279-21. mBio. 2021. PMID: 33785616 Free PMC article.
References
-
- Andrades JA, Han B, Becerra J, Sorgente N, Hall FL, Nimni ME. A recombinant human TGF-beta1 fusion protein with collagen-binding domain promotes migration, growth, and differentiation of bone marrow mesenchymal cells. Exp Cell Res. 1999;250:485–498. - PubMed
-
- Behrens DT, Villone D, Koch M, Brunner G, Sorokin L, Robenek H, Bruckner-Tuderman L, Bruckner P, Hansen U. The epidermal basement membrane is a composite of separate laminin- or collagen IV-containing networks connected by aggregated perlecan, but not by nidogens. J Biol Chem. 2012;287:18700–18709. - PMC - PubMed
-
- Brown LF, Guidi AJ, Schnitt SJ, Van De Water L, Iruela-Arispe ML, Yeo TK, Tognazzi K, Dvorak HF. Vascular stroma formation in carcinoma in situ, invasive carcinoma, and metastatic carcinoma of the breast. Clin Cancer Res. 1999;5:1041–1056. - PubMed
-
- Bubendorf L, Schopfer A, Wagner U, Sauter G, Moch H, Willi N, Gasser TC, Mihatsch MJ. Metastatic patterns of prostate cancer: an autopsy study of 1,589 patients. Hum Pathol. 2000;31:578–583. - PubMed
Publication types
MeSH terms
Substances
Grants and funding
LinkOut - more resources
Full Text Sources
Other Literature Sources
Medical
