Identification of predominant genes involved in regulation and execution of senescence-associated nitrogen remobilization in flag leaves of field grown barley
- PMID: 24700620
- PMCID: PMC4106439
- DOI: 10.1093/jxb/eru094
Identification of predominant genes involved in regulation and execution of senescence-associated nitrogen remobilization in flag leaves of field grown barley
Abstract
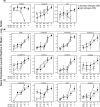
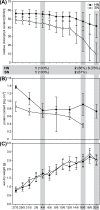
The transcriptomes of senescing flag leaves collected from barley field plots with standard or high nitrogen supply were compared to identify genes specifically associated with nitrogen remobilization during leaf senescence under agronomically relevant conditions. In flag leaves collected in field plots with high nitrogen supply, the decline in chlorophyll content was delayed. By comparing changes in gene expression for the two nitrogen levels, it was possible to discriminate genes related to nitrogen remobilization during senescence and genes involved in other processes associated with the late development of leaves under field conditions. Predominant genes that were more strongly upregulated during senescence of flag leaves from plants with standard nitrogen supply included genes encoding the transcription factor HvNAC026, serine type protease SCPL51, and the autophagy factors APG7 and ATG18F. Elevated expression of these genes in senescing leaves from plants with standard nitrogen supply indicates important roles of the corresponding proteins in nitrogen remobilization. In comparison, the genes upregulated in both flag leaf samples might have roles in general senescence processes associated with late leaf development. Among these genes were the transcription factor genes HvNAC001, HvNAC005, HvNAC013, HvWRKY12 and MYB, genes encoding the papain-like cysteine peptidases HvPAP14 and HvPAP20, as well as a subtilase gene.
Keywords: Barley; Hordeum vulgare L.; HvNAC026.; field experiment; flag leaf; leaf senescence; nitrogen remobilization; nitrogen supply.
© The Author 2014. Published by Oxford University Press on behalf of the Society for Experimental Biology.
Figures


References
-
- Balazadeh S, Riano-Pachon DM, Mueller-Roeber B. 2008. Transcription factors regulating leaf senescence in Arabidopsis thaliana . Plant Biology 10, 63–75 - PubMed
-
- Bolstad BM, Irizarry RA, Astrand M, Speed TP. 2003. A comparison of normalization methods for high density oligonucleotide array data based on variance and bias. Bioinformatics 19, 185–193 - PubMed
Publication types
MeSH terms
Substances
LinkOut - more resources
Full Text Sources
Other Literature Sources
Molecular Biology Databases

