. 2015 May;8(5):372-81.
doi: 10.1002/jbio.201300197. Epub 2014 Apr 3.

Optical Thromboelastography to evaluate whole blood coagulation

Affiliations

Optical Thromboelastography to evaluate whole blood coagulation

Zeinab Hajjarian et al. J Biophotonics. 2015 May.

Abstract

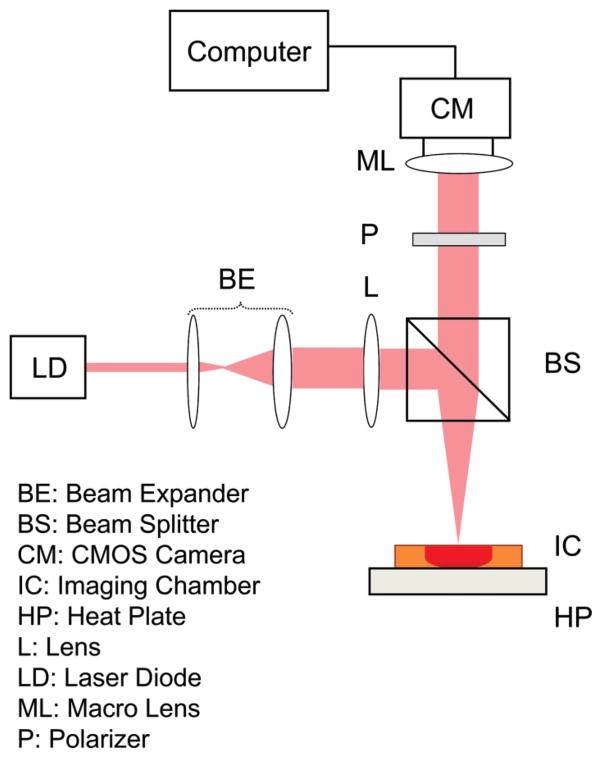
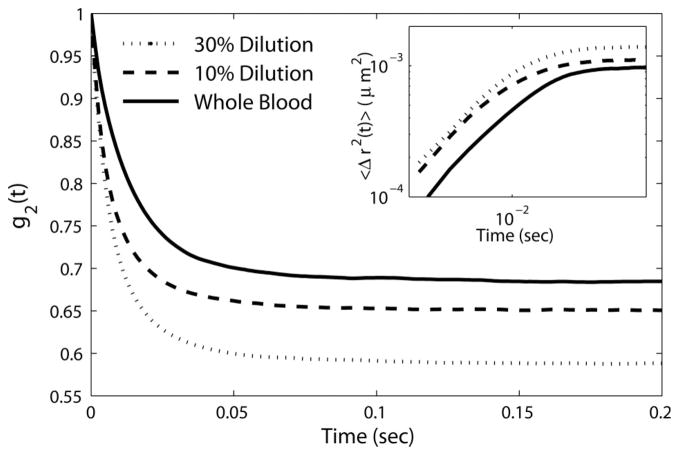
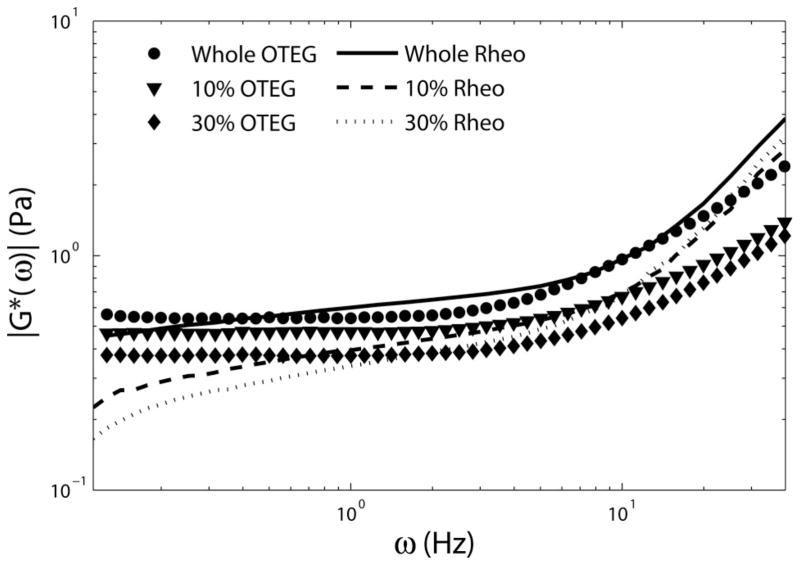
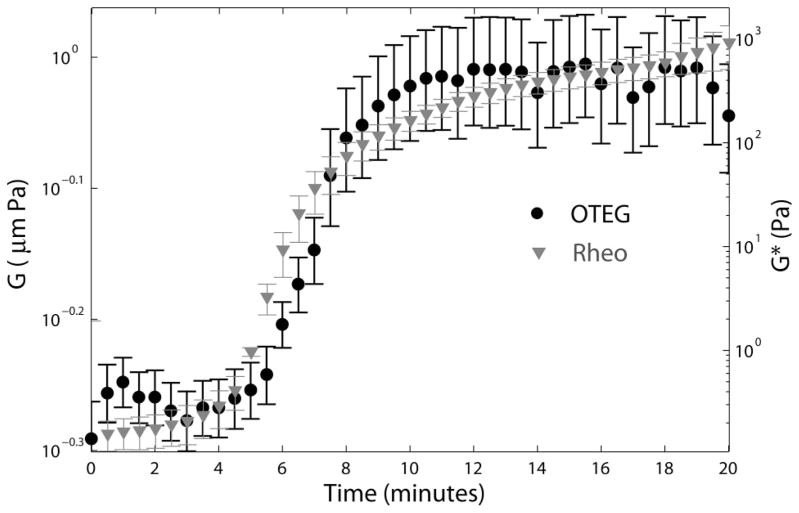
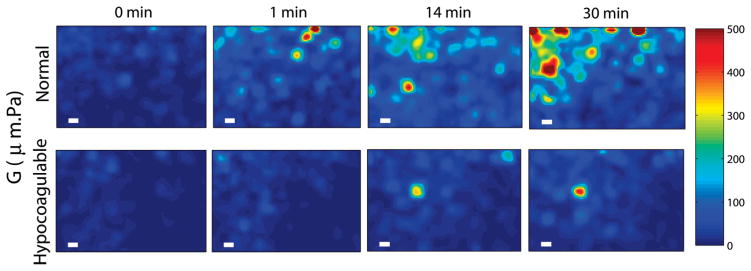
Measurement of blood viscoelasticity during clotting provides a direct metric of haemostatic conditions. Therefore, technologies that quantify blood viscoelasticity at the point-of-care are invaluable for diagnosing coagulopathies. We present a new approach, Optical Thromboelastography (OTEG) that measures the viscoelastic properties of coagulating blood by evaluating temporal laser speckle fluctuations, reflected from a few blood drops. During coagulation, platelet-fibrin clot formation restricts the mean square displacements (MSD) of scatterers and decelerates speckle fluctuations. Cross-correlation analysis of speckle frames provides the speckle intensity temporal autocorrelation, g2 (t), from which MSD is deduced and the viscoelastic modulus of blood is estimated. Our results demonstrate a close correspondence between blood viscoelasticity evaluated by OTEG and mechanical rheometry. Spatio-temporal speckle analyses yield 2-dimensional maps of clot viscoelasticity, enabling the identification of micro-clot formation at distinct rates in normal and coagulopathic specimens. These findings confirm the unique capability of OTEG for the rapid evaluation of patients' coagulation status and highlight the potential for point-of-care use.

Keywords: Blood; coagulation; laser speckle; optical thromboelastography; rheology; thromboelastography; viscoelasticity.


Figures

Figure 1
Figure 1
Schematic diagram of OTEG optical setup. Light from a diode laser (DL) was passed through a beam expander (BE), and beam splitter (BS) and focused by a lens (L) on the surface of an imaging chamber (IC), placed on a custom-manufactured heat plate (HP). The scattered light was collected by a high-speed CMOS camera (CM), equipped with a polarizer (P) and a macro-lens (ML). Speckle frames were transferred to a desktop computer via a camera-link interface for processing.
Figure 2
Figure 2
Speckle intensity autocorrelation curves, g2(t), of whole porcine blood with no dilution (solid line), as well as 10% and 30% dilution with Dextran 40 (dashed and dotted lines, respectively). Inset: MSD of scattering particles.
Figure 3
Figure 3
Complex viscoelastic modulus, |G*(ω)|, of whole porcine blood, with no dilution, as well as 10%, and 30% serial dilution with Dextran 40 solution (circles, triangles and diamonds) obtained using the GSER (Eq. (3)), and mechanical rheology (solid, dashed, and dotted lines), respectively. Good agreement is observed between the results of OTEG and mechanical rheometry, especially at frequencies of 1 Hz < ω < 10 Hz.
Figure 4
Figure 4
Primary y-axis: Average viscoelastic modulus multiplied by the radius of scattering particles, G = |aG*| of three normal human blood specimens, evaluated at the frequency of 1 Hz, by OTEG. The variability among samples is illustrated by standard error bars. Secondary y-axis: Viscoelastic modulus, |G*|, evaluated at the frequency of 1 Hz, using conventional ARG2 rheometer.
Figure 5
Figure 5
Spatial maps of blood viscoelasticity index, G, during clotting obtained from a normal patient (top row) and a hypo-coagulable patient with low levels of clotting factors (bottom row) at 0, 1, 14, and 30 minutes after kaolin activation. Micro-clots of significant G values appear at early times (~1 min) and continue to progress to form a large blood clot over 30 min in the normal patient. In contrast, in the hypo-coagulable sample, micro-clots of comparable G are only visible at 14 min and the extent and overall clot strength is considerably reduced compared to the normal patient even at 30 min. Scale bars are 100 μm long. These results demonstrate the high sensitivity and spatial resolution of OTEG for detecting incipient micro-clots during very early stages of clot formation in patients.

Similar articles

Cited by

References

    1. Shaz BH, Winkler AM, James AB, Hillyer CD, MacLeod JB. J Trauma. 2011;70:1401–1407. - PMC - PubMed
    1. Bern M, McCarthy N. Blood Coagul Fibrinolysis. 2012;24:59–63. - PubMed
    1. Edelman JJ, Reddel CJ, Kritharides L, Bannon PG, Fraser JF, Curnow JL, Vallely MP. J Thorac Cardiovasc Surg. in press.
    1. Whiting D, Dinardo JA. Am J Hematol. 2014;89:228–232. - PubMed
    1. Evans PA, Hawkins K, Lawrence M, Williams RL, Barrow MS, Thirumalai N, Williams PR. Med Eng Phys. 2008;30:671–679. - PubMed

Publication types

LinkOut - more resources