

Risk prediction for late-stage ovarian cancer by meta-analysis of 1525 patient samples
- PMID: 24700803
- PMCID: PMC4580556
- DOI: 10.1093/jnci/dju048
Risk prediction for late-stage ovarian cancer by meta-analysis of 1525 patient samples
Abstract
Background: Ovarian cancer causes more than 15000 deaths per year in the United States. The survival of patients is quite heterogeneous, and accurate prognostic tools would help with the clinical management of these patients.
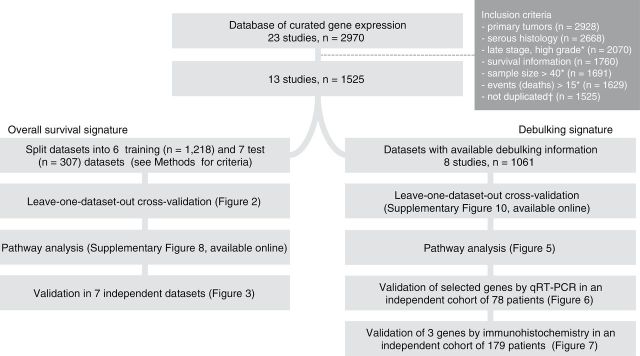
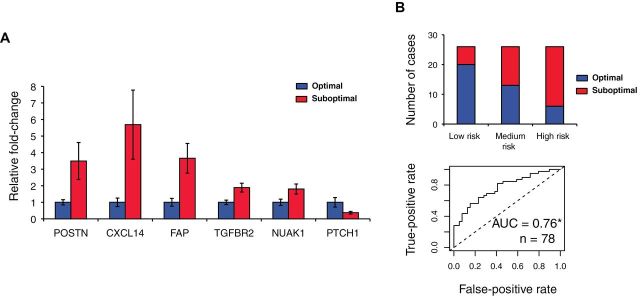
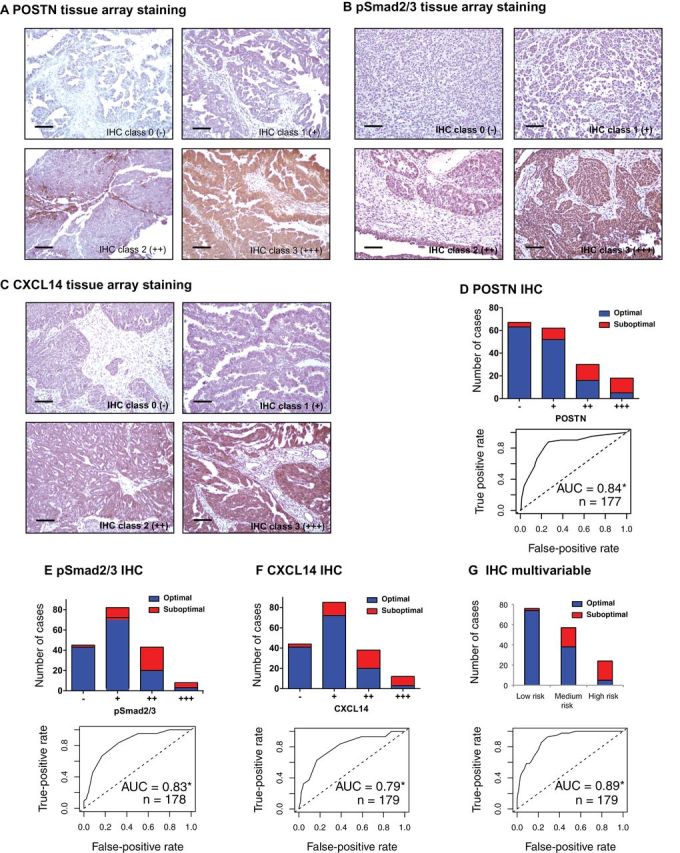
Methods: We developed and validated two gene expression signatures, the first for predicting survival in advanced-stage, serous ovarian cancer and the second for predicting debulking status. We integrated 13 publicly available datasets totaling 1525 subjects. We trained prediction models using a meta-analysis variation on the compound covariable method, tested models by a "leave-one-dataset-out" procedure, and validated models in additional independent datasets. Selected genes from the debulking signature were validated by immunohistochemistry and quantitative reverse-transcription polymerase chain reaction (qRT-PCR) in two further independent cohorts of 179 and 78 patients, respectively. All statistical tests were two-sided.
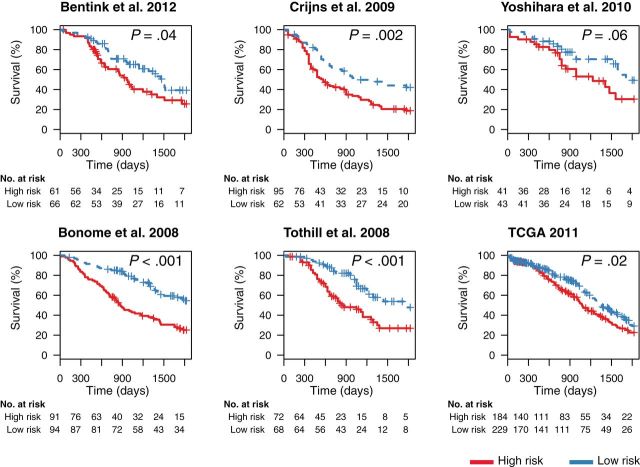
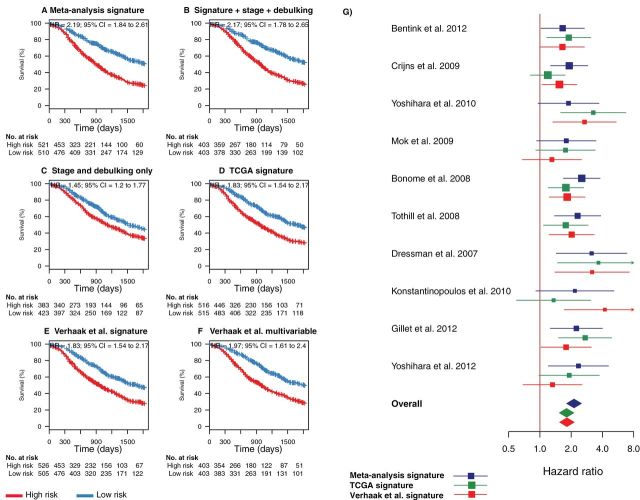
Results: The survival signature stratified patients into high- and low-risk groups (hazard ratio = 2.19; 95% confidence interval [CI] = 1.84 to 2.61) statistically significantly better than the TCGA signature (P = .04). POSTN, CXCL14, FAP, NUAK1, PTCH1, and TGFBR2 were validated by qRT-PCR (P < .05) and POSTN, CXCL14, and phosphorylated Smad2/3 were validated by immunohistochemistry (P < .001) as independent predictors of debulking status. The sum of immunohistochemistry intensities for these three proteins provided a tool that classified 92.8% of samples correctly in high- and low-risk groups for suboptimal debulking (area under the curve = 0.89; 95% CI = 0.84 to 0.93).
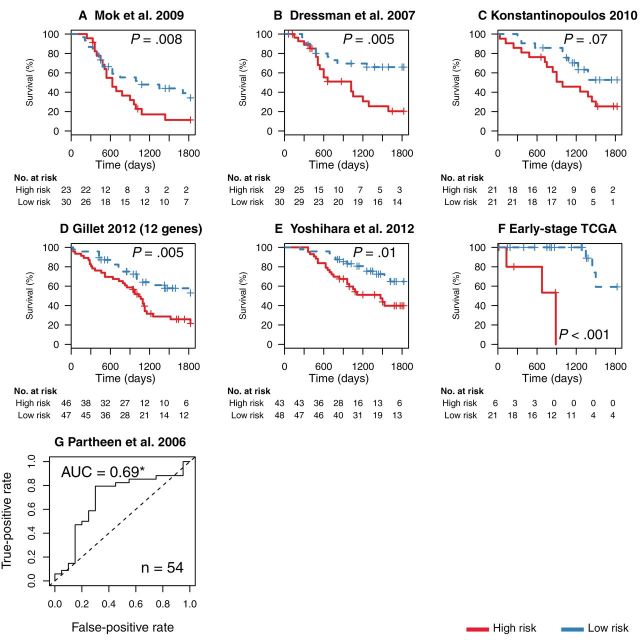
Conclusions: Our survival signature provides the most accurate and validated prognostic model for early- and advanced-stage high-grade, serous ovarian cancer. The debulking signature accurately predicts the outcome of cytoreductive surgery, potentially allowing for stratification of patients for primary vs secondary cytoreduction.
© The Author 2014. Published by Oxford University Press. All rights reserved. For Permissions, please e-mail: journals.permissions@oup.com.
Figures
Similar articles
-
A collagen-remodeling gene signature regulated by TGF-β signaling is associated with metastasis and poor survival in serous ovarian cancer.Clin Cancer Res. 2014 Feb 1;20(3):711-23. doi: 10.1158/1078-0432.CCR-13-1256. Epub 2013 Nov 11. Clin Cancer Res. 2014. PMID: 24218511 Free PMC article.
-
Whole genome oligonucleotide-based array comparative genomic hybridization analysis identified fibroblast growth factor 1 as a prognostic marker for advanced-stage serous ovarian adenocarcinomas.J Clin Oncol. 2007 Jun 1;25(16):2281-7. doi: 10.1200/JCO.2006.09.0795. J Clin Oncol. 2007. PMID: 17538174
-
Development and validation of an immune gene-set based Prognostic signature in ovarian cancer.EBioMedicine. 2019 Feb;40:318-326. doi: 10.1016/j.ebiom.2018.12.054. Epub 2018 Dec 27. EBioMedicine. 2019. PMID: 30594555 Free PMC article.
-
POSTN/TGFBI-associated stromal signature predicts poor prognosis in serous epithelial ovarian cancer.Gynecol Oncol. 2014 Feb;132(2):334-42. doi: 10.1016/j.ygyno.2013.12.021. Epub 2013 Dec 22. Gynecol Oncol. 2014. PMID: 24368280
-
A DNA repair pathway-focused score for prediction of outcomes in ovarian cancer treated with platinum-based chemotherapy.J Natl Cancer Inst. 2012 May 2;104(9):670-81. doi: 10.1093/jnci/djs177. Epub 2012 Apr 13. J Natl Cancer Inst. 2012. PMID: 22505474 Free PMC article.
Cited by
-
CD103+ intraepithelial T cells in high-grade serous ovarian cancer are phenotypically diverse TCRαβ+ CD8αβ+ T cells that can be targeted for cancer immunotherapy.Oncotarget. 2016 Nov 15;7(46):75130-75144. doi: 10.18632/oncotarget.12077. Oncotarget. 2016. PMID: 27650547 Free PMC article.
-
Cytoreductive Surgery (CRS) and HIPEC for Advanced Ovarian Cancer with Peritoneal Metastases: Italian PSM Oncoteam Evidence and Study Purposes.Cancers (Basel). 2022 Dec 6;14(23):6010. doi: 10.3390/cancers14236010. Cancers (Basel). 2022. PMID: 36497490 Free PMC article. Review.
-
Cancer Stem Cell Markers-Clinical Relevance and Prognostic Value in High-Grade Serous Ovarian Cancer (HGSOC) Based on The Cancer Genome Atlas Analysis.Int J Mol Sci. 2023 Aug 13;24(16):12746. doi: 10.3390/ijms241612746. Int J Mol Sci. 2023. PMID: 37628927 Free PMC article.
-
Host DNA contents in fecal metagenomics as a biomarker for intestinal diseases and effective treatment.BMC Genomics. 2020 May 11;21(1):348. doi: 10.1186/s12864-020-6749-z. BMC Genomics. 2020. PMID: 32393180 Free PMC article.
-
Single Gene Prognostic Biomarkers in Ovarian Cancer: A Meta-Analysis.PLoS One. 2016 Feb 17;11(2):e0149183. doi: 10.1371/journal.pone.0149183. eCollection 2016. PLoS One. 2016. PMID: 26886260 Free PMC article.
References
-
- Siegel R, Naishadham D, Jemal A. Cancer statistics, 2012. CA Cancer J Clin. 2012;62(1):10–29. - PubMed
-
- Ibeanu OA, Bristow RE. Predicting the outcome of cytoreductive surgery for advanced ovarian cancer: a review. Int J Gynecol Cancer. 2010;20(Suppl 1):S1–S11. - PubMed
-
- Chang SJ, Bristow RE, Ryu HS. Impact of complete cytoreduction leaving no gross residual disease associated with radical cytoreductive surgical procedures on survival in advanced ovarian cancer. Ann Surg Oncol. 2012;19(13):4059–4067. - PubMed
-
- Barakat R, Berchuck A, Markman M, et al. Principles and Practice of Gynecologic Oncology. 6th ed. Philadelphia, PA: Lippincott Williams & Wilkins; 2013.
Publication types
MeSH terms
Grants and funding
LinkOut - more resources
Full Text Sources
Other Literature Sources
Medical
Miscellaneous
