. 2014 Apr 3;106(5):dju062.
doi: 10.1093/jnci/dju062.

Role in tumor growth of a glycogen debranching enzyme lost in glycogen storage disease

Affiliations

Role in tumor growth of a glycogen debranching enzyme lost in glycogen storage disease

Sunny Guin et al. J Natl Cancer Inst. .

Abstract

Background: Bladder cancer is the most common malignancy of the urinary system, yet our molecular understanding of this disease is incomplete, hampering therapeutic advances.

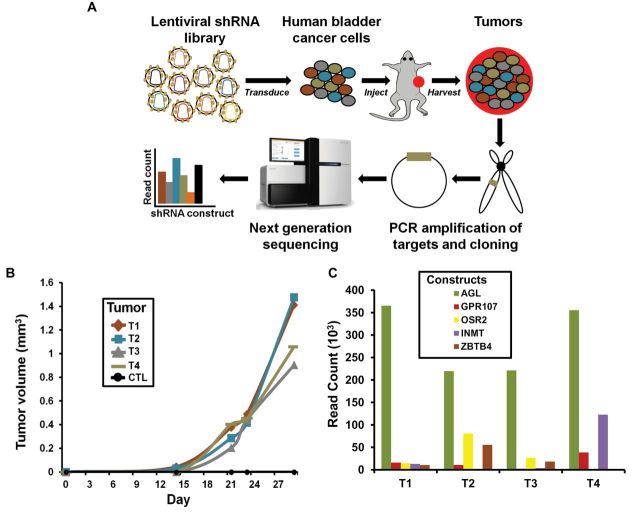
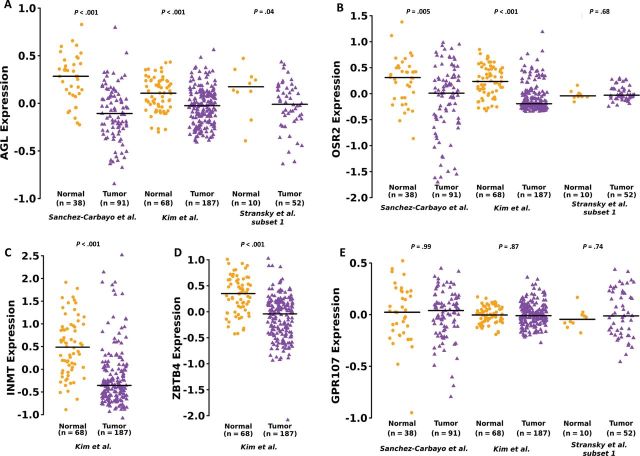
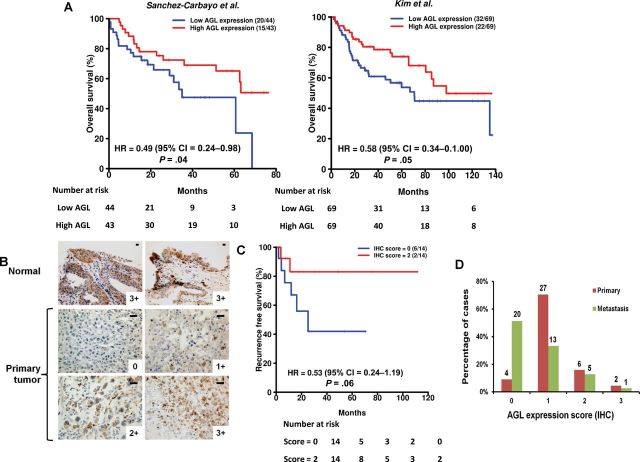
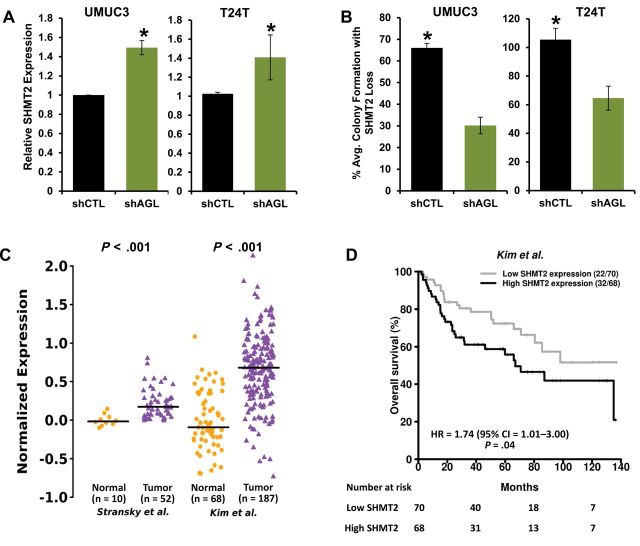
Methods: Here we used a genome-wide functional short-hairpin RNA (shRNA) screen to identify suppressors of in vivo bladder tumor xenograft growth (n = 50) using bladder cancer UMUC3 cells. Next-generation sequencing was used to identify the most frequently occurring shRNAs in tumors. Genes so identified were studied in 561 patients with bladder cancer for their association with stratification of clinical outcome by Kaplan-Meier analysis. The best prognostic marker was studied to determine its mechanism in tumor suppression using anchorage-dependent and -independent growth, xenograft (n = 20), and metabolomic assays. Statistical significance was determined using two-sided Student t test and repeated-measures statistical analysis.

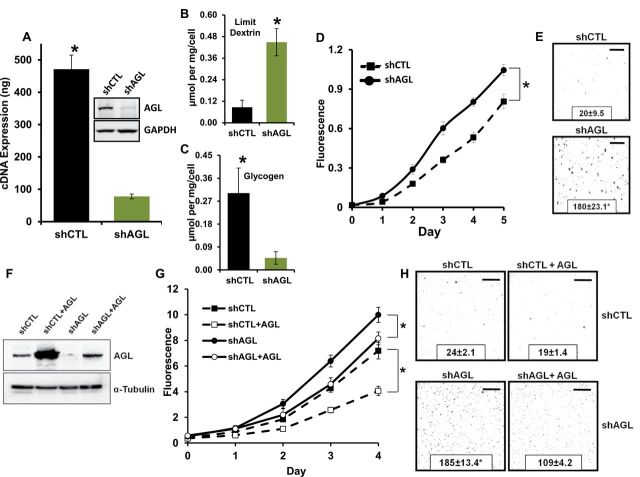
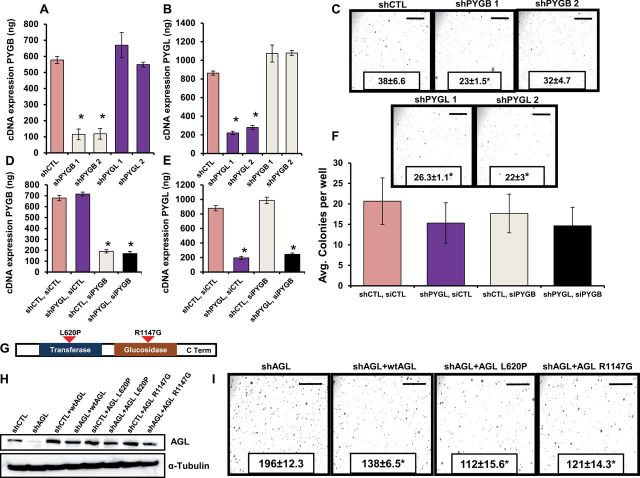
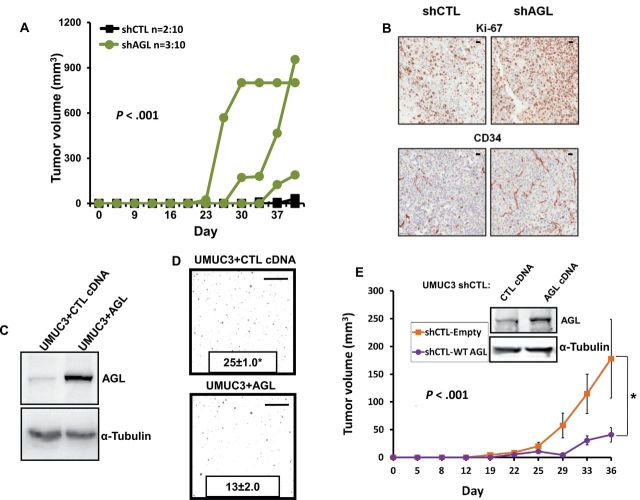
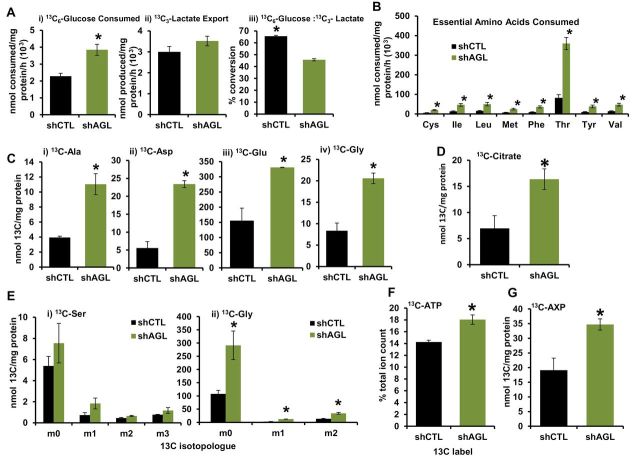
Results: We identified the glycogen debranching enzyme AGL as a prognostic indicator of patient survival (P = .04) and as a novel regulator of bladder cancer anchorage-dependent (P < .001), anchorage-independent (mean ± standard deviation, 180 ± 23.1 colonies vs 20±9.5 in control, P < .001), and xenograft growth (P < .001). Rescue experiments using catalytically dead AGL variants revealed that this effect is independent of AGL enzymatic functions. We demonstrated that reduced AGL enhances tumor growth by increasing glycine synthesis through increased expression of serine hydroxymethyltransferase 2.

Conclusions: Using an in vivo RNA interference screen, we discovered that AGL, a glycogen debranching enzyme, has a biologically and statistically significant role in suppressing human cancer growth.


Figures

Figure 1.
Figure 1.
Discovery of amylo-α-1, 6-glucosidase, 4-α-glucanotransferase (AGL) as a putative tumor growth suppressor. A) Diagram of the pooled short-hairpin (shRNA) library experiment. UMUC3 cancer cells were transduced with either Sigma-Aldrich pooled shRNA library or corresponding control (CTL) shRNA. Limiting dilution experiments were conducted to determine cell number at which UMUC3 cells transduced with control shRNA would not give tumors; number was determined to be 50000 cells. Transduced UMUC3 cells were injected at 25 000 and 12 000 cells per site into 25 immunocompromised mice (two injection sites per mouse). B) Four tumors that grew more than 900mm3 30 days after initial injection were harvested. The y-axis is ×103. C) DNA from harvested tumors was sequenced to determine shRNA constructs. AGL was the most represented shRNA construct in four harvested tumors. The y-axis is ×103.
Figure 2.
Figure 2.
Expression of genes identified by RNA interference screen in bladder tumors. A) Amylo-α-1, 6-glucosidase, 4-α-glucanotransferase (AGL) mRNA expression in human urothelial tumors (total n = 330) compared to human normal bladder tissue (total n = 116) in three independent datasets. B) OSR2 mRNA expression in tumor samples (total n = 330) compared to normal urothelium (total n = 116) in three independent microarray datasets. C, D) INMT and ZBTB4 mRNA expression in tumors (total n = 187) compared to normal (total n = 68) in one dataset each. E) GPR107 mRNA expression between tumor (n = 330) and normal urothelium (total n = 116) in all datasets. Horizontal lines represent median of gene expression. Differences in distributions were tested by Wilcoxon rank-sum tests (P values shown in the figure). The statistical tests conducted were two-sided. Datasets are described in Supplementary Table 2 (available online).
Figure 3.
Figure 3.
Amylo-α-1, 6-glucosidase, 4-α-glucanotransferase (AGL) expression in human cancer. A) Patients in two independent datasets were divided into two groups using median AGL expression. The two patient groups were compared using Cox proportional hazards models. Hazard ratios (HRs) with 95% confidence intervals (CIs) and log-rank P values are shown. Numbers in parentheses are the number of deaths followed by the number of patients in each group. B) Immunohistochemical (IHC) analysis of AGL expression in normal urothelium and bladder cancer. Scales represent a size of 20 µm. C) Recurrence-free survival rates in patients with low AGL IHC scores (0) and patients with high AGL IHC scores (2). HRs and two-sided log-rank P values are shown. D) AGL staining intensity in primary tumors compared to bladder cancer metastases to investigate AGL protein expression in relation to cancer progresses. All statistical tests were two-sided.
Figure 4.
Figure 4.
Amylo-α-1, 6-glucosidase, 4-α-glucanotransferase (AGL) loss and tumor growth in vitro. A) AGL gene knockdown was validated by western blot analysis and real-time polymerase chain reaction in UMUC3 cell lines. Results are shown as mean ± SD (n = 3). B, C) Nuclear magnetic resonance was used to assess intracellular limit dextrin and glycogen levels. B) Limit dextrin and (C) normal glycogen in the UMUC3 shCTL (cells transduced with control plasmid) and shAGL (cells with stable knockdown of AGL) cell lines. Error bars represent SD. D, E) UMUC3 shCTL and shAGL cell growth in anchorage-dependent (D) and -independent (E) growth (n = 6) for proliferation assays (y-axis is ×103) and (n = 3) for colony formation assays. F) An shRNA-insensitive AGL construct was transiently overexpressed in shCTL and shAGL UMUC3 cells and overexpression was validated by western blot analysis 72 hours after transfection. G and H) Transient overexpression of AGL in shCTL and shAGL UMUC3 cells followed by proliferation assay (G) (y-axis is ×103) and colony formation assay (H) (n = 6) for proliferation assays and (n = 3) for colony formation assays. Details of assays described in the Methods. For proliferation assay, error bars represent SD; for colony formation assay, mean ± SD is represented. *P < .001 by two-sided Student t test (AC, E, H) or repeated-measures analysis (D, G) based on a one-sided χ2 test statistic. All scale bars represent a size of 0.4cm.
Figure 5.
Figure 5.
Amylo-α-1, 6-glucosidase, 4-α-glucanotransferase (AGL)’s enzymatic function, inhibition of glycogenolysis, and tumor progression. Reverse transcription polymerase chain reaction (RT-PCR) analysis for glycogen phosphorylase brain (PYGB) (A) and liver (PYGL) (B) in UMUC3 cells transduced with short-hairpin (sh) RNAs. The terms shPYGB and shPYGL 1/2 indicate two different shRNAs used against glycogen phosphorylase brain and liver isoforms, respectively; shPYGB 1 and 2 are the shRNAs TRCN0000153339 and TRCN0000157479, respectively, described in the Supplementary Methods (available online); shPYGL 1 and 2 are the shRNAs TRCN0000119082 and TRCN0000119083, respectively, described in the Supplementary Methods. *P < .001 by two-sided Student t test. C) Anchorage-independent growth of UMUC3 cells transduced with shRNAs against glycogen phosphorylase brain (shPYGB1 and shPYGB2) and liver (shPYGL1 and shPYGL2) isoforms (n = 3). D, E) RT-PCR analysis for glycogen phosphorylase brain (D) and liver (E) isoform 48 hours after transient knockdown of PYGB in UMUC3 cells having stable PYGL knocked down. The small interfering RNA SMART pool from Dharmacon was used for PYGB knockdown (Supplementary Methods, available online); PYGL stable knockdown achieved with shRNA TRCN0000119082 was used for the experiment. *P < .001 by two-sided Student t test. F) Anchorage-independent growth of UMUC3 cells with dual knockdown of glycogen phosphorylase brain and liver isoform (n = 3). G) Cartoon of AGL showing the enzymatic domains. H) UMUC3 shCTL (cells transduced with control plasmid) and shAGL (cells with stable knockdown of AGL) cells were transfected with wild-type AGL, AGL transferase-null (L620P), or glycosidase-null (R1147G) variant constructs. AGL wild-type and variant overexpression was detected by western blot analysis. I) UMUC3 shAGL cells transfected with wild-type AGL and AGL enzymatic null variants were tested in an anchorage-independent growth assay (n = 3).*P < .001 by two-sided Student t test. Mean ± SD is presented for all the data in the figure. All scale bars represent a size of 0.4cm.
Figure 6.
Figure 6.
Amylo-α-1, 6-glucosidase, 4-α-glucanotransferase (AGL) expression and tumor growth in vivo. A) Nu/nu mice were injected subcutaneously on both flanks with UMUC3 expressing AGL short-hairpin RNA (shRNA) or the nontarget shRNA. Tumor volume was measured over time. P values represent the statistical difference by autocorrelation structure of order 1 method (13) of the total tumor volumes between the shAGL and shCTL tumors including tumors that did not grow from the total of 10 injection sites. B) Subcutaneous tumors formed from shAGL UMUC3 cells have statistically significant increases in proliferation (Ki-67, P = .04) and angiogenesis (CD-34, P = .03) markers compared to tumors with the control shRNA (shCTL) cells as determined by immunohistochemistry. Scales represent a size of 20 µm. C) UMUC3 cells were transiently transfected with an AGL-expressing construct. Cell lysates were collected 72 hours after transfection, and overexpression of AGL was determined by western blot analysis. D) UMUC3 cells transiently overexpressing AGL had reduced anchorage-independent growth in soft agar (n = 3, *P < .001). Mean ± SD is represented in the figure. Scale bars represent a size of 0.4cm. E) AGL was stably overexpressed in UMUC3 cells already transfected with shCTL and overexpression was determined by western blot analysis. Five mice each were injected on both flanks with 250000 cells per site of shCTL UMUC3 cells stably overexpressing AGL and control plasmid. Mice injected with shCTL UMUC3 cells overexpressing AGL had reduced tumor growth compared to mice injected with shCTL UMUC3 cells harboring empty vector. Error bars represent SD. *P < .001 by two-sided Student t test (D) or by repeated-measures analysis using an autocorrelation structure of order 1 (A, E).
Figure 7.
Figure 7.
Amylo-α-1, 6-glucosidase, 4-α-glucanotransferase (AGL) loss and metabolic reprogramming. UMUC3 shCTL (cells transduced with control plasmid) and shAGL (cells with stable knockdown of AGL) cells were treated with 13C6–glucose–containing media followed by collection of cellular extracts and media for analysis by NMR, gas chromatography-mass spectrometry (GC-MS), and Fourier transform ion cyclotron resonance mass spectrometry (FT-ICR-MS). A) 13C6–glucose consumption (P = .04) (i), 13C3–lactate export (P > .05) (ii), and 13C6–glucose to 13C3–lactate conversion (P = .003) (iii) in the media 24 hours after 13C6–glucose treatment by UMUC3 shCTL and shAGL cells as analyzed by 1H NMR. B) Uptake of essential amino acids from cell culture media, as analyzed by GC-MS. Cys, Ile, Leu, Met, Phe, Thr, Tyr, and Val indicate cysteine, isoleucine, leucine, methionine, phenylalanine, threonine, tryptophan, and valine, respectively. *P = .02, .04, .04, .04, .04, .01, .04, and .03, respectively. C, i–iv) 13C-amino acid accumulation from glucose in UMUC3 shCTL and shAGL cells by 1D 1H HSQC NMR analysis. Ala, Asp, Glu, and Gly stand for alanine, aspartate, glutamate, and glycine, respectively. *P = .02, .009, .02, and .01, respectively. D) Krebs cycle intermediate 13C-citrate buildup in UMUC3 shCTL and shAGL cells. *P = .04. E) GC-MS analysis for buildup of (i) serine (Ser) and (ii) glycine (*P = .03, <.001, and = .03, respectively) (Gly) from 13C6-glucose and nonglucose sources in the above-mentioned cells. m0 indicates all 12C isotopologue derived from nonglucose sources, whereas m1-3 indicates 1-3 13C carbon-containing isotopologues derived from labeled glucose. F) Increased incorporation of 13C carbon from 13C6–glucose into the adenine base of ATP in UMUC3 cells without AGL, as analyzed by FT-ICR-MS (*P = .04). G) Increased 13C carbon incorporation from glucose into the ribose moiety of adenine nucleotides (AXP) as analyzed by 1D 1H HSQC NMR (*P = .03). P value by two-sided Student t test. Mean ± SD is represented in the figure.
Figure 8.
Figure 8.
Serine hydroxymethyltransferase 2 (SHMT2)– and amylo-α-1, 6-glucosidase, 4-α-glucanotransferase (AGL)–mediated tumor growth. A) Quantitative reverse transcription polymerase chain reaction for SHMT2 mRNA expression with AGL loss in UMUC3 and T24T cells (*P = .02 and .01, respectively, by two-sided Student t test). Mean ± SD is represented. B) SHMT2 loss and anchorage-independent growth of UMUC3 and T24T cells with AGL loss compared to cells transduced with control short-hairpin RNA (*P < .001 by two-sided Student t test). Mean ± SD is represented. C) SHMT2 mRNA expression in human urothelial tumors (total n = 239) compared to human normal bladder tissue (total n = 78) in two independent datasets. Horizontal lines represent median of SHMT2 expression. Differences in distributions were tested by Wilcoxon rank-sum test. D) SHMT2 expression and survival rates. Patients in the independent dataset were divided into two groups using median SHMT2 expression. The two patient groups were compared using Cox proportional hazards models. Hazard ratios (HRs) with 95% confidence intervals (CIs) and log-rank P values are shown. Numbers in parentheses are number of deaths followed by number of patients in each group. All statistical tests were two-sided.

Similar articles

Cited by

  • Androgen Receptor Regulates CD44 Expression in Bladder Cancer.
    Sottnik JL, Vanderlinden L, Joshi M, Chauca-Diaz A, Owens C, Hansel DE, Sempeck C, Ghosh D, Theodorescu D. Sottnik JL, et al. Cancer Res. 2021 Jun 1;81(11):2833-2846. doi: 10.1158/0008-5472.CAN-20-3095. Epub 2021 Mar 9. Cancer Res. 2021. PMID: 33687952 Free PMC article.
  • A Festschrift in Honor of Edward M. Messing, MD, FACS.
    Joseph JV, Brasacchio R, Fung C, Reeder J, Bylund K, Sahasrabudhe D, Yeh SY, Ghazi A, Fultz P, Rubens D, Wu G, Singer E, Schwarz E, Mohile S, Mohler J, Theodorescu D, Lee YF, Okunieff P, McConkey D, Rashid H, Chang C, Fradet Y, Guru K, Kukreja J, Sufrin G, Lotan Y, Bailey H, Noyes K, Schwartz S, Rideout K, Bratslavsky G, Campbell SC, Derweesh I, Abrahamsson PA, Soloway M, Gomella L, Golijanin D, Svatek R, Frye T, Lerner S, Palapattu G, Wilding G, Droller M, Trump D. Joseph JV, et al. Bladder Cancer. 2018 Oct 3;4(Suppl 1):S1-S43. doi: 10.3233/BLC-189037. Bladder Cancer. 2018. PMID: 30443561 Free PMC article. No abstract available.
  • Genetics of enzymatic dysfunctions in metabolic disorders and cancer.
    Mahé M, Rios-Fuller TJ, Karolin A, Schneider RJ. Mahé M, et al. Front Oncol. 2023 Aug 2;13:1230934. doi: 10.3389/fonc.2023.1230934. eCollection 2023. Front Oncol. 2023. PMID: 37601653 Free PMC article. Review.
  • Mutation of the TERT promoter, switch to active chromatin, and monoallelic TERT expression in multiple cancers.
    Stern JL, Theodorescu D, Vogelstein B, Papadopoulos N, Cech TR. Stern JL, et al. Genes Dev. 2015 Nov 1;29(21):2219-24. doi: 10.1101/gad.269498.115. Epub 2015 Oct 29. Genes Dev. 2015. PMID: 26515115 Free PMC article.
  • Patient Mutation Directed shRNA Screen Uncovers Novel Bladder Tumor Growth Suppressors.
    Hensel J, Duex JE, Owens C, Dancik GM, Edwards MG, Frierson HF, Theodorescu D. Hensel J, et al. Mol Cancer Res. 2015 Sep;13(9):1306-15. doi: 10.1158/1541-7786.MCR-15-0130. Epub 2015 Jun 15. Mol Cancer Res. 2015. PMID: 26078295 Free PMC article.

References

    1. Gregory MA, Phang TL, Neviani P, et al. Wnt/Ca2+/NFAT signaling maintains survival of Ph+ leukemia cells upon inhibition of Bcr-Abl. Cancer Cell. 2010;18(1):74–87. - PMC - PubMed
    1. Coussens MJ, Corman C, Fischer AL, et al. MISSION LentiPlex pooled shRNA library screening in mammalian cells. J Vis Exp. 2011;58. 10.3791/3305. - PMC - PubMed
    1. Siegel R, Naishadham D, Jemal A. Cancer statistics, 2013. CA Cancer J Clin. 2013;63(1):11–30. - PubMed
    1. Gildea JJ, Golden WL, Harding MA, et al. Genetic and phenotypic changes associated with the acquisition of tumorigenicity in human bladder cancer. Genes Chromosomes Cancer. 2000;27(3):252–263. - PubMed
    1. Nitz MD, Harding MA, Smith SC, et al. RREB1 transcription factor splice variants in urologic cancer. Am J Pathol. 2011;179(1):477–486. - PMC - PubMed

Publication types

Substances