

Autophagic clearance of mitochondria in the kidney copes with metabolic acidosis
- PMID: 24700866
- PMCID: PMC4178439
- DOI: 10.1681/ASN.2013090986
Autophagic clearance of mitochondria in the kidney copes with metabolic acidosis
Abstract
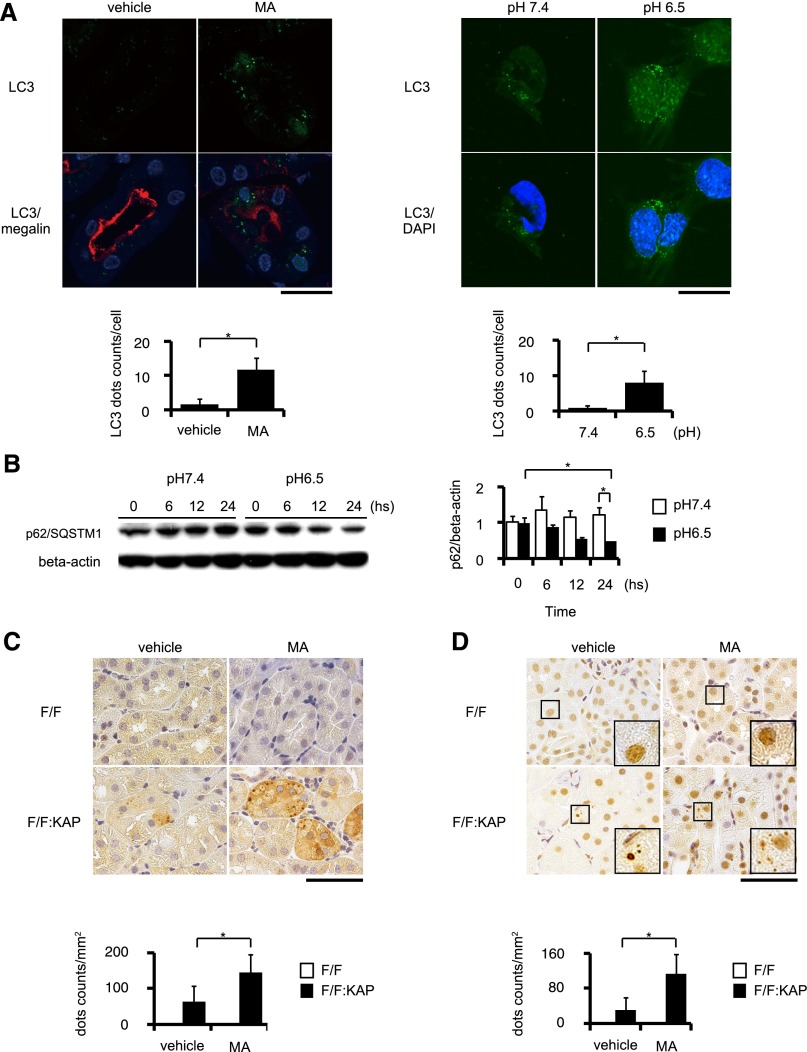
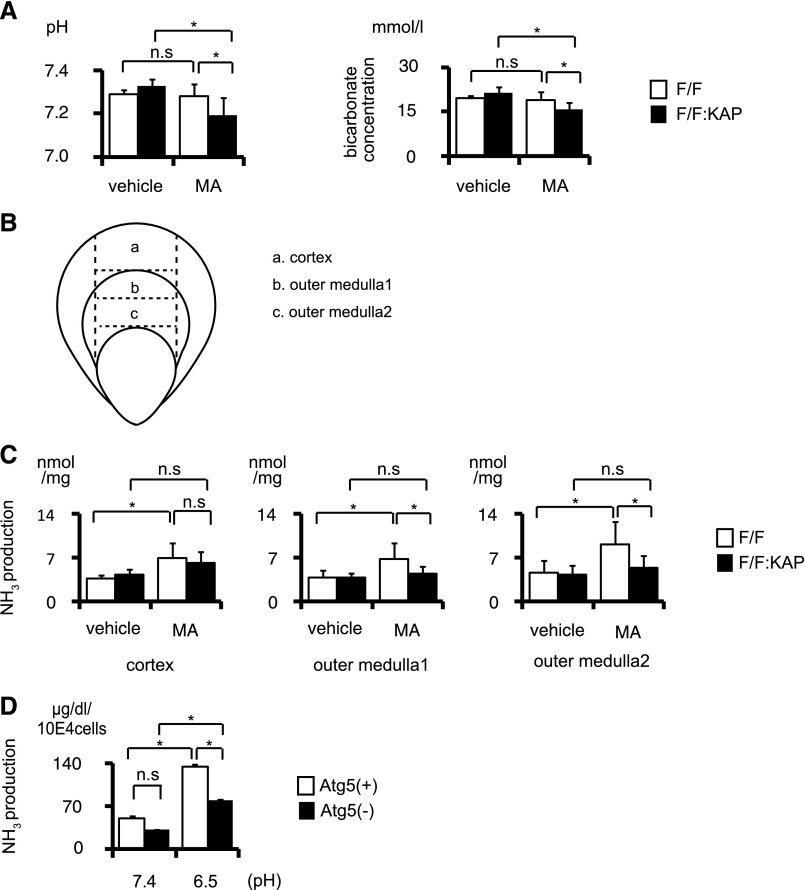
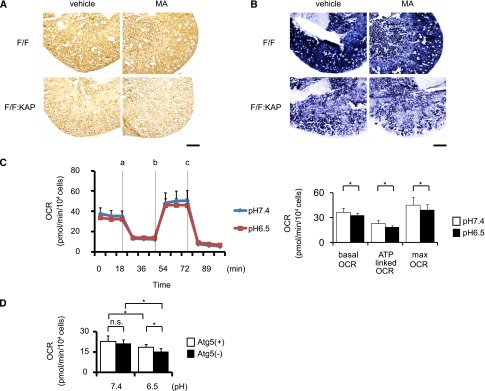
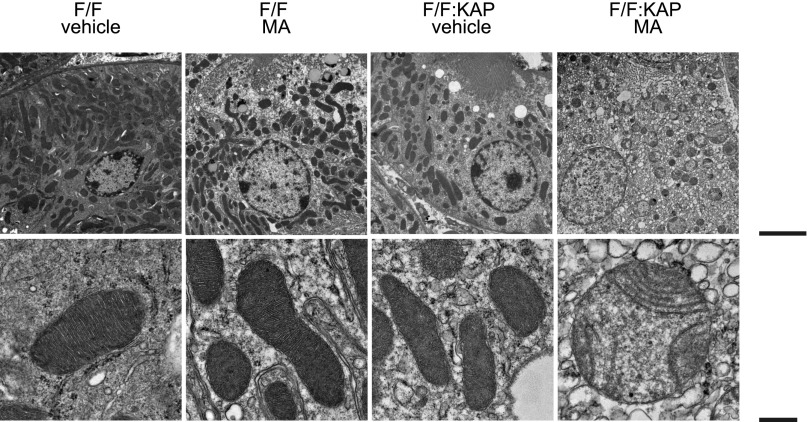
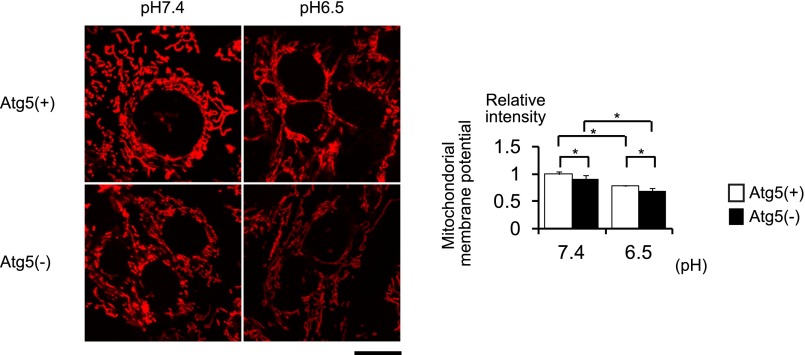
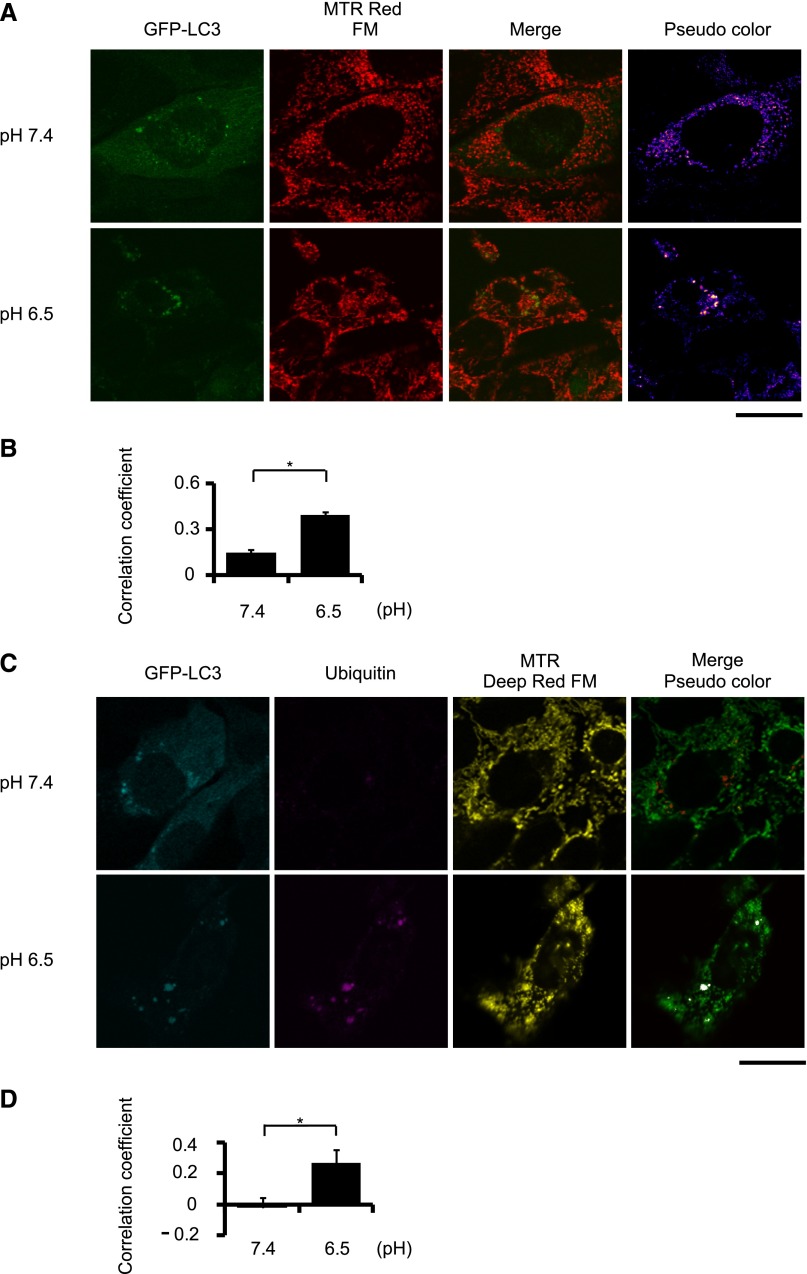
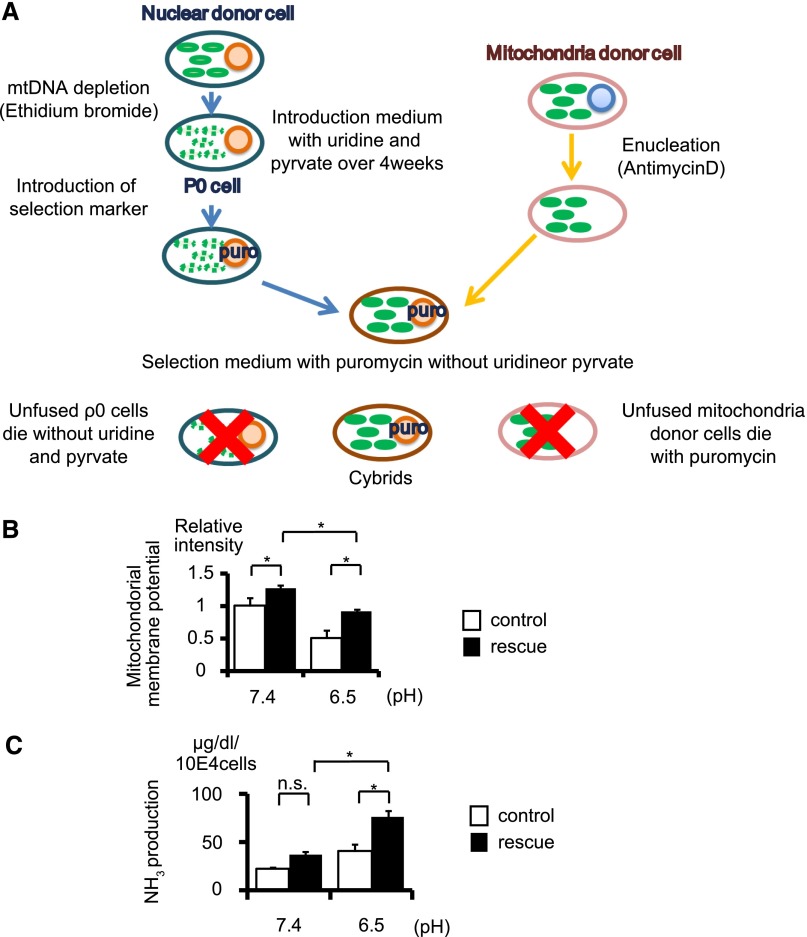
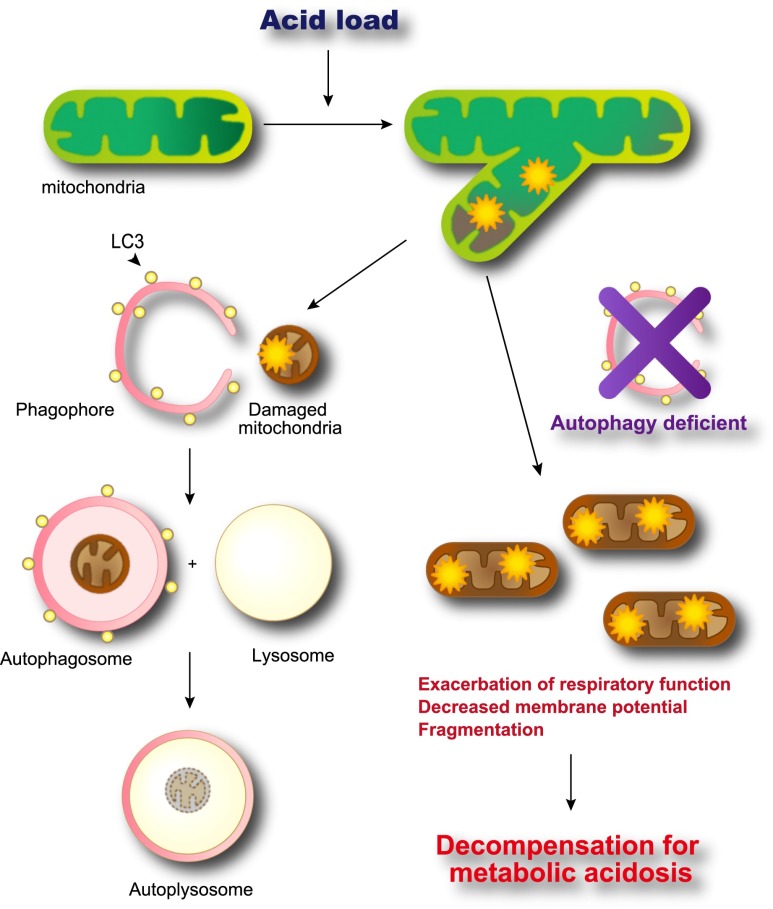
Metabolic acidosis, a common complication of CKD, causes mitochondrial stress by undefined mechanisms. Selective autophagy of impaired mitochondria, called mitophagy, contributes toward maintaining cellular homeostasis in various settings. We hypothesized that mitophagy is involved in proximal tubular cell adaptations to chronic metabolic acidosis. In transgenic mice expressing green fluorescent protein-tagged microtubule-associated protein 1 light chain 3 (GFP-LC3), NH4Cl loading increased the number of GFP puncta exclusively in the proximal tubule. In vitro, culture in acidic medium produced similar results in proximal tubular cell lines stably expressing GFP-LC3 and facilitated the degradation of SQSTM1/p62 in wild-type cells, indicating enhanced autophagic flux. Upon acid loading, proximal tubule-specific autophagy-deficient (Atg5-deficient) mice displayed significantly reduced ammonium production and severe metabolic acidosis compared with wild-type mice. In vitro and in vivo, acid loading caused Atg5-deficient proximal tubular cells to exhibit reduced mitochondrial respiratory chain activity, reduced mitochondrial membrane potential, and fragmented morphology with marked swelling in mitochondria. GFP-LC3-tagged autophagosomes colocalized with ubiquitinated mitochondria in proximal tubular cells cultured in acidic medium, suggesting that metabolic acidosis induces mitophagy. Furthermore, restoration of Atg5-intact nuclei in Atg5-deficient proximal tubular cells increased mitochondrial membrane potential and ammoniagenesis. In conclusion, metabolic acidosis induces autophagy in proximal tubular cells, which is indispensable for maintaining proper mitochondrial functions including ammoniagenesis, and thus for adapted urinary acid excretion. Our results provide a rationale for the beneficial effect of alkali supplementation in CKD, a condition in which autophagy may be reduced, and suggest a new therapeutic option for acidosis by modulating autophagy.
Copyright © 2014 by the American Society of Nephrology.
Figures
Similar articles
-
Clearance of damaged mitochondria via mitophagy is important to the protective effect of ischemic preconditioning in kidneys.Autophagy. 2019 Dec;15(12):2142-2162. doi: 10.1080/15548627.2019.1615822. Epub 2019 May 22. Autophagy. 2019. PMID: 31066324 Free PMC article.
-
Time-dependent dysregulation of autophagy: Implications in aging and mitochondrial homeostasis in the kidney proximal tubule.Autophagy. 2016 May 3;12(5):801-13. doi: 10.1080/15548627.2016.1159376. Epub 2016 Mar 17. Autophagy. 2016. PMID: 26986194 Free PMC article.
-
Autophagy protects kidney from phosphate-induced mitochondrial injury.Biochem Biophys Res Commun. 2020 Apr 9;524(3):636-642. doi: 10.1016/j.bbrc.2020.01.137. Epub 2020 Feb 3. Biochem Biophys Res Commun. 2020. PMID: 32029271
-
Mitochondrial dysfunction and mitophagy: the beginning and end to diabetic nephropathy?Br J Pharmacol. 2014 Apr;171(8):1917-42. doi: 10.1111/bph.12503. Br J Pharmacol. 2014. PMID: 24720258 Free PMC article. Review.
-
Mitophagy in the retina: Viewing mitochondrial homeostasis through a new lens.Prog Retin Eye Res. 2023 Sep;96:101205. doi: 10.1016/j.preteyeres.2023.101205. Epub 2023 Jul 15. Prog Retin Eye Res. 2023. PMID: 37454969 Review.
Cited by
-
Age-related TFEB downregulation in proximal tubules causes systemic metabolic disorders and occasional apolipoprotein A4-related amyloidosis.JCI Insight. 2024 Dec 19;10(3):e184451. doi: 10.1172/jci.insight.184451. JCI Insight. 2024. PMID: 39699959 Free PMC article.
-
Excess 25-hydroxyvitamin D3 exacerbates tubulointerstitial injury in mice by modulating macrophage phenotype.Kidney Int. 2015 Nov;88(5):1013-29. doi: 10.1038/ki.2015.210. Epub 2015 Jul 15. Kidney Int. 2015. PMID: 26176830
-
Eicosapentaenoic acid attenuates renal lipotoxicity by restoring autophagic flux.Autophagy. 2021 Jul;17(7):1700-1713. doi: 10.1080/15548627.2020.1782034. Epub 2020 Jun 28. Autophagy. 2021. PMID: 32546086 Free PMC article.
-
Autophagy inhibition re-sensitizes pulse stimulation-selected paclitaxel-resistant triple negative breast cancer cells to chemotherapy-induced apoptosis.Breast Cancer Res Treat. 2015 Feb;149(3):619-29. doi: 10.1007/s10549-015-3283-9. Epub 2015 Feb 1. Breast Cancer Res Treat. 2015. PMID: 25638397 Free PMC article.
-
Multipronged regulation of autophagy and apoptosis: emerging role of TRIM proteins.Cell Mol Biol Lett. 2024 Jan 16;29(1):13. doi: 10.1186/s11658-023-00528-8. Cell Mol Biol Lett. 2024. PMID: 38225560 Free PMC article. Review.
References
-
- Phisitkul S, Khanna A, Simoni J, Broglio K, Sheather S, Rajab MH, Wesson DE: Amelioration of metabolic acidosis in patients with low GFR reduced kidney endothelin production and kidney injury, and better preserved GFR. Kidney Int 77: 617–623, 2010 - PubMed
-
- Mahajan A, Simoni J, Sheather SJ, Broglio KR, Rajab MH, Wesson DE: Daily oral sodium bicarbonate preserves glomerular filtration rate by slowing its decline in early hypertensive nephropathy. Kidney Int 78: 303–309, 2010 - PubMed
-
- Curthoys NP, Taylor L, Hoffert JD, Knepper MA: Proteomic analysis of the adaptive response of rat renal proximal tubules to metabolic acidosis. Am J Physiol Renal Physiol 292: F140–F147, 2007 - PubMed
Publication types
MeSH terms
Substances
LinkOut - more resources
Full Text Sources
Other Literature Sources
Research Materials
