. 2014 Oct;25(10):2241-53.
doi: 10.1681/ASN.2013111234. Epub 2014 Apr 3.

A protein kinase A-independent pathway controlling aquaporin 2 trafficking as a possible cause for the syndrome of inappropriate antidiuresis associated with polycystic kidney disease 1 haploinsufficiency

Affiliations

A protein kinase A-independent pathway controlling aquaporin 2 trafficking as a possible cause for the syndrome of inappropriate antidiuresis associated with polycystic kidney disease 1 haploinsufficiency

Grazia Tamma et al. J Am Soc Nephrol. 2014 Oct.

Abstract

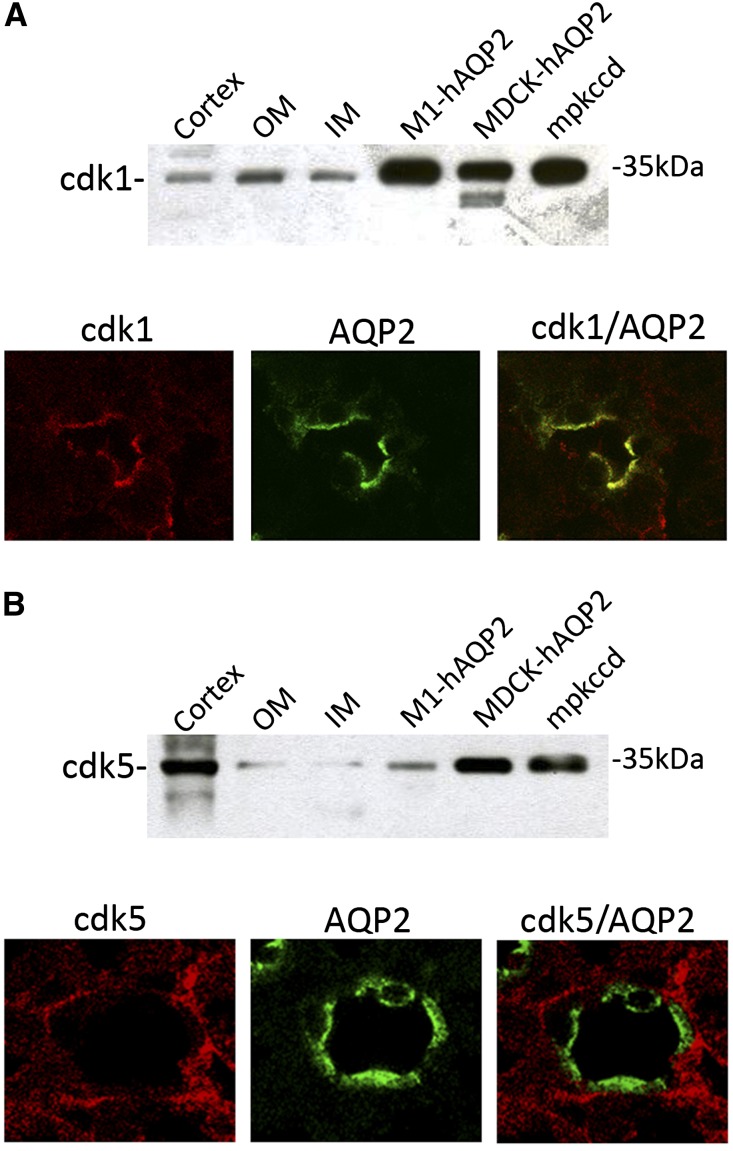
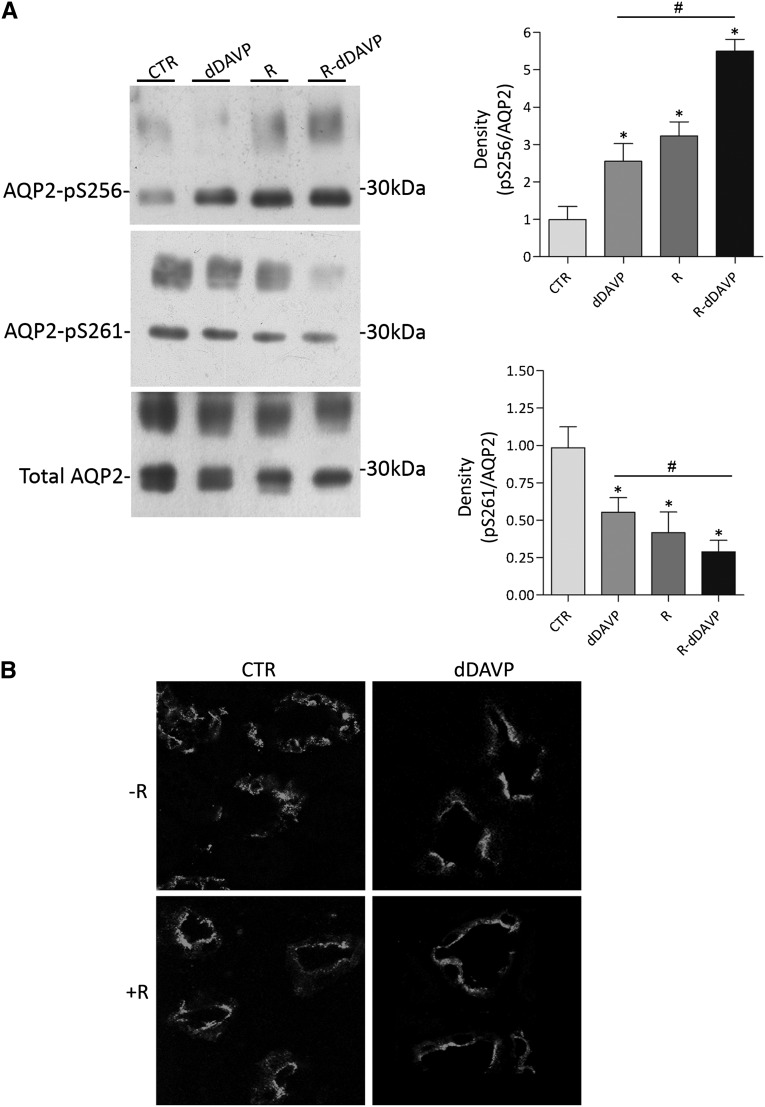
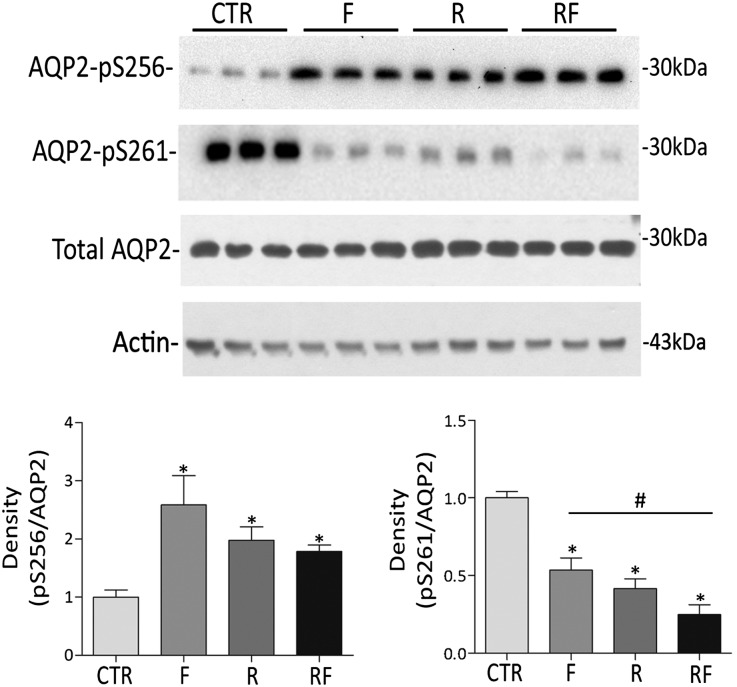
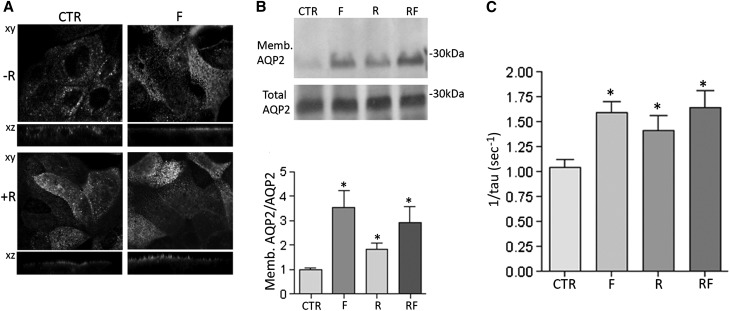
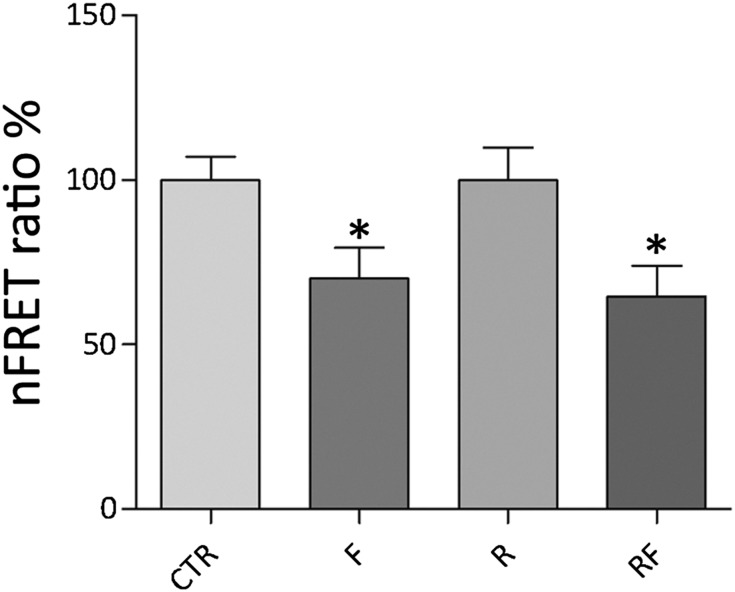
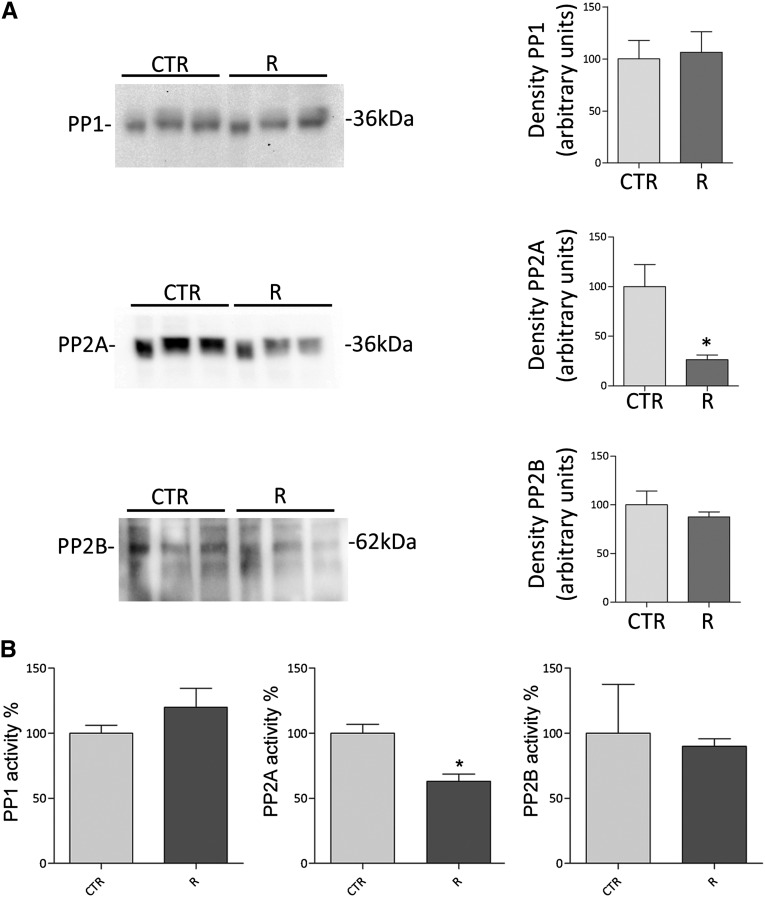
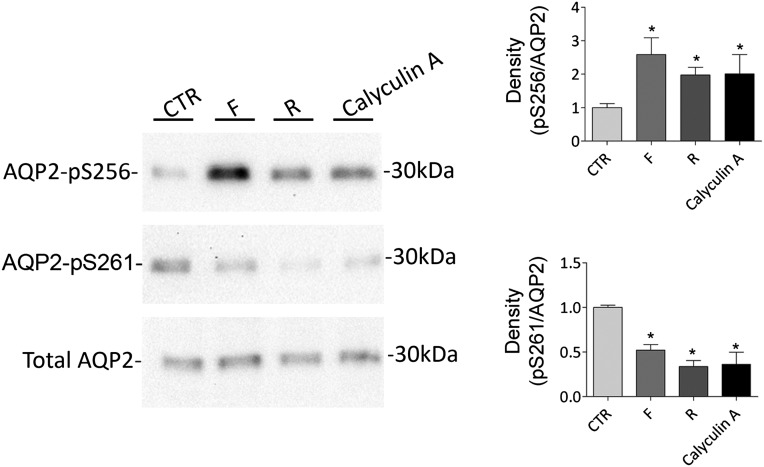
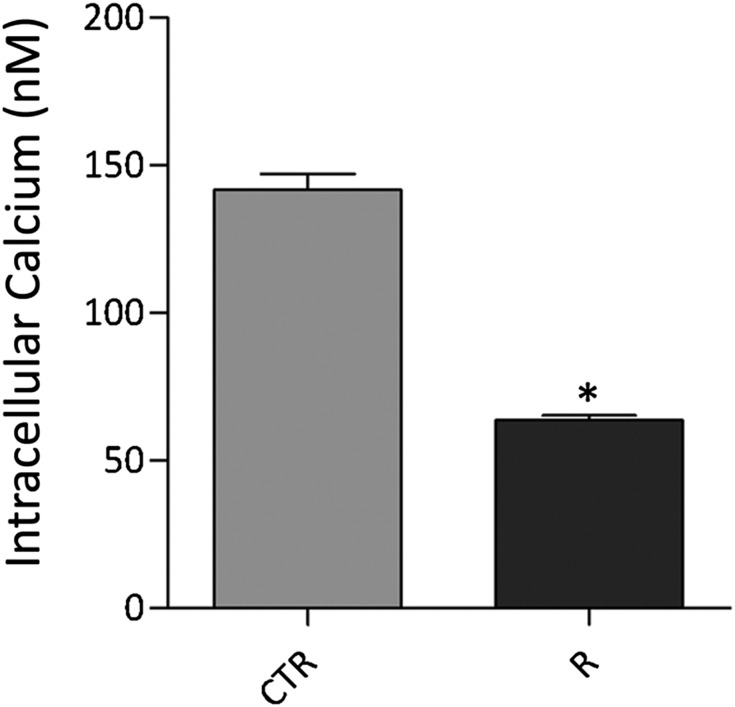
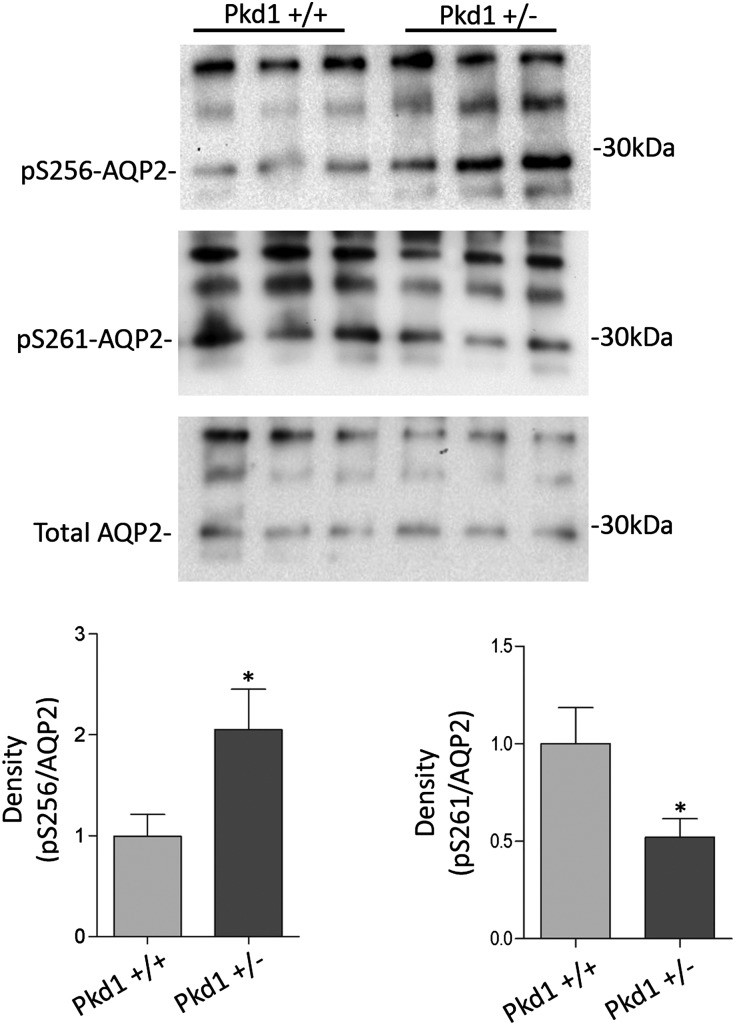
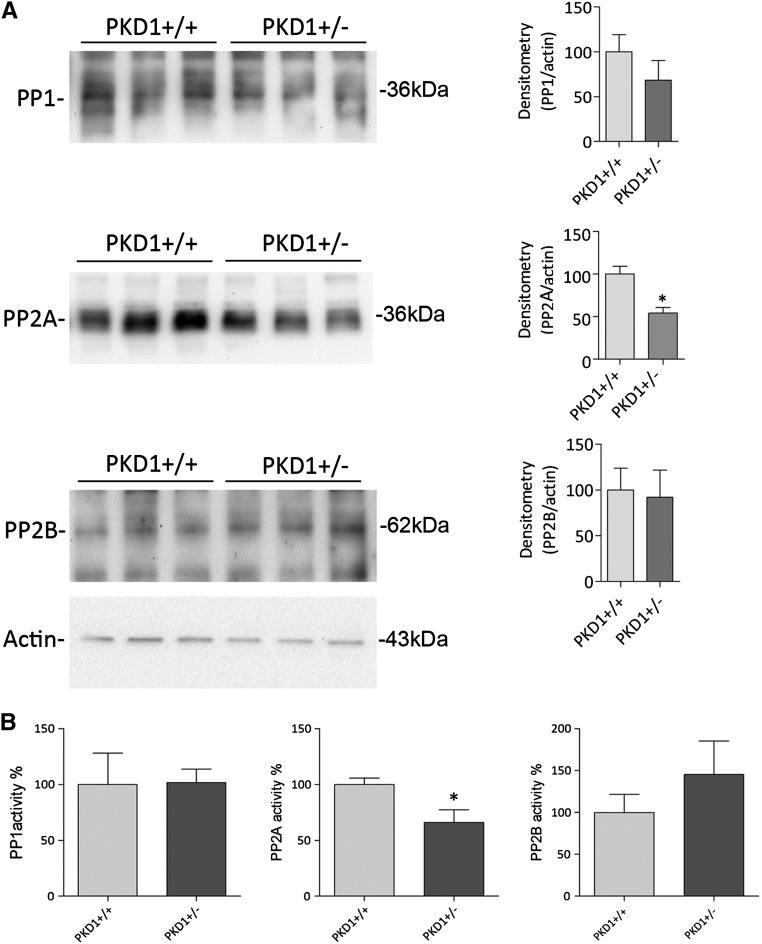
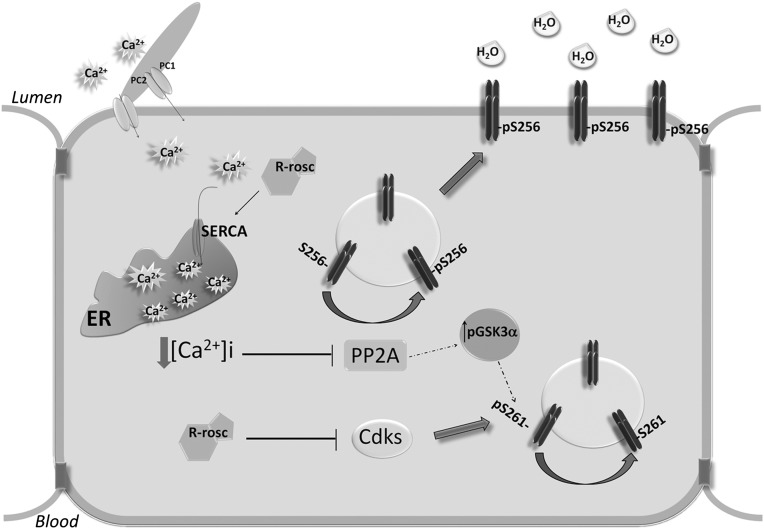
Renal water reabsorption is controlled by arginine vasopressin (AVP), which binds to V2 receptors, resulting in protein kinase A (PKA) activation, phosphorylation of aquaporin 2 (AQP2) at serine 256, and translocation of AQP2 to the plasma membrane. However, AVP also causes dephosphorylation of AQP2 at S261. Recent studies showed that cyclin-dependent kinases (cdks) can phosphorylate AQP2 peptides at S261 in vitro. We investigated the possible role of cdks in the phosphorylation of AQP2 and identified a new PKA-independent pathway regulating AQP2 trafficking. In ex vivo kidney slices and MDCK-AQP2 cells, R-roscovitine, a specific inhibitor of cdks, increased pS256 levels and decreased pS261 levels. The changes in AQP2 phosphorylation status were paralleled by increases in cell surface expression of AQP2 and osmotic water permeability in the absence of forskolin stimulation. R-Roscovitine did not alter cAMP-dependent PKA activity but specifically reduced protein phosphatase 2A (PP2A) expression and activity in MDCK cells. Notably, we found reduced PP2A expression and activity and reduced pS261 levels in Pkd1(+/-) mice displaying a syndrome of inappropriate antidiuresis with high levels of pS256, despite unchanged AVP and cAMP. Similar to previous findings in Pkd1(+/-) mice, R-roscovitine treatment caused a significant decrease in intracellular calcium in MDCK cells. Our data indicate that reduced activity of PP2A, secondary to reduced intracellular Ca(2+) levels, promotes AQP2 trafficking independent of the AVP-PKA axis. This pathway may be relevant for explaining pathologic states characterized by inappropriate AVP secretion and positive water balance.


Figures

Figure 1.
Figure 1.
Expression and distribution of cdk1 and cdk5 in the kidney and renal cells. Immunoblot (upper panels) and immunohistochemical (lower panels) analysis of (A) cdk1 or (B) cdk5 in kidney cortex, outer medulla (OM), inner (IM) medulla, and three different cell models (M1, MDCK, and mpkCCD cells) used to study AQP2 trafficking. For immunoblotting, equal amounts of proteins from renal fractions (15 µg/lane) and cells (30 µg/lane) were immunoblotted using specific antibodies against cdk1 or cdk5. The mass of cdk1/5 is indicated on the right. Immunohistochemistry: renal sections were incubated with (A) cdk1-, (B) cdk5-, and AQP2-specific antibodies, and collecting ducts expression was analyzed using confocal imaging. Cdk1 and AQP2 colocalized in renal principal cells. Cdk5 and AQP2 were expressed in principal cells but did not colocalize.
Figure 2.
Figure 2.
Effect of R-roscovitine on AQP2 phosphorylation and trafficking in rat kidney slices. (A) Effect of R-roscovitine on AQP2 S256 and S261 phosphorylations ex vivo. Rat kidney slices were treated as described in Concise Methods. Immunoprecipitated complexes were subjected to immunoblotting for total AQP2, AQP2-pS256, and AQP2-pS261. R-roscovitine increases AQP2-pS256, whereas it reduces AQP2-pS261. Signals were semiquantified by densitometry (right panel). *Samples significantly (means±SEMs; P<0.05) different from controls; #sample significantly (means±SEMs; P<0.05) different from dDAVP. (B) Effect of R-roscovitine on AQP2 distribution in renal kidney slices. Fresh renal slices were treated as described in Concise Methods, stained for AQP2, and subjected to confocal laser scanning microscopy (Leica TCS SP2 camera; Leica Microsystems). R-roscovitine (R) promotes AQP2 trafficking, regardless dDAVP stimulation.
Figure 3.
Figure 3.
Effect of R-roscovitine on AQP2 S256 and S261 phosphorylation in MDCK-hAQP2 cells. MDCK-hAQP2 cells were left untreated (CTR) or stimulated with forskolin (F) in the absence (R) or the presence of R-roscovitine (RF). After treatments, cells were lysed and subjected to immunoprecipitation. Immunocomplexes were analyzed by immunoblotting for total AQP2, AQP2-pS256, and AQP2-pS261. R-roscovitine treatment increases AQP2-pS256, whereas reduces AQP2-pS261. Signals were semiquantified by densitometry (lower panel). *Samples significantly (means±SEMs; P<0.05) different from controls; #sample significantly (means±SEMs; P<0.05) different from forskolin condition. No change in the expression of the housekeeping protein actin was detected within the R-roscovitine incubation time used in this study.
Figure 4.
Figure 4.
Effect of R-roscovitine on AQP2 trafficking and function. (A) MDCK-hAQP2 cells were treated as already described and subjected to immunofluorescence studies to visualize AQP2 specifically. Confocal analysis reveals that R-roscovitine (R) increases the cell surface expression of AQP2 compared with cells left under basal condition (CTR). (B) On treatments, cells were subjected to cell surface biotinylation assay with Biocityn Hydrazide. Immunoblotting analysis of total and apical AQP2 indicates that R-roscovitine incubation increases AQP2 abundance at the apical plasma membrane. Densitometric analysis of the 29-kD biotinylated AQP2 band (lower panel) normalized to total AQP2 (means±SEMs; *P <0.05). (C) Time constant of cell swelling under hypotonic stimulus. Cells were grown and treated as described in Concise Methods. The time course of fluorescence changes in calcein-loaded cells indicates that R-roscovitine increases cell swelling ability regardless of forskolin stimulation (means±SEMs; *P<0.05).
Figure 5.
Figure 5.
Evaluation of PKA activity by FRET analysis. Histogram (means±SEMs; *P<0.05) compares changes of normalized FRET ratio between forskolin (F), R-roscovitine (R), R-roscovitine in presence of forskolin (RF), and control conditions (CTR). FRET studies suggest that R-roscovitine does not affect PKA activity.
Figure 6.
Figure 6.
Effect of R-roscovitine on protein phosphatase expression and activity in MDCK-hAQP2 cells. (A) Immunoblotting expression studies of protein phosphatases PP1, PP2A, and PP2B in MDCK-hAQP2 cells. Equal amounts of proteins from MDCK-hAQP2 cells left untreated (CTR) or incubated with R-roscovitine (R) were subjected to electrophoresis and immunoblotted using specific antibodies as described in Concise Methods. Immunoreactive signals were semiquantified by densitometry (right panel), indicating that R-roscovitine reduces only PP2A protein content. (B) Protein phosphatase activities were evaluated using an immunoprecitation assay kit as described in Concise Methods. Data (means±SEMs; *P<0.05) indicate that R-roscovitine decreases PP2A activity only.
Figure 7.
Figure 7.
Effect of calyculin-A on AQP2 phosphorylation at S256 and S261. Cells were grown to confluence and left unstimulated (CTR) or treated with forskolin (F), R-roscovitine (R), or calyculin-A. Protein lysates were subjected to electrophoresis and immunoblotting using antibodies against AQP2 phosphorylated at S256, S261, or total AQP2 (indicated). Statistical analysis (right panel) revealed that calyculin-A, similarly to R-roscovitine, increased the abundance of AQP2-pS256, whereas it decreased AQP2-pS261 relative to unstimulated cells; S256 or S261 phosphorylation was normalized against total AQP2, and control conditions were set to one. *Significant difference (P<0.05).
Figure 8.
Figure 8.
Effect of R-roscovitine on intracellular calcium content. MDCK cells were loaded with 4 µM Fura 2-AM for 15 minutes at 37°C in DMEM. Fluorescence measurements were carried out using Metafluor software (Molecular Devices, MDS Analytical Technologies). Free cytosolic [Ca2+] was calculated accordingly to Grynkiewicz formula. Data (mean±SEMs; *P<0.001) revealed that R-roscovitine (R) reduced intracellular calcium concentration compared with cells left under basal condition (CTR).
Figure 9.
Figure 9.
Phosphorylation of AQP2 at S256 and S261 in Pkd1+/− mice. Representative immunoblotting showing AQP2, AQP2-pS256, and AQP2-pS261 expression in kidneys isolated from Pkd1+/− mice compared with WT animals. Densitometry (on the right) indicates that AQP2-pS256 increases while pS261 decreases in Pkd1+/− mice. S256 and S261 phosphorylation was normalized against total AQP2, and control conditions were set to one. *Significant difference (P<0.05).
Figure 10.
Figure 10.
Protein phosphatase expression and activity in Pkd1+/− mice. (A) Immunoblotting evaluation of PP1, PP2A, and PP2B in Pkd1+/− mice. Equal amounts of proteins isolated from kidneys of WT and Pkd1+/− mice were subjected to electrophoresis and immunoblotted using specific antibodies, as described in Concise Methods. Immunoreactive signals were semiquantified by densitometry (right panel), indicating that only PP2A protein content decreases in Pkd1+/− mice significantly. (B) Protein phosphotase activities were evaluated using an immunoprecitation assay kit as described in Concise Methods. Data (means±SEMs; *P<0.05) indicate that only PP2A activity is reduced in transgenic Pkd1+/− animals compared with WT mice.
Figure 11.
Figure 11.
Phosphorylation of GSK3α. (A) Protein lysates isolated from Pkd1+/− mice and WT mice were subjected to electrophoresis and immunoblotting using antibodies against GSK3α and GSK3α-pS21. Statistical analysis (right panel) revealed that GSK3α-pS21 significantly increased in Pkd1+/− mice compared with the WT counterpart. GSK3α phosphorylation was normalized against total GSK3α, and GSK3α-pS21 in Pkd1+/+ mice was set to one. *Significant difference (P<0.05). (B) Rat renal kidney slices were prepared as described in Concise Methods. Total lysates from slices left untreated, stimulated with R-roscovitine, or stimulated with calyculin-A were subjected to immunoblotting for GSK3α and GSK3α-pS21. R-roscovitine and calyculin-A increase GSK3α-pS21. Signals were semiquantified by densitometry (right panel). Samples significantly (means±SEMs; *P<0.05) different from controls.
Figure 12.
Figure 12.
Identification of a PKA-independent pathway controlling AQP2 trafficking. Schematic model (detailed description in Discussion). ER, endoplasmic reticulum.

Similar articles

Cited by

References

    1. Tamma G, Procino G, Svelto M, Valenti G: Cell culture models and animal models for studying the patho-physiological role of renal aquaporins. Cell Mol Life Sci 69: 1931–1946, 2012 - PMC - PubMed
    1. Valenti G, Procino G, Tamma G, Carmosino M, Svelto M: Minireview: Aquaporin 2 trafficking. Endocrinology 146: 5063–5070, 2005 - PubMed
    1. Fenton RA, Pedersen CN, Moeller HB: New insights into regulated aquaporin-2 function. Curr Opin Nephrol Hypertens 22: 551–558, 2013 - PubMed
    1. McDill BW, Li SZ, Kovach PA, Ding L, Chen F: Congenital progressive hydronephrosis (cph) is caused by an S256L mutation in aquaporin-2 that affects its phosphorylation and apical membrane accumulation. Proc Natl Acad Sci U S A 103: 6952–6957, 2006 - PMC - PubMed
    1. Ahrabi AK, Terryn S, Valenti G, Caron N, Serradeil-Le Gal C, Raufaste D, Nielsen S, Horie S, Verbavatz JM, Devuyst O: PKD1 haploinsufficiency causes a syndrome of inappropriate antidiuresis in mice. J Am Soc Nephrol 18: 1740–1753, 2007 - PubMed

Publication types

LinkOut - more resources