

PASS-predicted hepatoprotective activity of Caesalpinia sappan in thioacetamide-induced liver fibrosis in rats
- PMID: 24701154
- PMCID: PMC3950979
- DOI: 10.1155/2014/301879
PASS-predicted hepatoprotective activity of Caesalpinia sappan in thioacetamide-induced liver fibrosis in rats
Retraction in
-
Retracted: PASS-Predicted Hepatoprotective Activity of Caesalpinia sappan in Thioacetamide-Induced Liver Fibrosis in Rats.ScientificWorldJournal. 2018 Aug 12;2018:7465402. doi: 10.1155/2018/7465402. eCollection 2018. ScientificWorldJournal. 2018. PMID: 30158841 Free PMC article.
Abstract
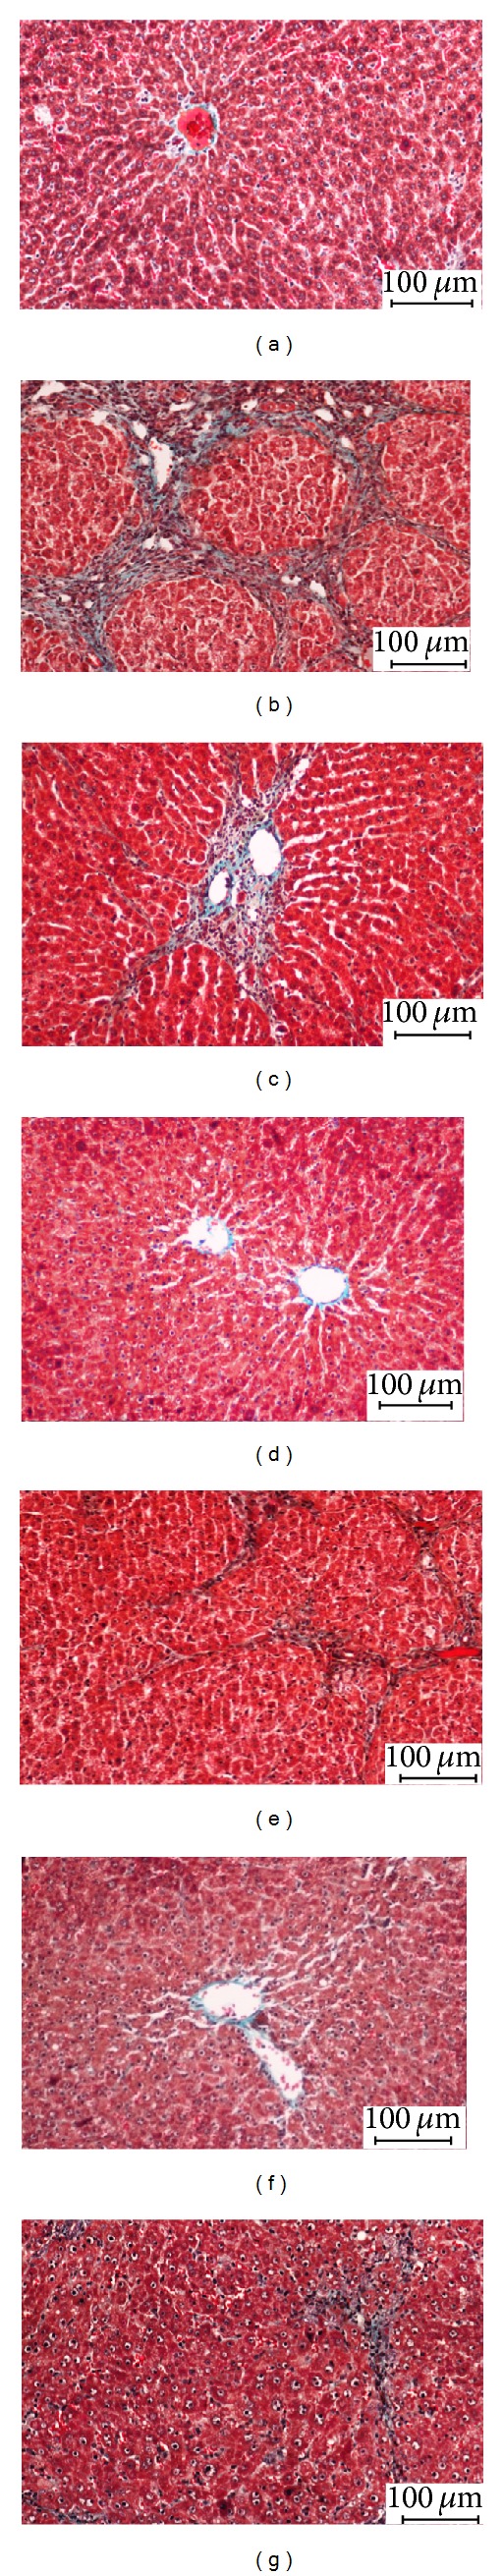
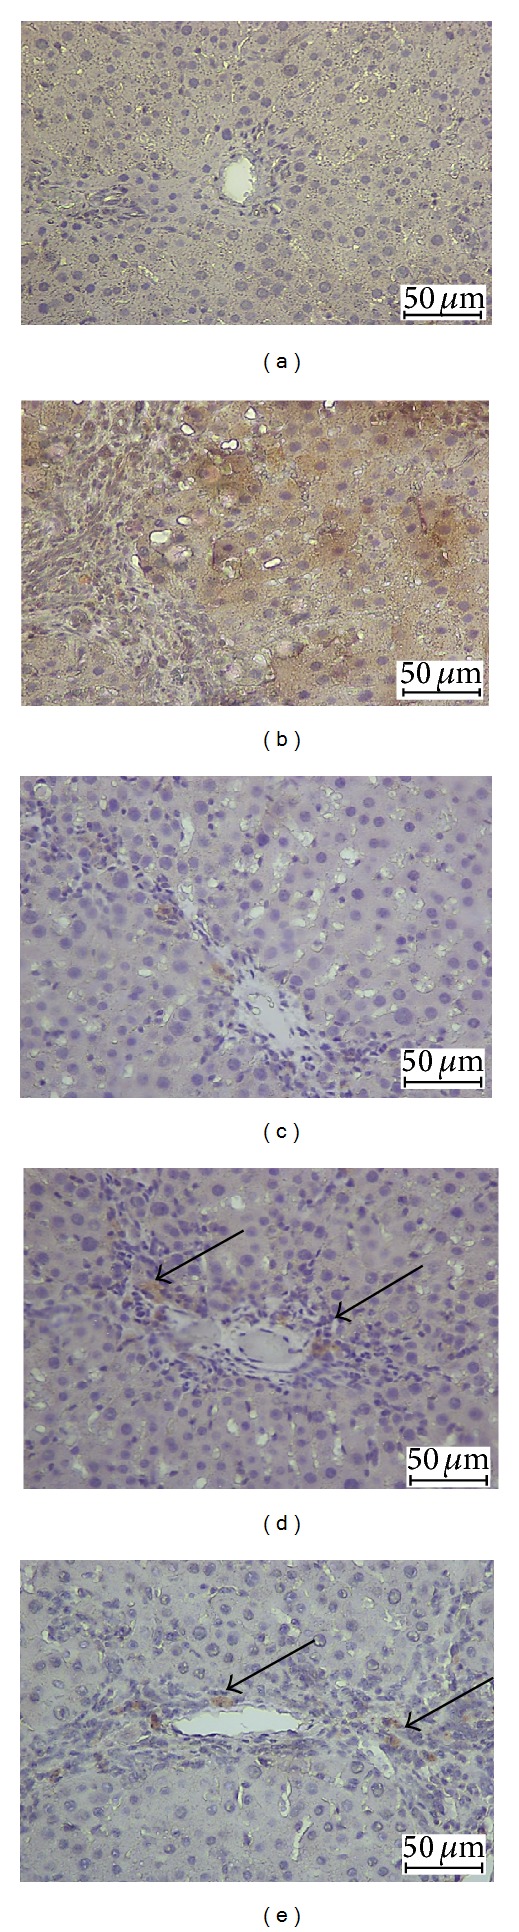
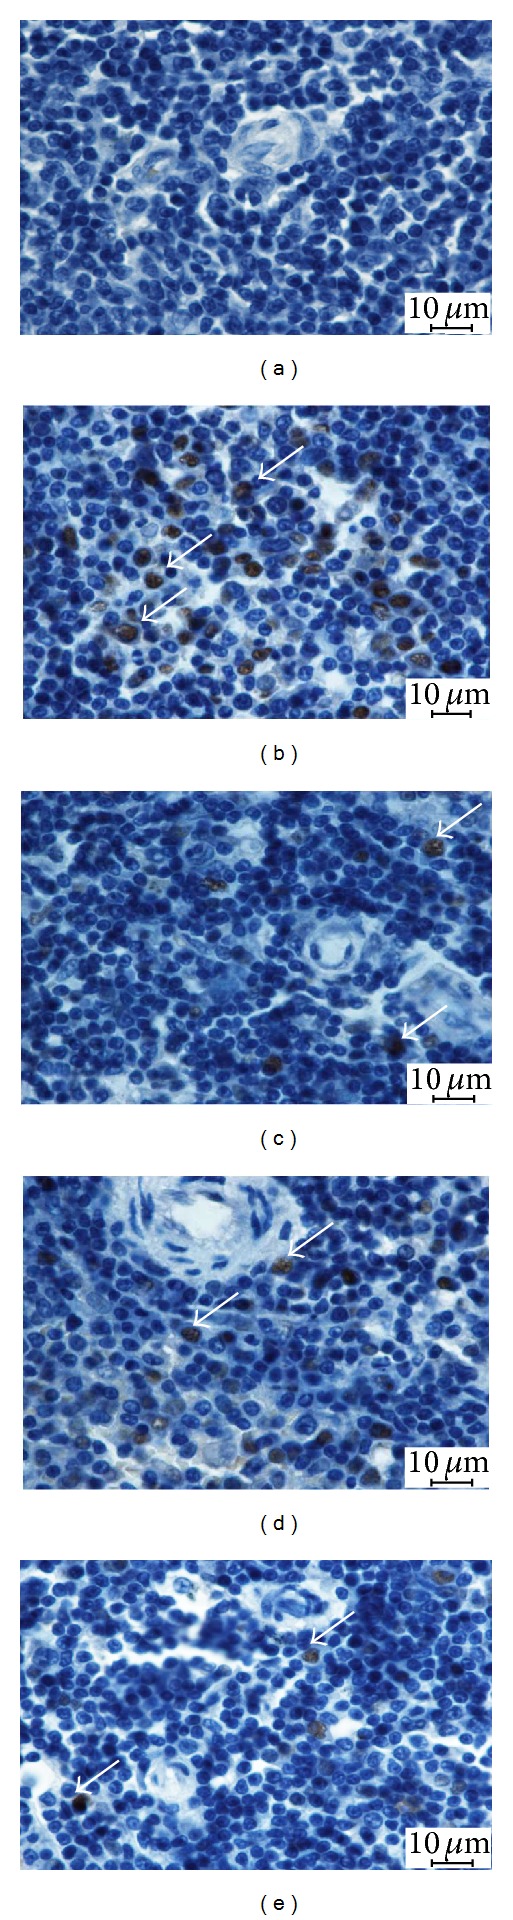
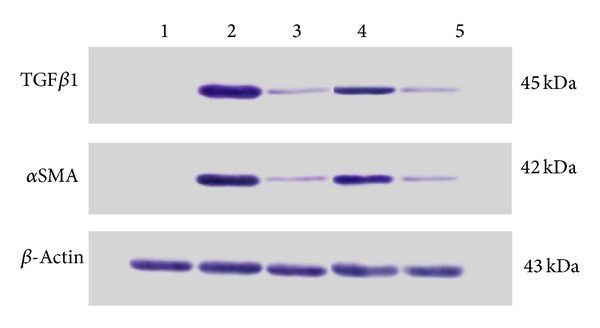
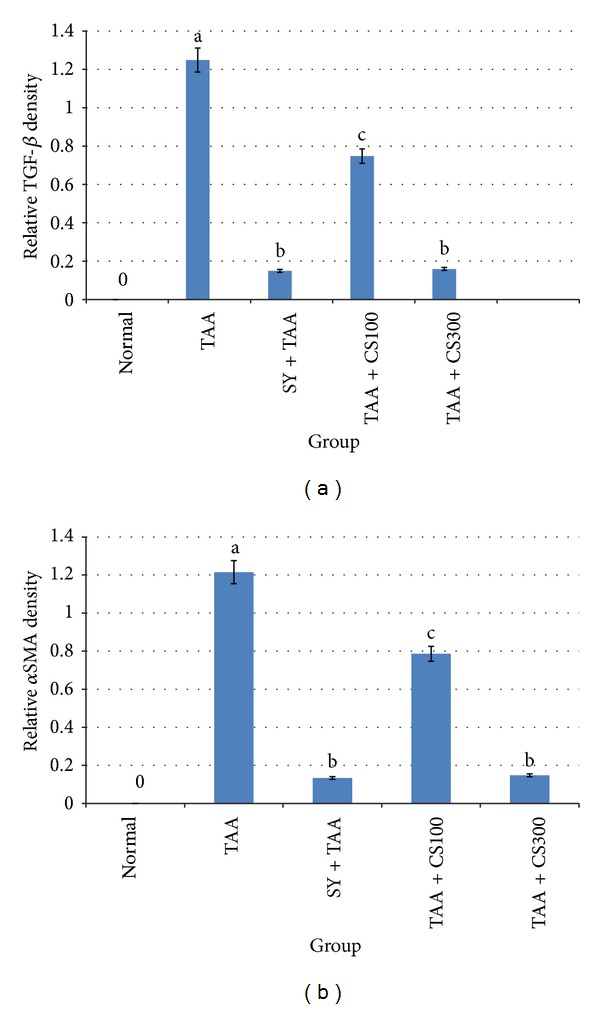
The antifibrotic effects of traditional medicinal herb Caesalpinia sappan (CS) extract on liver fibrosis induced by thioacetamide (TAA) and the expression of transforming growth factor β1 (TGF-β1), α-smooth muscle actin (αSMA), and proliferating cell nuclear antigen (PCNA) in rats were studied. A computer-aided prediction of antioxidant and hepatoprotective activities was primarily performed with the Prediction Activity Spectra of the Substance (PASS) Program. Liver fibrosis was induced in male Sprague Dawley rats by TAA administration (0.03% w/v) in drinking water for a period of 12 weeks. Rats were divided into seven groups: control, TAA, Silymarin (SY), and CS 300 mg/kg body weight and 100 mg/kg groups. The effect of CS on liver fibrogenesis was determined by Masson's trichrome staining, immunohistochemical analysis, and western blotting. In vivo determination of hepatic antioxidant activities, cytochrome P450 2E1 (CYP2E1), and matrix metalloproteinases (MPPS) was employed. CS treatment had significantly increased hepatic antioxidant enzymes activity in the TAA-treated rats. Liver fibrosis was greatly alleviated in rats when treated with CS extract. CS treatment was noted to normalize the expression of TGF-β1, αSMA, PCNA, MMPs, and TIMP1 proteins. PASS-predicted plant activity could efficiently guide in selecting a promising pharmaceutical lead with high accuracy and required antioxidant and hepatoprotective properties.
Figures

References
-
- Ueki T, Kaneda Y, Tsutsui H, et al. Hepatocyte growth factor gene therapy of liver cirrhosis in rats. Nature Medicine. 1999;5(2):226–230. - PubMed
-
- Munoz Torres E, Paz Bouza JI, Lopez Bravo A, Abad Hernandez MM, Carrascal Marino E. Experimental thioacetamide-induced cirrhosis of the liver. Histology and Histopathology. 1991;6(1):95–100. - PubMed
-
- Cassiman D, Denef C, Desmet VJ, Roskams T. Human and rat hepatic stellate cells express neurotrophins and neurotrophin receptors. Hepatology. 2001;33(1):148–158. - PubMed
-
- Reid R, Muir R, Levison DA, Burt AD. Muir's Textbook of Pathology. Hodder Arnold; 2008.
Publication types
MeSH terms
Substances
LinkOut - more resources
Full Text Sources
Other Literature Sources
Medical
Research Materials
Miscellaneous
