Are the current Indian growth charts really representative? Analysis of anthropometric assessment of school children in a South Indian district
- PMID: 24701431
- PMCID: PMC3968734
- DOI: 10.4103/2230-8210.126541
Are the current Indian growth charts really representative? Analysis of anthropometric assessment of school children in a South Indian district
Abstract
Background: India currently is posed by the double threat of thinness and overweight/obesity among children. Different growth charts have taken different population and give different cut-off points to assess these conditions.
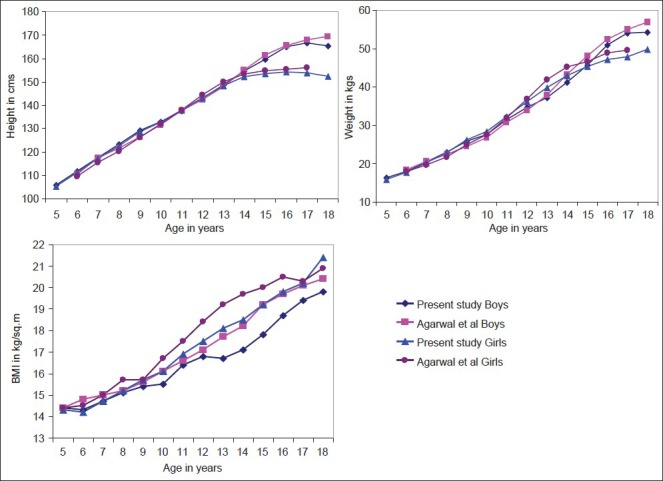
Objective: The objective of this study is to assess the anthropometry of school children, 5-18 years of age and thereby estimate the prevalence of childhood thinness, overweight and obesity. To analyze how the study population compares with that of Agarwal's growth chart.
Materials and methods: The anthropometric measurements of all the students who were studying from 1(st) to 12(th) standards were taken from 27 randomly selected Government and private schools. Prevalence of thinness, overweight and obesity were assessed using two standards - Indian standard given by Agarwal and International Standards given by International Obesity Task Force (IOTF).
Results: The prevalence of thinness, overweight and obesity among 18,001 students enrolled as per Indian standard were 12.2%, 9.5% and 3% and as per International standard were 15.3%, 8.1% and 2.6% respectively. The mean and the 95(th) percentile values of body mass index for both boys and girls at all ages in this study are falling short of Agarwal's and IOTF values. Using international cut-offs as well as Indian cut-offs given by Agarwal, underestimate the prevalence of obesity among boys and girls of all age groups.
Conclusion: This study shows that under and over-nutrition among school children is in almost equal proportions. There is an underestimation of obesity among children whenever an Indian or an International growth chart is used. Thus, this study brings out the need for a really representative growth chart.
Keywords: Growth chart; obesity; prevalence; school children; thinness.
Conflict of interest statement
Figures
References
-
- Gardner G, Halweil B. Chronic hunger and obesity epidemic eroding global progress. [Accessed on 2012 Sep 5]. Available from: http://www.web.archive.org/web/20030316051456/http://www.worldwatch.org/... .
-
- Dietz WH. Health consequences of obesity in youth: Childhood predictors of adult disease. Pediatrics. 1998;101:518–25. - PubMed
-
- Lobstein T, Baur L, Uauy R IASO International Obesity Task Force. Obesity in children and young people: A crisis in public health. Obes Rev. 2004;5(Suppl 1):4–104. - PubMed
-
- Styne DM. Childhood and adolescent obesity. Prevalence and significance. Pediatr Clin North Am. 2001;48:823–54. vii. - PubMed
-
- Copenhagen, Bucharest: World Health Organization; 2005. World Health Organization. Fact sheet EURO/06/05: The health of children and adolescents in Europe.
LinkOut - more resources
Full Text Sources
Other Literature Sources