

Review
doi: 10.1021/cr4007329.
Epub 2014 Apr 4.
Disordered proteinaceous machines
Affiliations
- PMID: 24702702
- PMCID: PMC4350607
- DOI: 10.1021/cr4007329
Item in Clipboard
Review
Disordered proteinaceous machines
Chem Rev.
.
Erratum in
-
Correction to disordered proteinaceous machines.Chem Rev. 2015 Apr 8;115(7):2780. doi: 10.1021/acs.chemrev.5b00150. Epub 2015 Mar 26. Chem Rev. 2015. PMID: 25811425 Free PMC article. No abstract available.
No abstract available
Figures
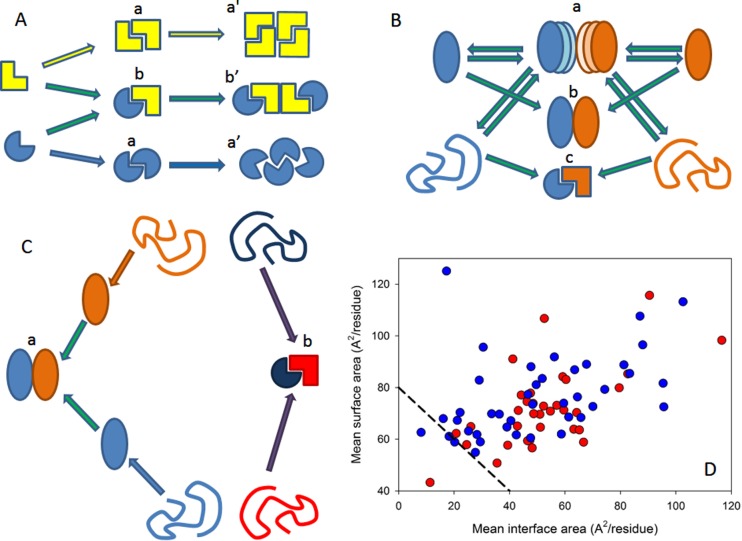
Different classification types of protein–protein complexes.
(A) Composition and geometry-based classifications. Complexes can
be assembled from identical (a) and different subunits (b). Different
types of monomers are shown by different shades of yellow and blue
colors. Interactions leading to homo-oligomers are shown by arrows
of the corresponding color. Interactions leading to the hetero-oligomers
are shown by green arrows. Homodimers associate isologously. Interfaces
of the dimers located at the center of homotetramers are also formed
isologously, whereas all of the interfaces in the hetero-oligomers
and the interfaces formed between the central homodimers and side-added
monomers are formed heterologously. (B) Lifetime-based classification
of oligomers. Complexes can be of transient (a), permanent nonobligate
(b), or permanent obligate (c) nature. Formation of the permanent
obligate complex is accompanied by the global folding of protomers.
Hero-dimers and homologous transitions are shown for simplicity. (C)
Folding-based classification. Protein complexes can be formed in a
three-state mechanism (a), where protein folding and binding happen
as two independent and subsequent steps. Alternatively, some proteins
are formed in a two-state manner (b), where folding and binding occur
simultaneously. (D) The per-residue surface area versus the per-residue
interface area plot to discriminate between the three-state and two-state
complexes. Here, the results of the computational disassembly of the
eukaryotic ribosome (PDB ID: 3U5C and 3U5E) are shown. Surface and interface
area normalized by the number of residues in each chain for the ribosomal
proteins were estimated as described in ref (64). Proteins of the 40S and 60S subunits are shown by red and
blue circles, respectively. A boundary separating ordered and disordered
complexes is shown as a black dashed line.

Two models illustrating binding between
an IDP and an ordered partner
with a “hidden” binding site. (A) A simple model of
interaction with one binding intermediate. (B) A more complex model
with two sequential binding intermediates.
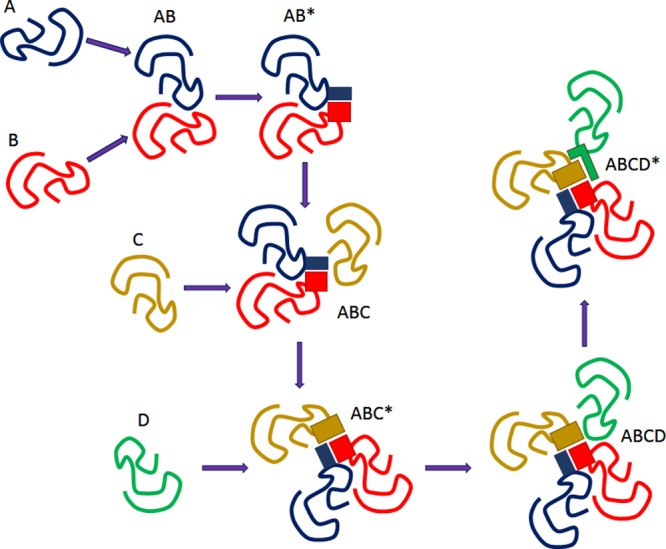
Model of the binding
chain reaction. See explanations in the text.
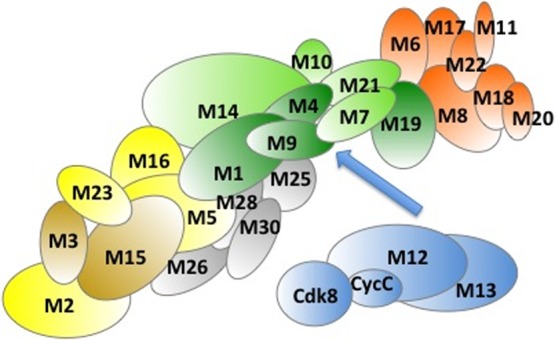
Schematic representation of Mediator subunits: Head (orange),
Middle
(green), Tail (yellow), kinase module (blue). Subunits likely belonging
to the Arm are shown by gray. Darker colors mark subunits, which are
enriched in disordered regions.
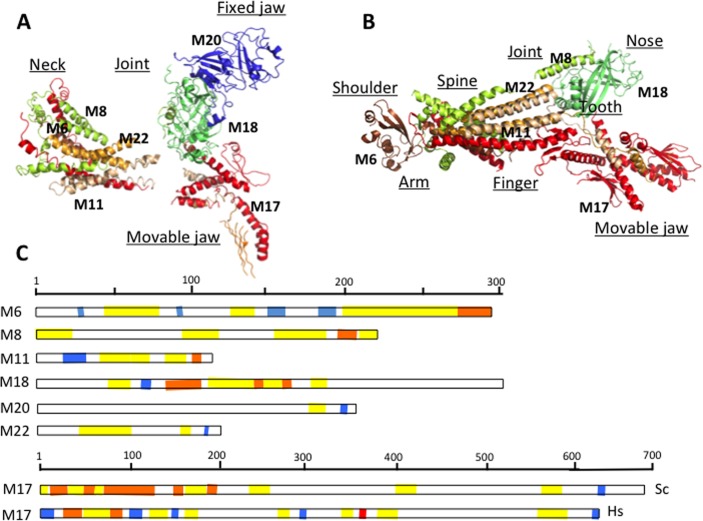
Crystallographic
analysis of Mediator Head module. (A) Crystal
structure of the Head subunits from Saccharomyces cerevisiae by Imasaki et al. at 4.3 Å resolution and (B) crystal structure from Schizosaccharomyces
pombe by Lariviere et al. at 3.9 Å resolution. Med6 (brown), Med17 (red), Med11 (wheat), Med8
(yellow), Med18 (lime), Med20 (blue), Med22 (orange). Gaps in the
structure indicate disordered regions. Names of the different domains
are indicated as underscored. (C) Topological arrangements of disordered
regions in the Head module: fuzzy regions, which are disordered even
in the complex, are yellow; disordered regions, which fold upon interaction,
are orange; and ordered protein interaction sites are blue. The ID
binding site in human Med17, where L371P mutation contributes to infantile
cerebral atrophy, is shown by red.
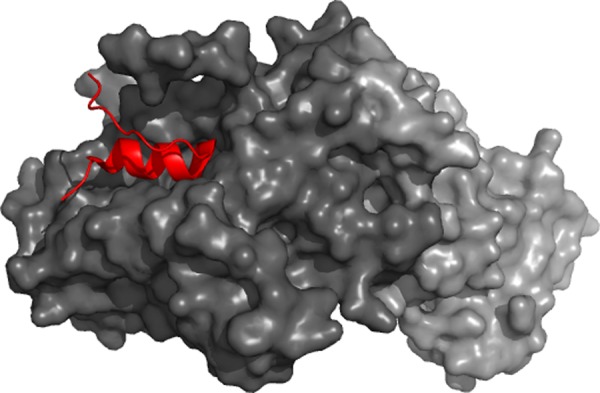
Role of disorder in the
Mediator formation. α-Helical molecular
recognition element (red) mediates binding of Med8 to Med18 (dark
gray)/Med20 (light gray) heterodimer. It is embedded in a larger disordered
region.
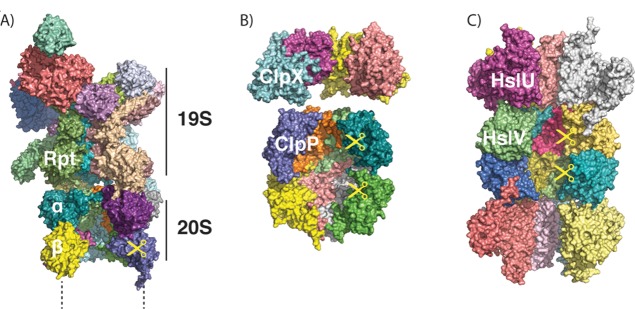
ATP-dependent
proteases share a common architecture. (A) Structure
of the proteasome, as modeled from cryo-electron microscopy (PDB ID 4C0V; ATPγS bound).
Two α, two β, and two Rpt subunits were removed to allow
visualization of the interior. Only one-half (one α, one β
ring) of the 20S core protease particle and one 19S regulatory particle are shown. (B) Structures of ClpX
(PDB ID 3HWS; nucleotide-free) and ClpP (PDB ID 1Y6G), showing the interior of the barrel.
Four out of six subunits of ClpX and four out of seven subunits of
ClpP per ring are shown. (C) Structure of HslUV (PDB ID 1G3I; ATP-bound), showing
the interior of the barrel. Four out of six subunits of HslU and V
per ring are shown.
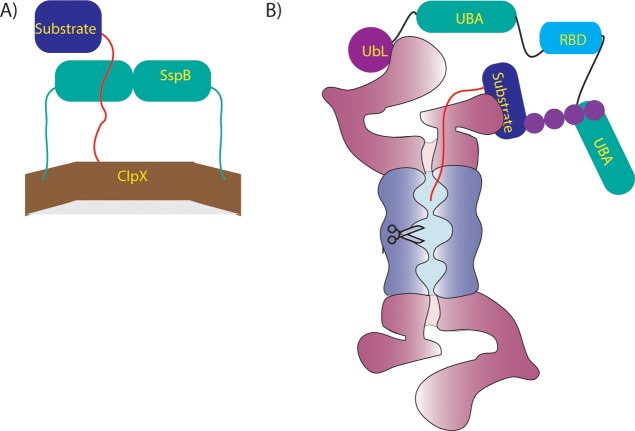
Adaptor proteins mediate degradation of
some substrates. (A) The
adaptor protein SspB (green) binds to ClpX (brown) through long flexible
tails and to a substrate (blue) through the ssrA degradation tag (red),
allowing it to present the substrate to ClpX. (B) The adaptor protein
Rad23 contains a UbL domain (purple) that binds to receptors on the
proteasome such as Rpn13, as well as two UBA domains (green) that
can bind to ubiquitinated substrates (blue) and present them to the
proteasome for degradation. The flexible linkers connecting Rad23
domains may help position substrates of different geometry such that
their unstructured initiation regions (red) can engage with the proteasomal
motors.
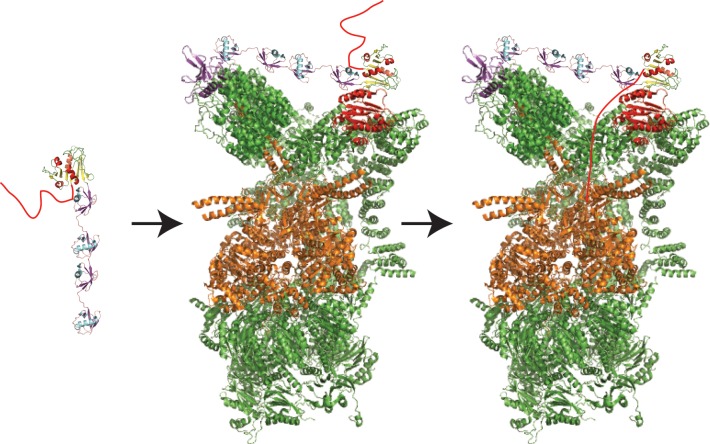
Initiation of degradation by the proteasome
requires a disordered
region. A substrate molecule (dihydrofolate reductase, PDB ID 1DRE; yellow and red
cartoon on the left) with a polyubiquitin chain attached (in this
case, linear tetra-ubiquitin, from PDB ID 2W9N, purple and cyan cartoon on the left)
and a disordered region (red tail) can be degraded by the proteasome.
First the polyubiquitin modification docks at the proteasome (PDB
ID 4C0V), presumably to ubiquitin receptors Rpn10
(red) and Rpn13 (purple), either simultaneously (as shown) or individually.
Next, the tail is engaged by the Rpt ATPase motors (orange) in an
ATP-dependent process, allowing unfolding, translocation, and degradation
(along with deubiquitination of the substrate) to begin.
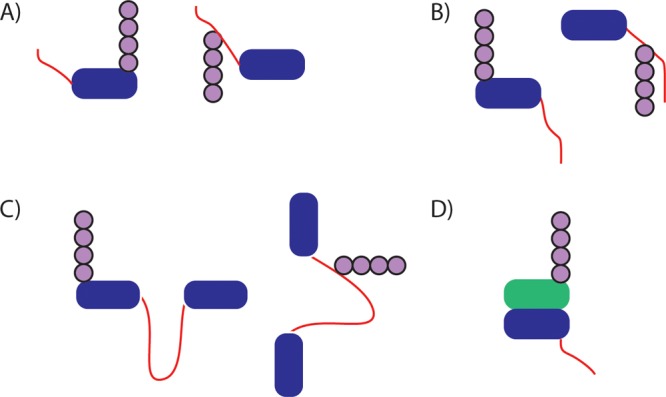
Geometries of disordered initiation sites. A protein (blue)
tagged
with ubiquitin (purple) and containing a disordered initiation site
(red) of sufficient length can be degraded by the proteasome. Initiation
regions can be N-terminal (A), C-terminal (B), internal (C), or even
on a nonubiquitinated protein in complex with a ubiquitinated protein
(D; only blue protein is degraded). The site of ubiquitin modification
may be on or near the disordered region.
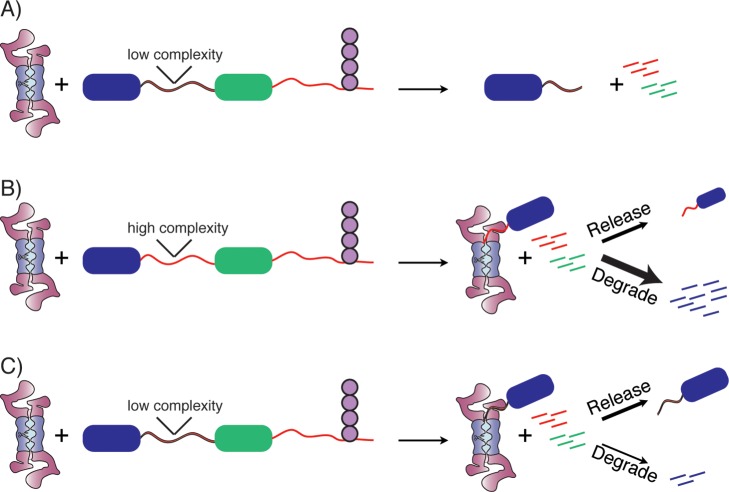
Role of low complexity sequences in promoting
the release of a
fragment from the proteasome. (A) A protein targeted to the proteasome
from the C-terminus will have the C-terminal portion of the protein
degraded (green domain), but the presence of a low complexity region
and an additional tightly folded domain (blue domain) leads to the
release of a fragment consisting of the domain and a tail composed
of part or all of the low complexity region. Only the endpoint of
degradation is shown. (B) With a normal, high complexity sequence
adjacent to the blue domain, a degradation intermediate will form
composed of the blue domain bound to the proteasome. This intermediate
will then partition between release and degradation, with degradation
typically being faster (thicker arrow) leading to overall degradation
of the fragment. (C) With a low complexity sequence adjacent to the
blue domain, unfolding and degradation is slowed with little or no
effect on release, leading to an overall reduction in degradation
and accumulation of stable fragment, the same endpoint as shown in
plot (A).
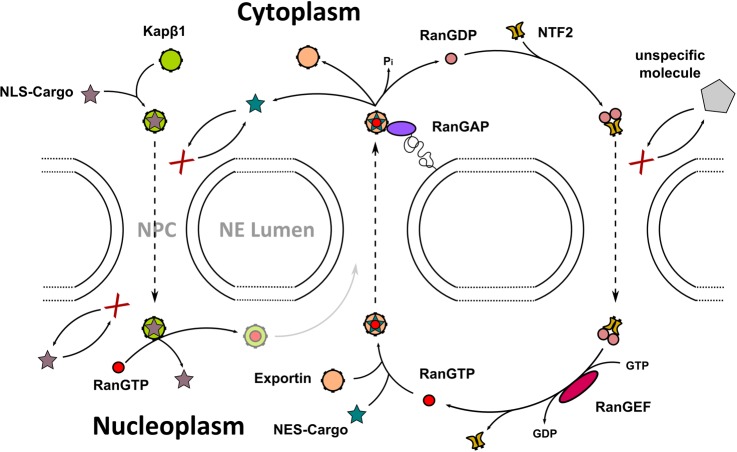
Mechanism of nucleocytoplasmic
transport through NPCs. Importins
(Kapβ1) identify and shuttle NLS-cargo from the cytoplasm into
the nucleus. The Kapβ1–cargo complex is disassembled
in the nucleus by RanGTP, and is thought to return to the cytosol
with Kapβ1. NES-cargo requires both RanGTP and exportin for
export through NPCs. RanGAP triggers the hydrolysis of RanGTP to RanGDP
in the cytosol, which releases Kaps and cargoes. RanGDP is imported
into the nucleus by NTF2, where it is recharged into RanGTP by RanGEF.
In the absence of Kaps, neither specific nor large nonspecific cargoes
can access the NPC.
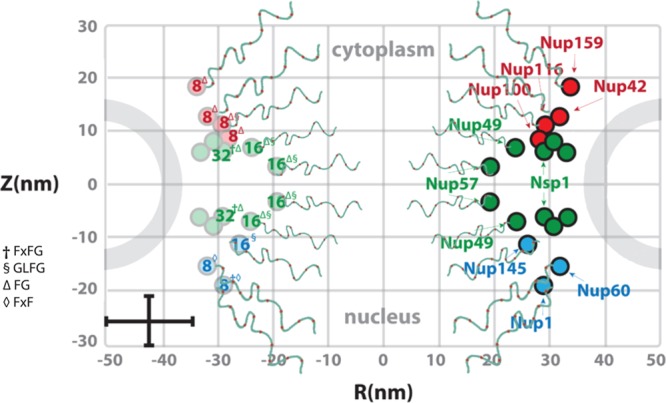
Intrinsically disordered
FG Nups fill the NPC. Estimated abundances
(numbered) and FG Nup positions in S. cerevisiae. Each FG Nup is tethered on one terminal end to the inner walls
of the NPC by an anchor domain from which the remaining FG-rich domain
emanates to occupy the aqueous space within the central channel. Some
FG Nups are symmetric (green), while others are exclusively cytoplasmic
(red) or nuclear (blue). For clarity, each FG Nup varies in length,
sequence, and number/type of FG-repeats (superscript). Error bars
denote uncertainty with respect to their exact anchoring sites.
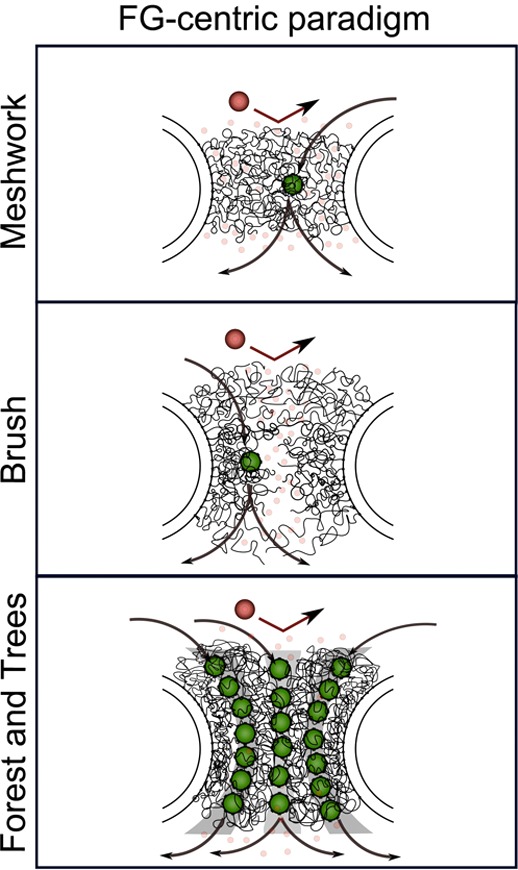
FG-centric NPC models. In this paradigm, the
barrier mechanism
is composed solely of FG Nups. Selective access is exclusive to Kaps
(green) that bind the FG-repeats via multivalent interactions. Large
nonspecific molecules (large red) are withheld due to insufficient
binding with the FG-repeats. Small molecules (small red watermarked)
diffuse freely through the barrier.
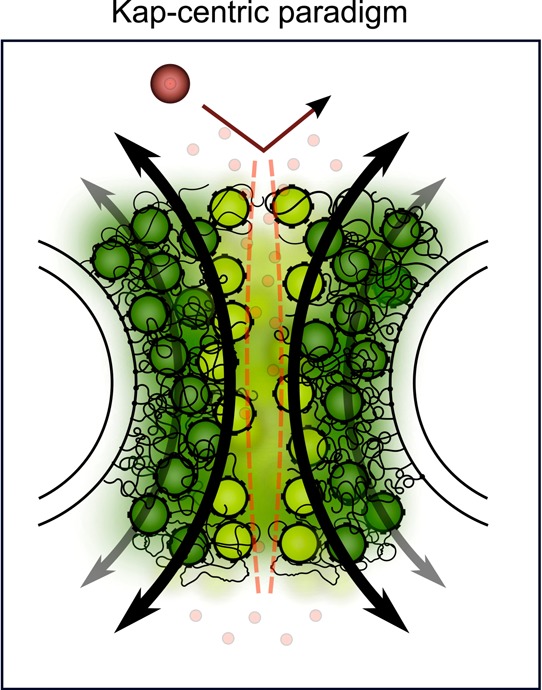
Kap-centric NPC model.
Because of strong binding avidity, large
numbers of Kap molecules are accommodated with the FG Nups. Slow Kaps
that reside within the FG Nups (dark green) form integral barrier
constituents. Weakly bound Kaps (light green) dominate fast transport
due to limited penetration into the preoccupied FG Nups. Large nonspecific
molecules (large red) are excluded from the pore. Small molecules
(small red watermarked) diffuse freely through the barrier.
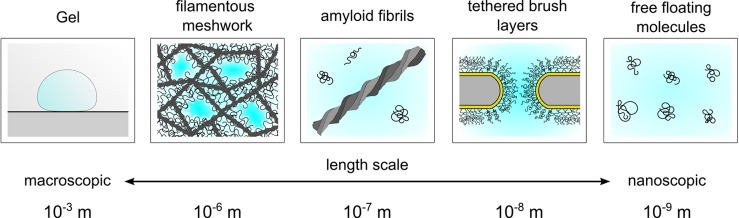
The FG Nups exhibit
a rich material complexity. In vitro FG Nup
behavior is sensitive to experimental design and length scale. Depending
on the context, the FG Nups can exhibit different morphologies and
materials properties, which can assemble into higher order structures.
For instance, macroscopic hydrogels consist of several porous channels
enmeshed within a scaffold provided by amyloid filaments. Each porous
channel may be lined with FG Nups that bestows the hydrogel NPC-like
functionality, as is the case for FG Nups tethered to artificial nanopores.
See text for details.
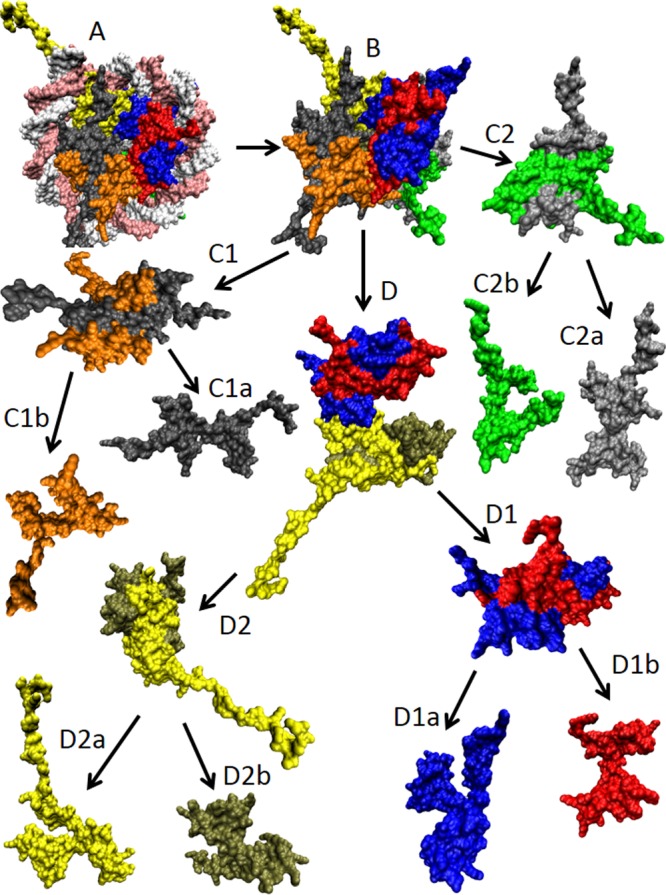
Structural dissection
of the X. laevis nucleosome core particle
(PDB ID: 1AOI). (A) Complete nucleosome core particle
wrapped in DNA (double white-pink ribbon). (B) The nucleosome core
particle after the DNA removal. (C1 and C2) H2A–H2B dimers.
(C1a) and (C1b) represent histones H2A (gray) and H2B (orange) of
the first H2A–H2B dimer, whereas (C2a) and (C2b) show histones
H2A (silver) and H2B (green) of the second H2A–H2B dimer. (D)
(H3–H4)2 tetramer. (D1 and D2) H3–H4 dimers.
(D1a) and (D1b) represent histones H3 (blue) and H4 (red) of the first
H3–H4 dimer, whereas (D2a) and (D2b) show histones H3 (yellow)
and H4 (tan) of the second H3–H4 dimer. All of these structures
were visualized using the VMD software.
References
-
- Wright P. E.; Dyson H. J. J. Mol. Biol. 1999, 293, 321. - PubMed
-
- Uversky V. N.; Gillespie J. R.; Fink A. L. Proteins 2000, 41, 415. - PubMed
-
- Dunker A. K.; Lawson J. D.; Brown C. J.; Williams R. M.; Romero P.; Oh J. S.; Oldfield C. J.; Campen A. M.; Ratliff C. M.; Hipps K. W.; Ausio J.; Nissen M. S.; Reeves R.; Kang C.; Kissinger C. R.; Bailey R. W.; Griswold M. D.; Chiu W.; Garner E. C.; Obradovic Z. J. Mol. Graphics Modell. 2001, 19, 26. - PubMed
-
- Dunker A. K.; Obradovic Z. Nat. Biotechnol. 2001, 19, 805. - PubMed
-
- Dyson H. J.; Wright P. E. Curr. Opin. Struct. Biol. 2002, 12, 54. - PubMed
Publication types
MeSH terms
Substances
Grants and funding
LinkOut - more resources
Full Text Sources
Other Literature Sources
