Comparative Study
. 2014 Sep;272(3):683-9.
doi: 10.1148/radiol.14140296. Epub 2014 Apr 4.

Accuracy, precision, and reproducibility of four T1 mapping sequences: a head-to-head comparison of MOLLI, ShMOLLI, SASHA, and SAPPHIRE

Affiliations
Comparative Study

Accuracy, precision, and reproducibility of four T1 mapping sequences: a head-to-head comparison of MOLLI, ShMOLLI, SASHA, and SAPPHIRE

Sébastien Roujol et al. Radiology. 2014 Sep.

Abstract

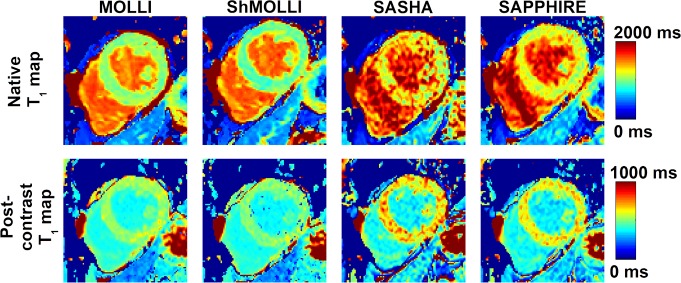
Purpose: To compare accuracy, precision, and reproducibility of four commonly used myocardial T1 mapping sequences: modified Look-Locker inversion recovery (MOLLI), shortened MOLLI (ShMOLLI), saturation recovery single-shot acquisition (SASHA), and saturation pulse prepared heart rate independent inversion recovery (SAPPHIRE).

Materials and methods: This HIPAA-compliant study was approved by the institutional review board. All subjects provided written informed consent. Accuracy, precision, and reproducibility of the four T1 mapping sequences were first compared in phantom experiments. In vivo analysis was performed in seven healthy subjects (mean age ± standard deviation, 38 years ± 19; four men, three women) who were imaged twice on two separate days. In vivo reproducibility of native T1 mapping and extracellular volume (ECV) were measured. Differences between the sequences were assessed by using Kruskal-Wallis and Wilcoxon rank sum tests (phantom data) and mixed-effect models (in vivo data).

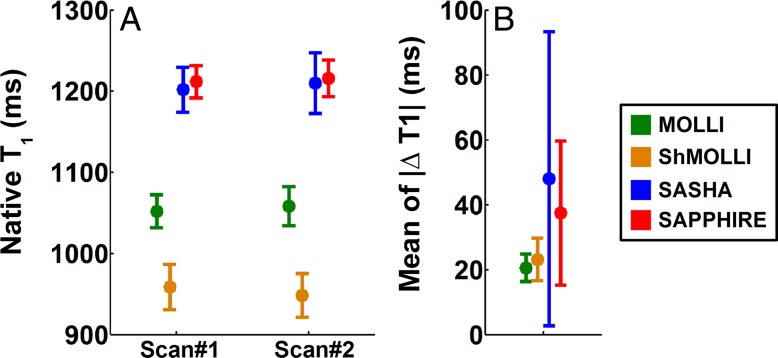
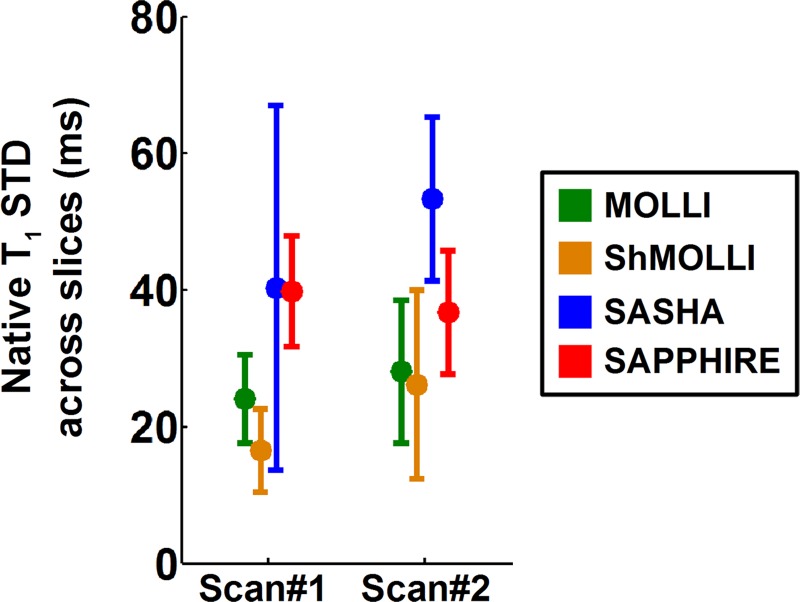
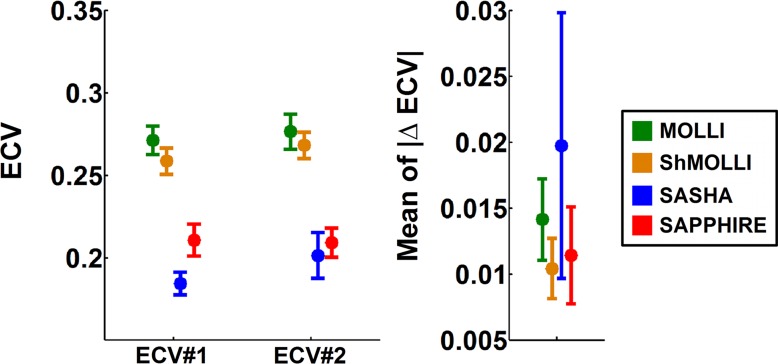
Results: T1 mapping accuracy in phantoms was lower with ShMOLLI (62 msec) and MOLLI (44 msec) than with SASHA (13 msec; P < .05) and SAPPHIRE (12 msec; P < .05). MOLLI had similar precision to ShMOLLI (4.0 msec vs 5.6 msec; P = .07) but higher precision than SAPPHIRE (6.8 msec; P = .002) and SASHA (8.7 msec; P < .001). All sequences had similar reproducibility in phantoms (P = .1). The four sequences had similar in vivo reproducibility for native T1 mapping (∼25-50 msec; P > .05) and ECV quantification (∼0.01-0.02; P > .05).

Conclusion: SASHA and SAPPHIRE yield higher accuracy, lower precision, and similar reproducibility compared with MOLLI and ShMOLLI for T1 measurement. Different sequences yield different ECV values; however, all sequences have similar reproducibility for ECV quantification.


Figures

Figure 1:
Figure 1:
Images show example T1 maps acquired with all four T1 mapping sequences (top row) before and (bottom row) after administration of contrast material in a 53-year-old man. Myocardial T1 values over the left ventricle obtained with MOLLI (native, 1012 msec ± 60; postcontrast administration, 527 msec ± 30) and ShMOLLI (native, 924 msec ± 70; postcontrast administration, 501 msec ± 33) were lower than those obtained with SASHA (native, 1254 msec ± 191; postcontrast administration, 659 msec ± 81) and SAPPHIRE (native, 1160 msec ± 95; postcontrast administration, 625 msec ± 55). MOLLI and ShMOLLI provided improved precontrast and postcontrast map quality with less variability.
Figure 2:
Figure 2:
Box and whisker plots show, A, native myocardial T1 measurements and, B, reproducibility within the same MR examination in healthy subjects by using MOLLI, ShMOLLI, SASHA, and SAPPHIRE. There were no statistically significant differences in native T1 times obtained with SASHA (examination [scan] 1, 1202 msec ± 56; examination 2, 1210 msec ± 76) and SAPPHIRE (examination 1, 1212 msec ± 40; examination 2, 1216 msec ± 46) (P = .83). Remaining paired sequence comparisons were statistically significant (P < .001). Lower native T1 times were obtained with ShMOLLI (examination 1, ∼959 msec ± 56; examination 2, 948 msec ± 54) and MOLLI (examination 1, ∼1052 msec ± 41; examination 2, 1058 msec ± 48) compared with SASHA (P < .001) and SAPPHIRE (P < .001). There were statistically significant differences among the four sequences in term of reproducibility (P = .03). MOLLI and ShMOLLI had similar reproducibility (21 msec ± 9 vs 23 msec ± 13, respectively; P = .91). SAPPHIRE and SASHA had similar reproducibility (37 msec ± 44 vs 48 msec ± 91; P = .39). MOLLI and ShMOLLI trended toward being more reproducible than SAPPHIRE (P = .06 and P = .07, respectively) or SASHA (P = .01 and P = .02, respectively). △T1 = change in T1.
Figure 3:
Figure 3:
Box and whisker plot shows native myocardial T1 variation across sections (slices) calculated from four T1 mapping sequences in healthy subjects. Shown are standard deviations over sections of the T1 mean of a region of interest over the septum. Over the two precontrast examinations of day 1, the T1 variation across sections was lower with MOLLI (examination [scan] 1, 24 msec ± 13; examination 2, 28 msec ± 21) and ShMOLLI (examination 1, 17 msec ± 12; examination 2, 26 msec ± 28) than SAPPHIRE (examination 1, 40 msec ± 16; examination 2, 37 msec ± 18) and SASHA (examination 1, 40 msec ± 53; examination 2, 53 msec ± 24). Mixed-effect model did not reveal any statistically significant section effect (P = .16).
Figure 4:
Figure 4:
Box and whisker plots show, A, native myocardial T1 measurements and, B, reproducibility between two separate MR examinations in healthy subjects by using the four sequences of MOLLI, ShMOLLI, SASHA, and SAPPHIRE. Shown are the second native T1-weighted examination on day 1 (examination [scan] 2) versus native T1-weighted examination on day 2 (examination 3). Reproducibility is reported as the absolute difference between the two precontrast myocardial T1-weighted examinations. MOLLI and ShMOLLI provided similar reproducibility with an average absolute T1 variation of 34 msec ± 13 and 36 msec ± 15, respectively. Although SASHA and SAPPHIRE provided slightly lower reproducibility (51 msec ± 19 and 44 msec ± 23, respectively), there were no statistical differences among the sequences (P = .11). △T1 = change in T1.
Figure 5:
Figure 5:
Box and whisker plots show, A, ECV measurements and, B, ECV reproducibility in healthy subjects by using the four T1 mapping sequences. ECV reproducibility was measured as the absolute difference between two ECVs, which were calculated from the second precontrast examination and the first postcontrast examination (ECV #1) and the second precontrast examination and the second postcontrast examination (ECV #2). Variations were observed in ECV measurements among the four T1 mapping sequences (P < .001). Similar ECV measurements were obtained with MOLLI and ShMOLLI (∼0.27 vs ∼0.26; P = .13). Lower ECV values were obtained with SAPPHIRE (∼0.20) and SASHA (∼0.18) compared with MOLLI or ShMOLLI (P < .001). The difference between SAPPHIRE and SASHA was statistically significant (P = .002). Reproducibility of ECV measurements ranged from 0.01 to 0.02 for all sequences. There was no statistically significant difference for ECV reproducibility among the four sequences (P = .11).

References

    1. Messroghli DR, Radjenovic A, Kozerke S, Higgins DM, Sivananthan MU, Ridgway JP. Modified Look-Locker inversion recovery (MOLLI) for high-resolution T1 mapping of the heart. Magn Reson Med 2004;52(1):141–146. - PubMed
    1. Messroghli DR, Niendorf T, Schulz-Menger J, Dietz R, Friedrich MG. T1 mapping in patients with acute myocardial infarction. J Cardiovasc Magn Reson 2003;5(2):353–359. - PubMed
    1. Moon JC, Messroghli DR, Kellman P, et al. . Myocardial T1 mapping and extracellular volume quantification: a Society for Cardiovascular Magnetic Resonance (SCMR) and CMR Working Group of the European Society of Cardiology consensus statement. J Cardiovasc Magn Reson 2013;15(1):92. - PMC - PubMed
    1. Arheden H, Saeed M, Higgins CB, et al. . Measurement of the distribution volume of gadopentetate dimeglumine at echo-planar MR imaging to quantify myocardial infarction: comparison with 99mTc-DTPA autoradiography in rats. Radiology 1999;211(3):698–708. - PubMed
    1. Wong TC, Piehler K, Meier CG, et al. . Association between extracellular matrix expansion quantified by cardiovascular magnetic resonance and short-term mortality. Circulation 2012;126(10):1206–1216. - PMC - PubMed