. 2014 Apr 3;14(4):486-499.
doi: 10.1016/j.stem.2014.01.020.

Clonal tracking of rhesus macaque hematopoiesis highlights a distinct lineage origin for natural killer cells

Affiliations

Clonal tracking of rhesus macaque hematopoiesis highlights a distinct lineage origin for natural killer cells

Chuanfeng Wu et al. Cell Stem Cell. .

Abstract

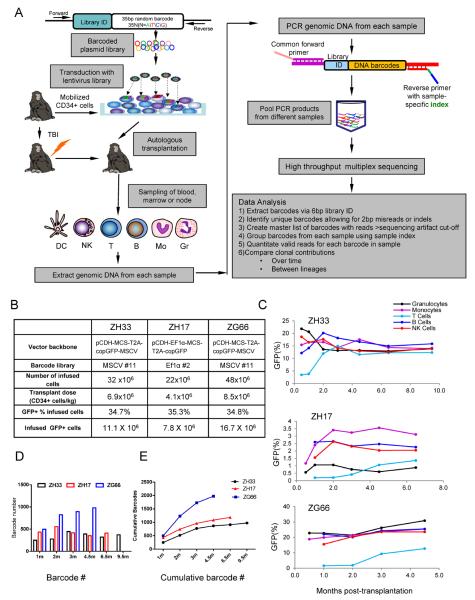
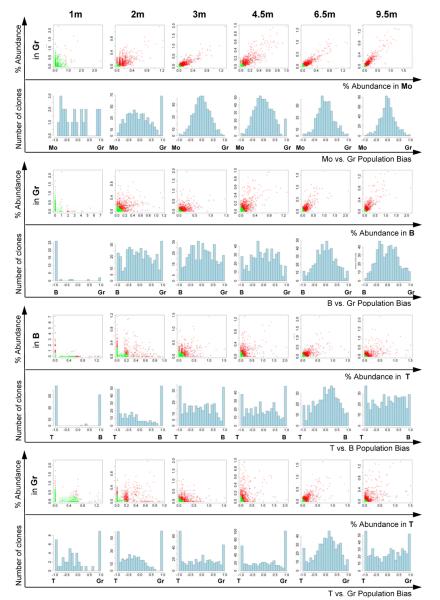
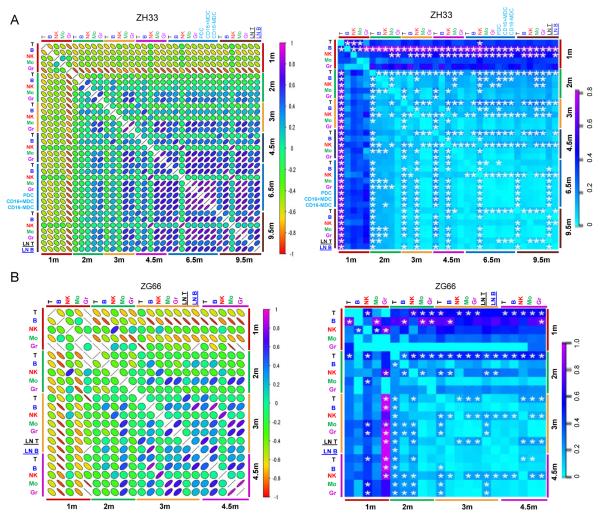
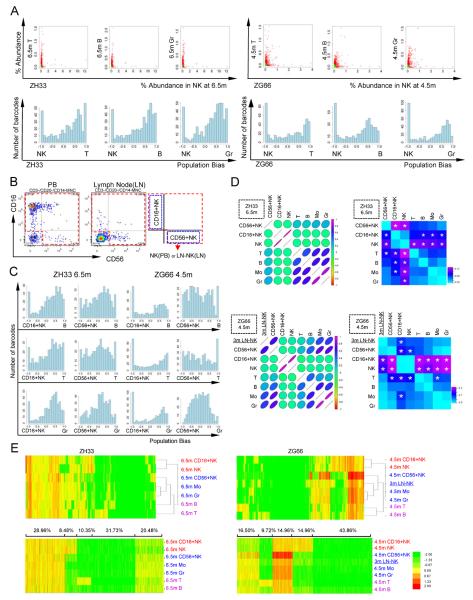
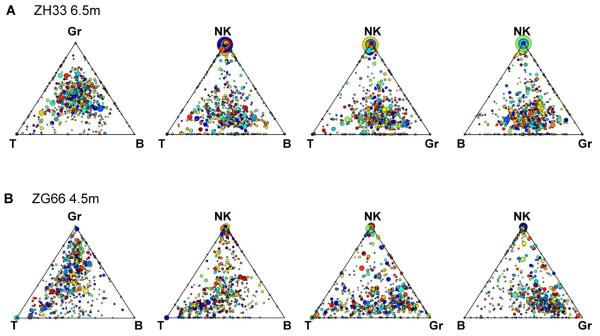
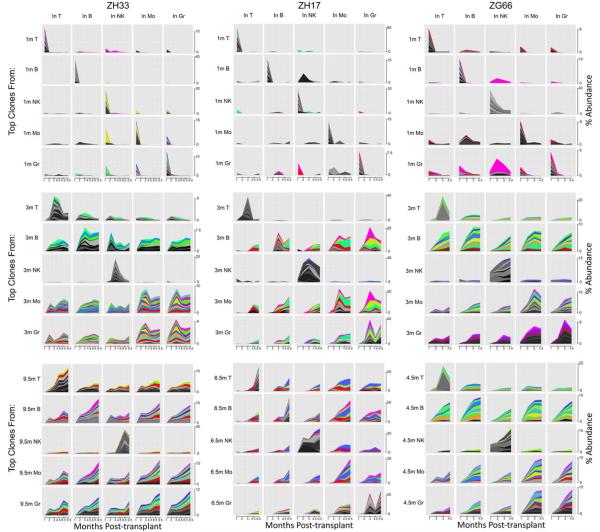
Analysis of hematopoietic stem cell function in nonhuman primates provides insights that are relevant for human biology and therapeutic strategies. In this study, we applied quantitative genetic barcoding to track the clonal output of transplanted autologous rhesus macaque hematopoietic stem and progenitor cells over a time period of up to 9.5 months. We found that unilineage short-term progenitors reconstituted myeloid and lymphoid lineages at 1 month but were supplanted over time by multilineage clones, initially myeloid restricted, then myeloid-B clones, and then stable myeloid-B-T multilineage, long-term repopulating clones. Surprisingly, reconstitution of the natural killer (NK) cell lineage, and particularly the major CD16(+)/CD56(-) peripheral blood NK compartment, showed limited clonal overlap with T, B, or myeloid lineages, and therefore appears to be ontologically distinct. Thus, in addition to providing insights into clonal behavior over time, our analysis suggests an unexpected paradigm for the relationship between NK cells and other hematopoietic lineages in primates.


Figures

Figure 1
Figure 1. Experimental design and clonal diversity
(A) Oligonucleotides consisting of a library ID followed by a random barcode were cloned into a lentiviral vector flanked by PCR primer sites. Mobilized PB autologous CD34+ cells were transduced and infused back into the irradiated autologous macaque, and PB, BM and lymph node samples were collected, purified by FACS, and barcode retrieval was performed via PCR and high throughput sequencing. Information relevant to methodologies presented in in Fig S1–S4 and Tables S1–S3. (B) Transduction and transplantation parameters for rhesus macaques ZH33, ZH17 and ZG66. (C) Percentage of GFP+ cells in PB lineages over time following transplantation. (D) Number of independent barcoded clones detected in the PB (combined B, T, Gr, Mono, NK) at each time point (m=months). (E) Cumulative number of independent barcoded clones detected in PB (combined B, T, Gr, Mono, NK) over time.
Figure 2
Figure 2. Barcode copy number per HSPC clone
(A) Barcode copy number in individual CFU obtained at the end of transduction (left, n=48) or from marrow CFU post-transplant from ZH33 (right, n=14). (B) Barcode copy number per transduced cell for PB samples. The molecular marking level (vector copy number) was determined by qPCR on sorted GFP negative granulocytes (GFP Gr), GFP positive granulocytes (GFP+ Gr) and sorted T, B, and NK cells from ZH33, ZH17, and ZG66, and plotted on the left panel (white bars) next to the fraction of GFP+ cells in the same sample as assessed by FACS (green bars). A ratio of 1 implies one vector copy per each GFP+ cell. On the right, the ratio of molecular marking level determined by copy number PCR/GFP marking level for all samples from each of the three animals (mean±SEM) are shown.
Figure 3
Figure 3. Clonal comparisons between lineages
Scatter plots compare sequencing read fractions in ZH33 between pairs of lineages over time. Each dot represents an individual barcode/clone from the master list, detected in either lineage. Green dots are barcodes with reads falling below the sampling threshold of 1144 reads combined between the two lineages, red dots are barcodes with reads above the threshold. The bias histograms are generated from the scatter plots for barcodes falling above the threshold by measuring the angle from the axis for each barcode, and renormalizing from -1 to 1 before placing each barcode into a bias bin. The number of clones in each bias bin is on the y and the degree of bias on the x axes, with clones having equal lineage contributions defined as 0. Each clone is counted equally for the bias histograms, without regard to its overall level of contribution. Analogous data from animal ZG66 shown in Fig S5.
Figure 4
Figure 4. Summary of clonal lineage and kinetic relationships over time
(A) Pearson correlation coefficients comparing barcode contributions for all barcodes falling above the sampling threshold of 1144 for pairwise comparisons, between all lineages and time points, for animal ZH33 and ZG66 (r values and their associated p values and 95% confidence intervals are given in Table S5). The color scale bar for r values is on the right. Slope indicates negative or positive correlation; the shape and the color signify the strength of the correlation. MDC-myeloid dendritic cells, PDC-plasmacytoid dendritic cells, LN-lymph node. Alternative analysis utilizing Spearman correlation shown in Fig S6 and Table S6 (B) Fraction of highly biased (>10 fold greater fractional representation in one sample versus the other) barcodes between all lineages and time points for ZH33 and ZG66. Bias is towards the sample shown in the row, and away from the sample in the column. Color scale is given on the right. P values <0.05 are starred; the frequency of highly biased clones in these comparisons differed significantly from the total frequency of highly biased clones at the time point combination. Hierarchical clustering analysis for fractional barcode contributions in ZH33 and ZG66 given in Fig S7.
Figure 5
Figure 5. Clonal contributions to NK cells
(A) Scatter and bias plots for NK versus T, B, and Gr from ZH33(6.5m) and ZG66(4.5m). (B) Example of FACS gating for sorting of NK subsets in blood (ZH33, 6.5m) and node (ZG66, 3m). (C) Bias plots comparing CD16+ and CD56+ NK with B, T, and Gr from ZH33 at 6.5m (left) and ZG66 at 4.5m (right). (D) Graphical summary of Pearson correlation coefficients (left) (Table S7 gives r values, p values and 95% confidence intervals) and fraction of highly biased (>10 fold difference in fractional representation) clones (right) (p values <0.05 are starred), comparing NK cells and subsets from the peripheral blood (ZH33 6.5m, upper panel) and from ZG66 blood (4.5m) and node (3m) (lower panel). Alternative analysis utilizing Spearman correlation shown in Fig S6 and Table S7 (E) Euclidian distance hierarchical clustering (upper panel) and K-mean clustering with k=5 (lower panel), ZH33 (6.5m) and ZG66 (4.5m blood, 3m node). For each animal, all barcodes on the master clone list are included. For K-mean clustering, the % of clones in each cluster is shown above the plots. NK:NK cells in PB; LN-NK: lymph node NK; CD16+NK: CD16+CD56−; 56+NK: CD16−CD56+
Figure 6
Figure 6. Triangle plots of clonal contributions to T, B, NK and Gr lineages
Triangle plot of clonal contributions to B, T, NK and Gr in ZH33 at 6.5m (A), or in ZG66 at 4.5m (B). Each dot represents an individual barcoded clone, with the size of the dots corresponding to the total fractional contribution of the individual barcode to the total barcodes retrieved at the time point. The color of the dot is assigned randomly to help distinguish adjacent dots. The location of the barcode represents the ratio of barcode reads in each of the three cell lineages. The presence of large, dots clustering at the vertex of plots including NK cells suggests a unique population of highly biased NK clones in both animals, in contrast to clusters of dots in the center of B/T/Gr triangles, suggesting common clones contributing in a balanced manner to these lineages, particularly by 6.5m in ZH33.
Figure 7
Figure 7. Tracking of individual high-contributing clones
The fractional contribution of each barcode to the total barcodes retrieved from each lineage at each time point were ranked, and the top ten contributing barcodes in each lineage at 1m, 3m and 9.5m from ZH33 (left column) 1m, 3m and 6.5m from ZH17 (middle column) and 1m, 3m and 4.5m from ZG66 (right column) are tracked for their contributions in all lineages over time. Each graph shows the time post-transplant on the x axis and the percentage of total reads each clone contributes to the lineage as a stacked graph on the y axis. Each y axis scale is linear and identical across each row of graphs, with the scale on the far right of each row, but note that scale is adjusted between rows, in particular when one very dominant clone is being depicted. Clones shown in grey scale are top 10 in only one lineage. Clones shown in color are top 10 in more than one lineage, and each clone has a unique color, allowing comparisons between plots for each animal.

Comment in

References

    1. Abkowitz JL, Catlin SN, Guttorp P. Evidence that hematopoiesis may be a stochastic process in vivo. Nat Med. 1996;2:190–197. - PubMed
    1. Abkowitz JL, Catlin SN, McCallie MT, Guttorp P. Evidence that the number of hematopoietic stem cells per animal is conserved in mammals. Blood. 2002;100:2665–2667. - PubMed
    1. An DS, Donahue RE, Kamata M, Poon B, Metzger M, Mao SH, Bonifacino A, Krouse AE, Darlix JL, Baltimore D, et al. Stable reduction of CCR5 by RNAi through hematopoietic stem cell transplant in non-human primates. Proc Natl Acad Sci USA. 2007;104:13110–13115. - PMC - PubMed
    1. Andrews RG, Peterson LJ, Morris J, Potter J, Heyward S, Gough M, Bryant E, Kiem HP. Differential engraftment of genetically modified CD34(+) and CD34(−) hematopoietic cell subsets in lethally irradiated baboons. Exp Hematol. 2000;28:508–518. - PubMed
    1. Baum CM, Weissman IL, Tsukamoto AS, Buckle AM, Peault B. Isolation of a candidate human hematopoietic stem-cell population. Proc Natl Acad Sci U S A. 1992;89:2804–2808. - PMC - PubMed

Publication types