

Interactions and tradeoffs between cell recruitment, proliferation, and differentiation affect CNS regeneration
- PMID: 24703314
- PMCID: PMC3976526
- DOI: 10.1016/j.bpj.2014.02.010
Interactions and tradeoffs between cell recruitment, proliferation, and differentiation affect CNS regeneration
Abstract
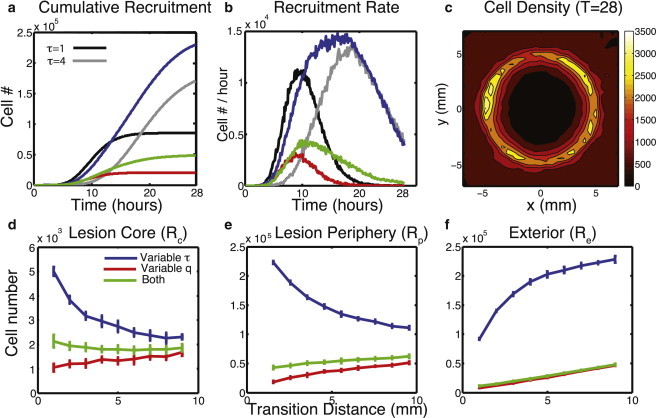
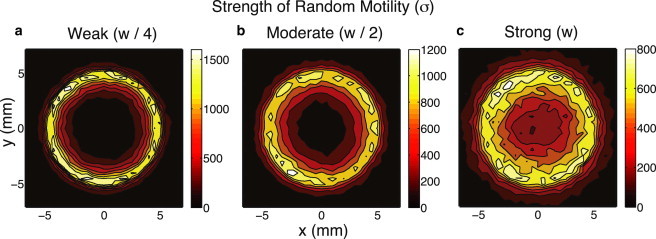
Regeneration of central nervous system (CNS) lesions requires movement of progenitor cells and production of their differentiated progeny. Although damage to the CNS clearly promotes these two processes, the interplay between these complex events and how it affects a response remains elusive. Here, we use spatial stochastic modeling to show that tradeoffs arise between production and recruitment during regeneration. Proper spatial control of cell cycle timing can mitigate these tradeoffs, maximizing recruitment, improving infiltration into the lesion, and reducing wasteful production outside of it. Feedback regulation of cell lineage dynamics alone however leads to spatial defects in cell recruitment, suggesting a novel, to our knowledge, hypothesis for the aggregation of cells to the periphery of a lesion in multiple sclerosis. Interestingly, stronger chemotaxis does not correct this aggregation and instead, substantial random cell motions near the site of the lesion are required to improve CNS regeneration.
Copyright © 2014 Biophysical Society. Published by Elsevier Inc. All rights reserved.
Figures


Similar articles
-
The role of oligodendrocytes and oligodendrocyte progenitors in CNS remyelination.Adv Exp Med Biol. 1999;468:183-97. doi: 10.1007/978-1-4615-4685-6_15. Adv Exp Med Biol. 1999. PMID: 10635029 Review.
-
Adult neurogenesis and neuronal regeneration in the central nervous system of teleost fish.Eur J Neurosci. 2011 Sep;34(6):917-29. doi: 10.1111/j.1460-9568.2011.07854.x. Eur J Neurosci. 2011. PMID: 21929625 Review.
-
Sox2 Is Essential for Oligodendroglial Proliferation and Differentiation during Postnatal Brain Myelination and CNS Remyelination.J Neurosci. 2018 Feb 14;38(7):1802-1820. doi: 10.1523/JNEUROSCI.1291-17.2018. Epub 2018 Jan 15. J Neurosci. 2018. PMID: 29335358 Free PMC article.
-
Why does remyelination fail in multiple sclerosis?Nat Rev Neurosci. 2002 Sep;3(9):705-14. doi: 10.1038/nrn917. Nat Rev Neurosci. 2002. PMID: 12209119 Review.
-
Glial influences on neural stem cell development: cellular niches for adult neurogenesis.Curr Opin Neurobiol. 2005 Oct;15(5):514-20. doi: 10.1016/j.conb.2005.08.003. Curr Opin Neurobiol. 2005. PMID: 16144763 Review.
Cited by
-
A mathematical model of mechanotransduction reveals how mechanical memory regulates mesenchymal stem cell fate decisions.BMC Syst Biol. 2017 May 16;11(1):55. doi: 10.1186/s12918-017-0429-x. BMC Syst Biol. 2017. PMID: 28511648 Free PMC article.
-
The Interplay between Wnt Mediated Expansion and Negative Regulation of Growth Promotes Robust Intestinal Crypt Structure and Homeostasis.PLoS Comput Biol. 2015 Aug 19;11(8):e1004285. doi: 10.1371/journal.pcbi.1004285. eCollection 2015 Aug. PLoS Comput Biol. 2015. PMID: 26288152 Free PMC article.
-
Cell Sorting and Noise-Induced Cell Plasticity Coordinate to Sharpen Boundaries between Gene Expression Domains.PLoS Comput Biol. 2017 Jan 30;13(1):e1005307. doi: 10.1371/journal.pcbi.1005307. eCollection 2017 Jan. PLoS Comput Biol. 2017. PMID: 28135279 Free PMC article.
References
-
- Jurewicz A., Matysiak M., Selmaj K. Tumour necrosis factor-induced death of adult human oligodendrocytes is mediated by apoptosis inducing factor. Brain. 2005;128:2675–2688. - PubMed
-
- Juurlink B.H. Response of glial cells to ischemia: roles of reactive oxygen species and glutathione. Neurosci. Biobehav. Rev. 1997;21:151–166. - PubMed
-
- Wilkins A., Chandran S., Compston A. A role for oligodendrocyte-derived IGF-1 in trophic support of cortical neurons. Glia. 2001;36:48–57. - PubMed
Publication types
MeSH terms
Grants and funding
LinkOut - more resources
Full Text Sources
Other Literature Sources
Molecular Biology Databases
