. 2014 Apr 14;29(1):20-33.
doi: 10.1016/j.devcel.2014.02.008. Epub 2014 Apr 3.

PTK7-Src signaling at epithelial cell contacts mediates spatial organization of actomyosin and planar cell polarity

Affiliations

PTK7-Src signaling at epithelial cell contacts mediates spatial organization of actomyosin and planar cell polarity

Anna Andreeva et al. Dev Cell. .

Abstract

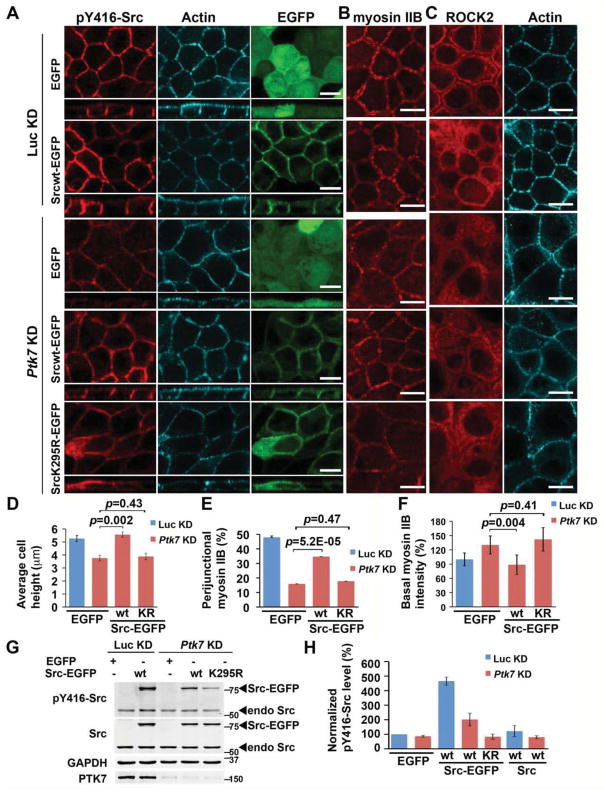
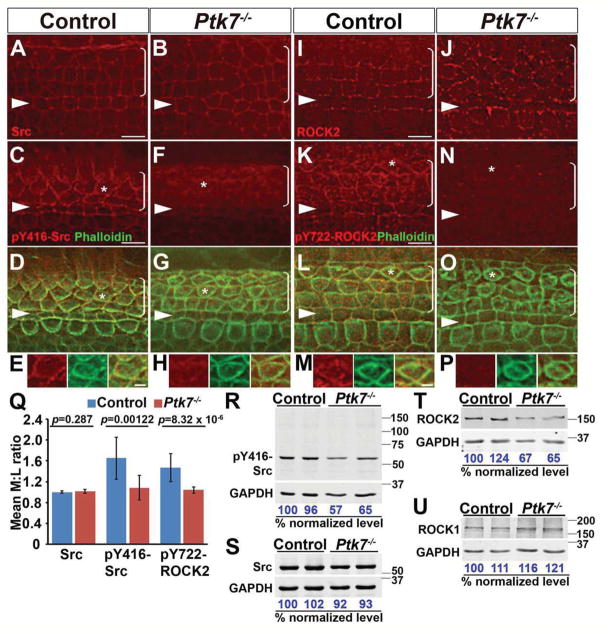
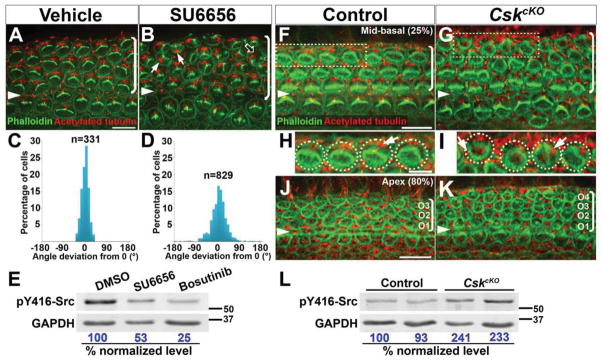
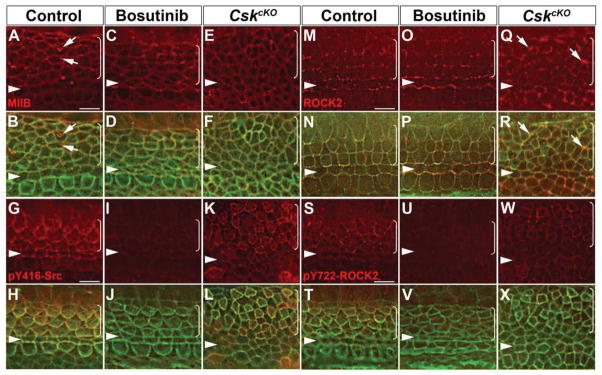
Actomyosin contractility plays a key role in tissue morphogenesis. During mammalian development, PTK7 regulates epithelial morphogenesis and planar cell polarity (PCP) through modulation of actomyosin contractility, but the underlying mechanism is unknown. Here, we show that PTK7 interacts with the tyrosine kinase Src and stimulates Src signaling along cell-cell contacts. We further identify ROCK2 as a target of junctional PTK7-Src signaling. PTK7 knockdown in cultured epithelial cells reduced the level of active Src at cell-cell contacts, resulting in delocalization of ROCK2 from cell-cell contacts and decreased junctional contractility, with a concomitant increase in actomyosin on the basal surface. Moreover, we present in vivo evidence that Src family kinase (SFK) activity is critical for PCP regulation in the auditory sensory epithelium and that PTK7-SFK signaling regulates tyrosine phosphorylation of junctional ROCK2. Together, these results delineate a PTK7-Src signaling module for spatial regulation of ROCK activity, actomyosin contractility, and epithelial PCP.


Conflict of interest statement

The authors declare no competing financial interests.

Figures

Figure 1
Figure 1. Ptk7 knockdown in MDCK cells causes defects in cell shape and actomyosin organization
(A) Confocal images of luciferase knockdown control (Luc KD) or Ptk7 KD cells immunostained for PTK7 and E-cadherin. Z-profile views show reduced height of Ptk7 KD cells. (B) Confocal images of myosin IIB and F-actin staining show actomyosin organization defects along both the lateral and basal membrane domains in Ptk7 KD cells. (C–E) Quantification of cell heights (C), myosin IIB localization along cell-cell contacts (D) and on the basal surface (E) in Luc KD and Ptk7 KD cell monolayers. Data are represented as mean +/− SEM. (D) Perijunctional vs. collapsed junctional staining of myosin IIB is defined using line scan analysis. If a line scan of stanining intensity shows two peaks flanking the cell junctions, it is scored “perijunctional”, while a single peak centered on cell junctions is scored “collapsed” (see Fig. S1E). (F) Immunoblotting of Luc KD and Ptk7 KD cell lysates with the indicated antibodies. Total levels of E-cadherin, myosin IIB and IIA are unchanged, while pRLC levels are increased in Ptk7 KD cells. GAPDH served as loading control. Scale bars, 10 μm. (See also Figure S1).
Figure 2
Figure 2. PTK7 regulates ROCK2 localization and junctional contractility in MDCK cells
(A) Confocal images of ROCK2 and F-actin staining. Perijunctional staining of ROCK2 was greatly reduced in Ptk7 KD cells. (B) Y-27632 treatment of control cells causes cell shape defects similar to those of Ptk7 KD cells. (C) Western blot analysis of MYPT1 phosphorylation and ROCK expression. Quantification of protein levels is shown on the right. Ptk7 KD cells show increased ROCK activity and decreased ROCK protein expression. Data are represented as mean +/− SEM. (D) Confocal images of pRLC and F-actin staining on the basal surface of Luc KD or Ptk7 KD cells with the indicated treatment. Y-27632 treatment of Ptk7 KD cells reversed the increase in RLC phosphorylation and formation of the aberrant actin cables. (E) Impaired apical constriction in Ptk7 KD cells. Shroom-transfected cells are marked by GFP (cyan). Cell boundaries are marked by E-cadherin immunostaining (red). Confocal images show the apical and basal regions of the cells. Apical constriction is quantified as the ratio of the basal surface area to the apical surface area of transfected cells. Bars indicate the median. One outlier Ptk7 KD cell showed greatly increased apical constriction (arrow), likely a result of incomplete knockdown. * The p-value when including the outlier (arrow) is 0.425 and when excluding, p= 0.011. (F) In hanging drop assays, the size of Ptk7 KD cell aggregates are smaller on average, suggesting weakened cell-cell adhesion. The areas occupied by individual cell aggregates were quantified and binned. P-value was calculated using the Kolmogorov-Smirnov test. Scale bars, (A, B, D, E), 10 μm; (F), 200 μm. (See also Figure S2).
Figure 3
Figure 3. PTK7 regulates myosin II and junctional Src signaling through its cytoplasmic domain
(A) PTK7wt-Venus but not PTK7Δcyt-Venus rescued the cell shape and myosin IIB localization defects in Ptk7 KD cells. Four stable cell lines expressing the indicated constructs were stained for myosin IIB and F-actin. (B) PTK7wt-Venus but not PTK7Δcyt-Venus partially restored perijunctional ROCK2 localization in Ptk7 KD cells. (C) GFP or PTK7-Venus localization in the indicated cell lines. PTK7Δcyt-Venus was mislocalized to the apical membranes. (D–F) Quantifications of cell height (D), perijunctional (E) and basal myosin IIB localization (F) in the indicated cell lines. (G) Co-IP of endogenous Src with PTK7wt-Venus but not PTK7Δcyt-Venus. Venus fusion proteins were immunoprecipitated from stable cell lines using GFP-Trap beads and bound fractions analyzed by Src and PTK7 immunoblotting. (H) Confocal images of Luc KD or Ptk7 KD cells immunostained for total Src, pY416-Src and pY527-Src. (I) Qunatifications show that junctional staining intensity was unchanged for total Src, decreased for pY416-Src and increased for pY527-Src in Ptk7 KD cells. (J) Western blot analysis showing reduced levels pY416-Src and increased levels of pY527-Src in Ptk7 KD cells. Total Src levels were slightly increased. In (D–F, I, J), data are represented as mean +/− SEM. Scale bars, 10 μm. (See also Figure S3).
Figure 4
Figure 4. Expression of Src-EGFP partially rescues the Ptk7 KD phenotypes
(A–C) Expression of Srcwt-EGFP but not a kinase-dead mutant significantly restored junctional pY416-Src (A), perijunctional myosin IIB (B) and to a lesser degree, perijunctional ROCK2 localization (C) in Ptk7 KD cells. Transfected Luc KD cells were shown as controls. (D–F) Quantifications of cell height (D), perijunctional (E) and basal myosin IIB localization (F) in Ptk7 KD cells transfected by the indicated constructs. (G) Western blot analysis showing levels of Src-EGFP expression, pY416-Src and PTK7 in cells expressing the indicated constructs. Endo Src, endogenous Src. (H) Quantifications of pY416-Src levels in cells expressing the indicated constructs by immunoblotting. The activity of Srcwt-GFP is higher than untagged Src in both control and Ptk7 KD cells. In (D–F, H), data are represented as mean +/− SEM. Scale bars, 10 μm. (See also Figure S4).
Figure 5
Figure 5. PTK7 regulates junctional Src signaling and ROCK2 phosphorylation in the mouse OC
(A–B) Src was uniformly distributed around cell junctions in both control (A) and Ptk7−/− OC (B) at E16.5. (C–H) E16.5 cochleae stained for pY416-Src (red) and phalloidin (green). (C–E) pY416-Src was enriched on the medial boundaries of hair cells in the control. (F–H) Junctional pY416-Src staining was significantly reduced in Ptk7−/− OC. (E, H) Higher magnifications of the hair cell indicated by asterisks in D and G, respectively. (I–J) ROCK2 showed punctate staining around cell junctions in both control (I) and Ptk7−/− OC (J) at E16.5. (K–P) E16.5 cochleae stained for pY722-ROCK2 (red) and phalloidin (green). (K–M) In control OC, pY722-ROCK2 staining was also enriched on the medial boundaries of hair cells. (N–P) Junctional pY722-ROCK2 staining was significantly reduced in Ptk7−/− OC. (M, P) Higher magnification of the hair cell indicated by asterisks in L and O, respectively. Images were taken from the mid-basal region of the cochlea (25% cochlear length). Arrowheads indicate the row of pillar cells. Brackets indicate OHC rows. Lateral is up in all micrographs. Scale bars, (E, H, M, P), 2 μm, all other panels, 4 μm. (Q) Quantification of medial to lateral (M:L) staining intensity ratios of junctional Src, pY416-Src and pY722-ROCK2. Data are represented as mean +/− SEM. (R–U) Total levels of pY416-Src, Src, ROCK2 and ROCK1 in E16.5 cochlear lysates. pY416-Src (R) and ROCK2 (T) levels were decreased in Ptk7−/− cochleae. Lysates from two cochleae of the same genotype were pooled and loaded in each lane. Numbers indicate percentage of normalized levels.
Figure 6
Figure 6. Src inhibition and hyperactivation both result in PCP defects in the OC
(A, B, F–K) Phalloidin (green, labels the hair bundle) and acetylated-tubulin (red, labels the kinocilium) staining of Src-inhibited cochlear explants (A, B) and E18.5 CskcKO OC (F–K). (A, B) Hair bundle orientation is disrupted in SU6656-treated cochlear explants (B, arrows). Hair bundle fragmentation is also observed (B, open arrow). (C, D) Quantification of kinocilium positions in vehicle (C) and SU6656-treated (D) explants. (E) SU6656- and Bosutinib-treatment reduced pY416-Src levels in cochlear explants. Numbers on the bottom indicate percentage of normalized levels. (F–I) CskcKO hair cells have defects in hair bundle polarity and orientation (G, I). Images were taken from the mid-basal region of the cochlea (25% cochlear length). (H, I) Higher magnification of the boxed OHCs in F and G, respectively. Arrows indicate the kinocilium position. (J, K) CskcKO mutants (K) have an extra row of OHCs in the apical region of the cochlea (80% cochlear length). (L) pY416-Src levels is increased by ~2 folds in CskcKO cochlear tissues. Arrowheads indicate the row of pillar cells. Brackets indicate OHC rows. Lateral is up in all micrographs. Scale bars, (A, B), 6 μm; (H, I), 5 μm; all other panels, 10 μm. (See also Figure S5).
Figure 7
Figure 7. Src inhibition and hyperactivation have opposing effects on pY722-ROCK2 localization in the OC
(A–X) E16.5 cochleae stained for myosin IIB (A–F), pY416-Src (G–L), ROCK2 (M–R) and pY722-ROCK2 (S–X). Green, phalloidin staining. (A, B) In control OC, myosin IIB (red) is localized to cell junctions and to apical foci in supporting cells (arrows). (C–F) Apical myosin IIB foci are absent in Bosutinib-treated OC (C, D) and CskcKO OC (E, F). Junctional MIIB localization is unchanged. (G–H) In control OC, pY416-Src (red) is enriched along medial boundaries between hair cells and neighboring supporting cells. pY416-Src staining was significantly reduced in Bosutinib-treated OC (I, J) and became circumferentially localized along cell-cell contacts in CskcKO OC (K, L). (M–P) ROCK2 (red) was distributed along cell junctions in a punctate manner in control (M, N) and Bosutinib-treated OC (O, P). (Q, R) In CskcKO OC, ROCK2 is still localized to cell junctions. Of note, multicellular rosettes were frequently observed, where ROCK2 was enriched at their vertices (arrows). (S, T) In control OC, pY722-ROCK2 (red) staining shows similar asymmetric localization to that of pY416-Src. pY722-ROCK2 staining was greatly reduced in Bosutinib-treated OC (U, V) and became circumferentially localized along cell-cell contacts in CskcKO OC (W, X). Images were taken from the mid-basal region of the OC (25% cochlear length). Arrowheads indicate the row of pillar cells. Brackets indicate OHC rows. Lateral is up in all micrographs. Scale bars, 4 μm.

References

    1. Amsberg GK, Koschmieder S. Profile of bosutinib and its clinical potential in the treatment of chronic myeloid leukemia. Onco Targets Ther. 2013;6:99–106. - PMC - PubMed
    1. Bardet PL, Guirao B, Paoletti C, Serman F, Leopold V, Bosveld F, Goya Y, Mirouse V, Graner F, Bellaiche Y. PTEN controls junction lengthening and stability during cell rearrangement in epithelial tissue. Dev Cell. 2013;25:534–546. - PubMed
    1. Bin-Nun N, Lichtig H, Malyarova A, Levy M, Elias S, Frank D. PTK7 modulates Wnt signaling activity via LRP6. Development. 2014;141:410–421. - PubMed
    1. Blake RA, Broome MA, Liu X, Wu J, Gishizky M, Sun L, Courtneidge SA. SU6656, a selective src family kinase inhibitor, used to probe growth factor signaling. Mol Cell Biol. 2000;20:9018–9027. - PMC - PubMed
    1. Blankenship JT, Backovic ST, Sanny JS, Weitz O, Zallen JA. Multicellular rosette formation links planar cell polarity to tissue morphogenesis. Dev Cell. 2006;11:459–470. - PubMed

Publication types

LinkOut - more resources