

Estimated GFR and circulating 24,25-dihydroxyvitamin D3 concentration: a participant-level analysis of 5 cohort studies and clinical trials
- PMID: 24703961
- PMCID: PMC4111986
- DOI: 10.1053/j.ajkd.2014.02.015
Estimated GFR and circulating 24,25-dihydroxyvitamin D3 concentration: a participant-level analysis of 5 cohort studies and clinical trials
Abstract
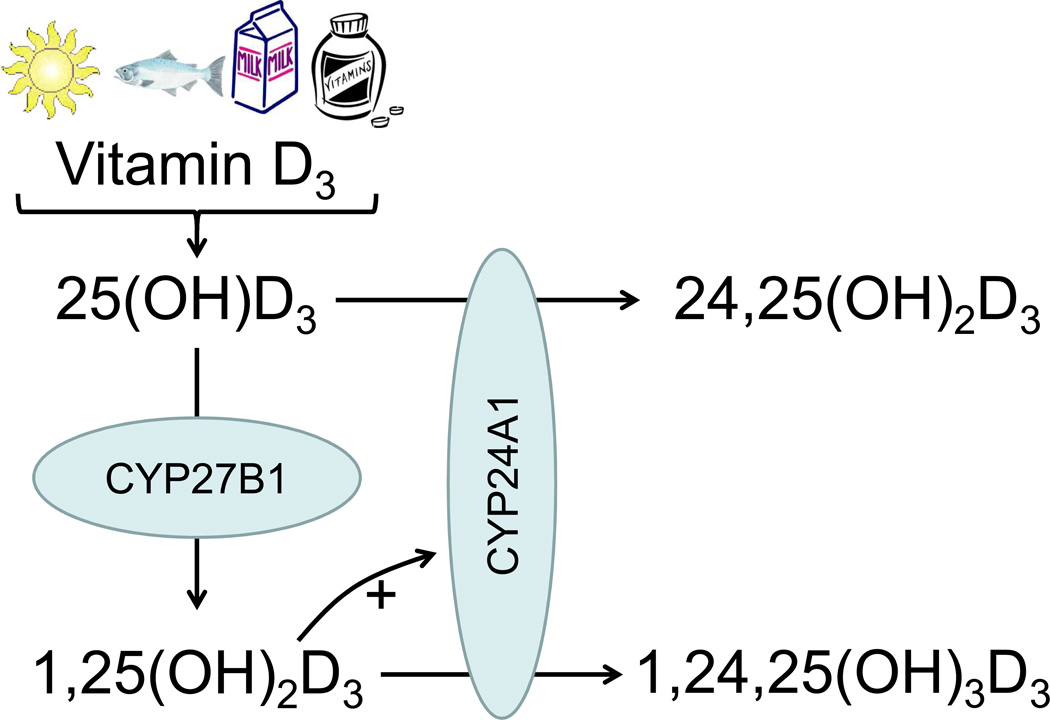
Background: Decreased glomerular filtration rate (GFR) leads to reduced production of 1,25-dihydroxyvitamin D3 from 25-hydroxyvitamin D3 (25[OH]D3). Effects of low GFR on vitamin D catabolism are less well understood. We tested associations of estimated GFR (eGFR) with the circulating concentration of 24,25-dihydroxyvitamin D3 (24,25[OH]2D3), the most abundant product of 25(OH)D3 catabolism, across populations with a wide range of GFRs.
Study design: Cross-sectional study.
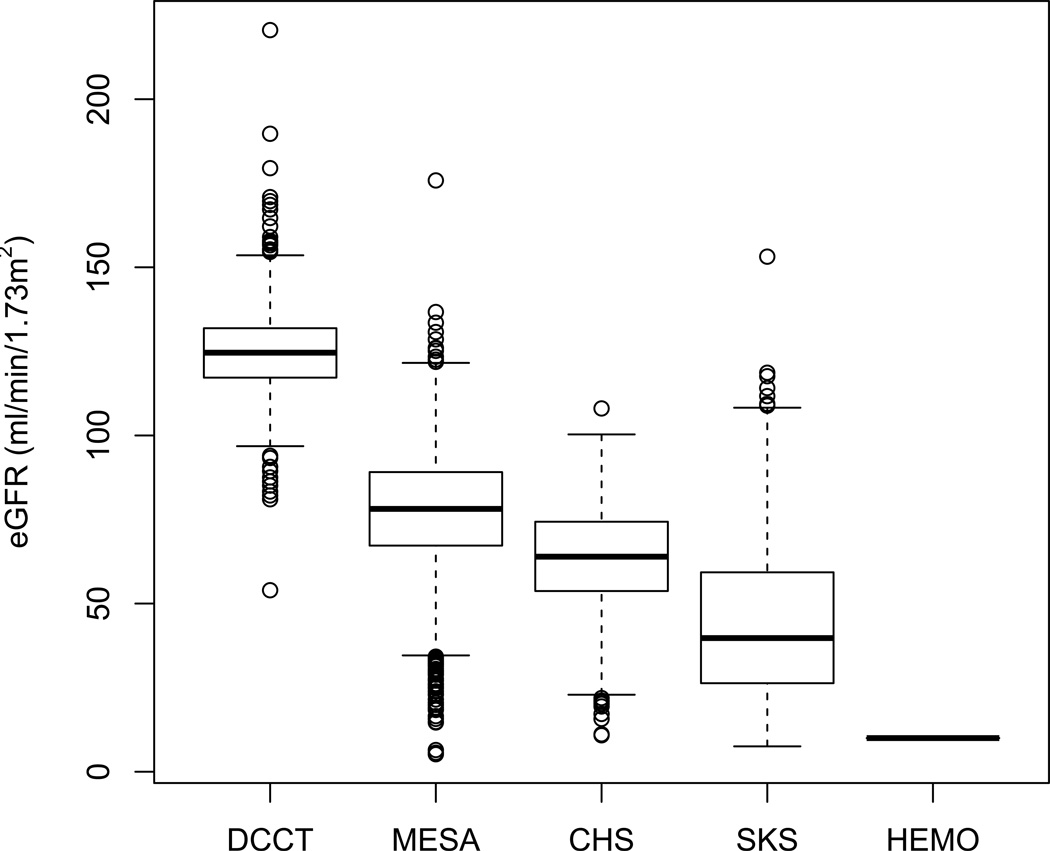
Setting & participants: 9,596 participants in 5 cohort studies and clinical trials: the Diabetes Control and Complications Trial (N=1,193), Multi-Ethnic Study of Atherosclerosis (N=6,470), Cardiovascular Health Study (N=932), Seattle Kidney Study (N=289), and Hemodialysis Study (N=712).
Predictor: eGFR.
Outcome: Circulating 24,25(OH)2D3 concentration.
Measurements: GFR was estimated from serum creatinine using the Chronic Kidney Disease Epidemiology Collaboration equation. Vitamin D metabolites were measured by mass spectrometry.
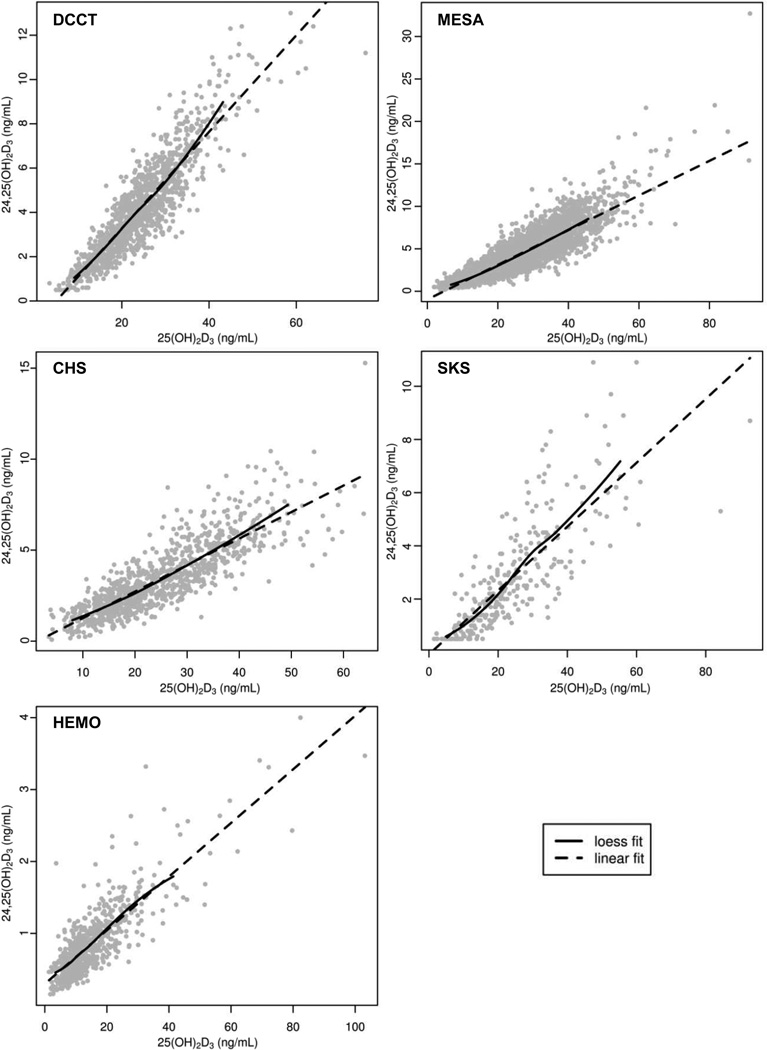
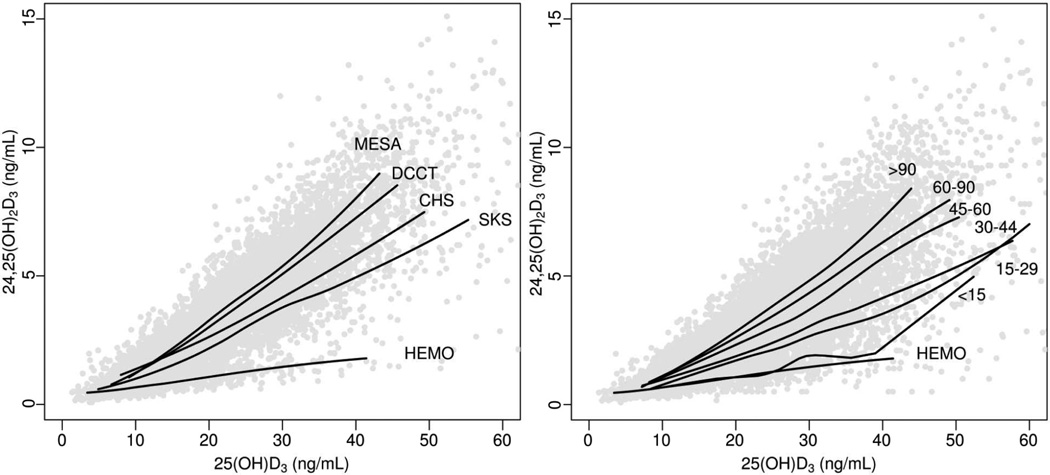
Results: Circulating 24,25(OH)2D3 concentration was correlated with circulating 25(OH)D3 concentration (Pearson r range, 0.64-0.88). This correlation was weaker with lower eGFRs. Moreover, the increment in 24,25(OH)2D3 concentration associated with higher 25(OH)D3 concentration (slope) was lower with lower eGFRs: 2.06 (95% CI, 2.01-2.10), 1.77 (95% CI, 1.74-1.81), 1.55 (95% CI, 1.48-1.62), 1.17 (95% CI, 1.05-1.29), 0.92 (95% CI, 0.74-1.10), 0.61 (95% CI, 0.22-1.00), and 0.37 (95% CI, 0.35-0.39) ng/mL of 24,25(OH)2D3 per 10 ng/mL of 25(OH)D3 for eGFRs≥90, 60-89, 45-59, 30-44, 15-29, and <15 mL/min/1.73 m2 and end-stage renal disease treated with hemodialysis, respectively. As a result, at a 25(OH)D3 concentration of 20 ng/mL, mean 24,25(OH)2D3 concentrations were 2.92 (95% CI, 2.87-2.96), 2.68 (95% CI, 2.64-2.72), 2.35 (95% CI, 2.26-2.45), 1.92 (95% CI, 1.74-2.10), 1.69 (95% CI, 1.43-1.95), 1.14 (95% CI, 0.62-1.66), and 1.04 (95% CI,1.02-1.07) ng/mL for each category, respectively. This interaction was independent of other relevant clinical characteristics. Race, diabetes, urine albumin excretion, and circulating parathyroid hormone and fibroblast growth factor 23 concentrations more modestly modified the association of 24,25(OH)2D3 with 25(OH)D3.
Limitations: Lack of direct pharmacokinetic measurements of vitamin D catabolism.
Conclusions: Lower eGFR is associated strongly with reduced vitamin D catabolism, as measured by circulating 24,25(OH)2D3 concentration.
Keywords: 1,25-dihydroxyvitamin D3; 25-hydroxyvitamin D3; Decreased renal function; active vitamin D; biomarker; chronic kidney disease (CKD); low estimated glomerular filtration rate; vitamin D catabolism.
Copyright © 2014 National Kidney Foundation, Inc. Published by Elsevier Inc. All rights reserved.
Figures
Comment in
-
Breaking down the vitamin D-GFR relationship.Am J Kidney Dis. 2014 Aug;64(2):168-70. doi: 10.1053/j.ajkd.2014.05.004. Am J Kidney Dis. 2014. PMID: 25060002 No abstract available.
-
Recalibration of 24,25-Dihydroxyvitamin D3 Results Based on NIST Standard Reference Material 972a.Am J Kidney Dis. 2016 May;67(5):812-3. doi: 10.1053/j.ajkd.2016.02.036. Am J Kidney Dis. 2016. PMID: 27091017 Free PMC article. No abstract available.
Similar articles
-
Decreased conversion of 25-hydroxyvitamin D3 to 24,25-dihydroxyvitamin D3 following cholecalciferol therapy in patients with CKD.Clin J Am Soc Nephrol. 2014 Nov 7;9(11):1965-73. doi: 10.2215/CJN.03130314. Epub 2014 Sep 2. Clin J Am Soc Nephrol. 2014. PMID: 25183657 Free PMC article. Clinical Trial.
-
Breaking down the vitamin D-GFR relationship.Am J Kidney Dis. 2014 Aug;64(2):168-70. doi: 10.1053/j.ajkd.2014.05.004. Am J Kidney Dis. 2014. PMID: 25060002 No abstract available.
-
Recalibration of 24,25-Dihydroxyvitamin D3 Results Based on NIST Standard Reference Material 972a.Am J Kidney Dis. 2016 May;67(5):812-3. doi: 10.1053/j.ajkd.2016.02.036. Am J Kidney Dis. 2016. PMID: 27091017 Free PMC article. No abstract available.
-
1alpha(OH)D3 One-alpha-hydroxy-cholecalciferol--an active vitamin D analog. Clinical studies on prophylaxis and treatment of secondary hyperparathyroidism in uremic patients on chronic dialysis.Dan Med Bull. 2008 Nov;55(4):186-210. Dan Med Bull. 2008. PMID: 19232159 Review.
-
A Meta-analysis of the Association of Estimated GFR, Albuminuria, Diabetes Mellitus, and Hypertension With Acute Kidney Injury.Am J Kidney Dis. 2015 Oct;66(4):602-12. doi: 10.1053/j.ajkd.2015.02.338. Epub 2015 May 11. Am J Kidney Dis. 2015. PMID: 25975964 Free PMC article. Review.
Cited by
-
Renal Clearance of Mineral Metabolism Biomarkers.J Am Soc Nephrol. 2016 Feb;27(2):392-7. doi: 10.1681/ASN.2014121253. Epub 2015 Jun 5. J Am Soc Nephrol. 2016. PMID: 26047790 Free PMC article.
-
The metabolism of 1,25(OH)2D3 in clinical and experimental kidney disease.Sci Rep. 2022 Jun 28;12(1):10925. doi: 10.1038/s41598-022-15033-9. Sci Rep. 2022. PMID: 35764669 Free PMC article.
-
Chemotyping the distribution of vitamin D metabolites in human serum.Sci Rep. 2016 Feb 11;6:21080. doi: 10.1038/srep21080. Sci Rep. 2016. PMID: 26864540 Free PMC article.
-
Association of Vitamin D Metabolites With Arterial Function in the Hemodialysis Fistula Maturation Study.Am J Kidney Dis. 2017 Jun;69(6):805-814. doi: 10.1053/j.ajkd.2017.01.049. Epub 2017 Mar 27. Am J Kidney Dis. 2017. PMID: 28359657 Free PMC article.
-
Fibroblast Growth Factor-23 and Frailty in Elderly Community-Dwelling Individuals: The Cardiovascular Health Study.J Am Geriatr Soc. 2016 Feb;64(2):270-6. doi: 10.1111/jgs.13951. J Am Geriatr Soc. 2016. PMID: 26889836 Free PMC article.
References
-
- Fraser DR, Kodicek E. Unique biosynthesis by kidney of a biological active vitamin D metabolite. Nature. 1970 Nov;228(5273):764–766. - PubMed
-
- Dusso A, Lopez-Hilker S, Lewis-Finch J, et al. Metabolic clearance rate and production rate of calcitriol in uremia. Kidney Int. 1989 Mar;35(3):860–864. - PubMed
-
- Dusso AS, Tokumoto M. Defective renal maintenance of the vitamin D endocrine system impairs vitamin D renoprotection: a downward spiral in kidney disease. Kidney international. 2011 Apr;79(7):715–729. - PubMed
-
- Nigwekar SU, Bhan I, Thadhani R. Ergocalciferol and cholecalciferol in CKD. American journal of kidney diseases : the official journal of the National Kidney Foundation. 2012 Jul;60(1):139–156. - PubMed
Publication types
MeSH terms
Substances
Grants and funding
- R01 DK087726/DK/NIDDK NIH HHS/United States
- R01 DK088762/DK/NIDDK NIH HHS/United States
- R01HL080295/HL/NHLBI NIH HHS/United States
- N01 HC095169/HL/NHLBI NIH HHS/United States
- R01HL096875/HL/NHLBI NIH HHS/United States
- R01 GM063666/GM/NIGMS NIH HHS/United States
- N01 HC095159/HL/NHLBI NIH HHS/United States
- R01HL102214/HL/NHLBI NIH HHS/United States
- N01 HC085079/HL/NHLBI NIH HHS/United States
- P30 DK035816/DK/NIDDK NIH HHS/United States
- P30 DK017047/DK/NIDDK NIH HHS/United States
- RC4DK090766/DK/NIDDK NIH HHS/United States
- R01 DK081473/DK/NIDDK NIH HHS/United States
- UL1 RR025005/RR/NCRR NIH HHS/United States
- UL1-RR-025005/RR/NCRR NIH HHS/United States
- R01DK081473/DK/NIDDK NIH HHS/United States
- N01 HC085086/HL/NHLBI NIH HHS/United States
- N01 HC085083/HL/NHLBI NIH HHS/United States
- UL1-RR-024156/RR/NCRR NIH HHS/United States
- R01 HL096851/HL/NHLBI NIH HHS/United States
- UL1 RR024156/RR/NCRR NIH HHS/United States
- R01DK088762/DK/NIDDK NIH HHS/United States
- R01 HL102214/HL/NHLBI NIH HHS/United States
- N01 HC055222/HL/NHLBI NIH HHS/United States
- RC4 DK090766/DK/NIDDK NIH HHS/United States
- R01 HL080295/HL/NHLBI NIH HHS/United States
- R01DK087726/DK/NIDDK NIH HHS/United States
- R01HL096851/HL/NHLBI NIH HHS/United States
- R01 AG023629/AG/NIA NIH HHS/United States
- AG023629/AG/NIA NIH HHS/United States
- R01 HL096875/HL/NHLBI NIH HHS/United States
- R56 AG023629/AG/NIA NIH HHS/United States
LinkOut - more resources
Full Text Sources
Other Literature Sources
Medical
Research Materials
Miscellaneous
