. 2014 Jun 15:455:35-40.
doi: 10.1016/j.ab.2014.03.016. Epub 2014 Apr 1.

Measurement of trimethylamine-N-oxide by stable isotope dilution liquid chromatography tandem mass spectrometry

Affiliations

Measurement of trimethylamine-N-oxide by stable isotope dilution liquid chromatography tandem mass spectrometry

Zeneng Wang et al. Anal Biochem. .

Abstract

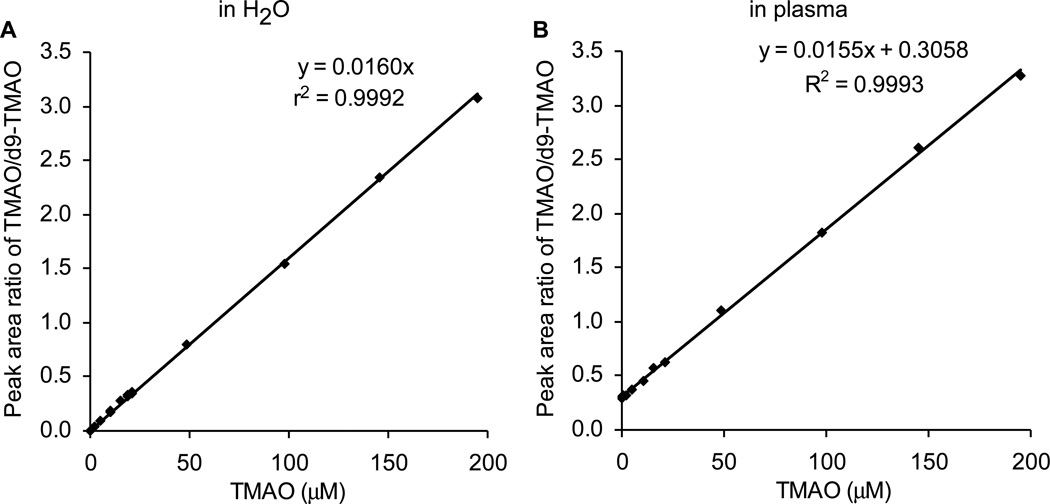
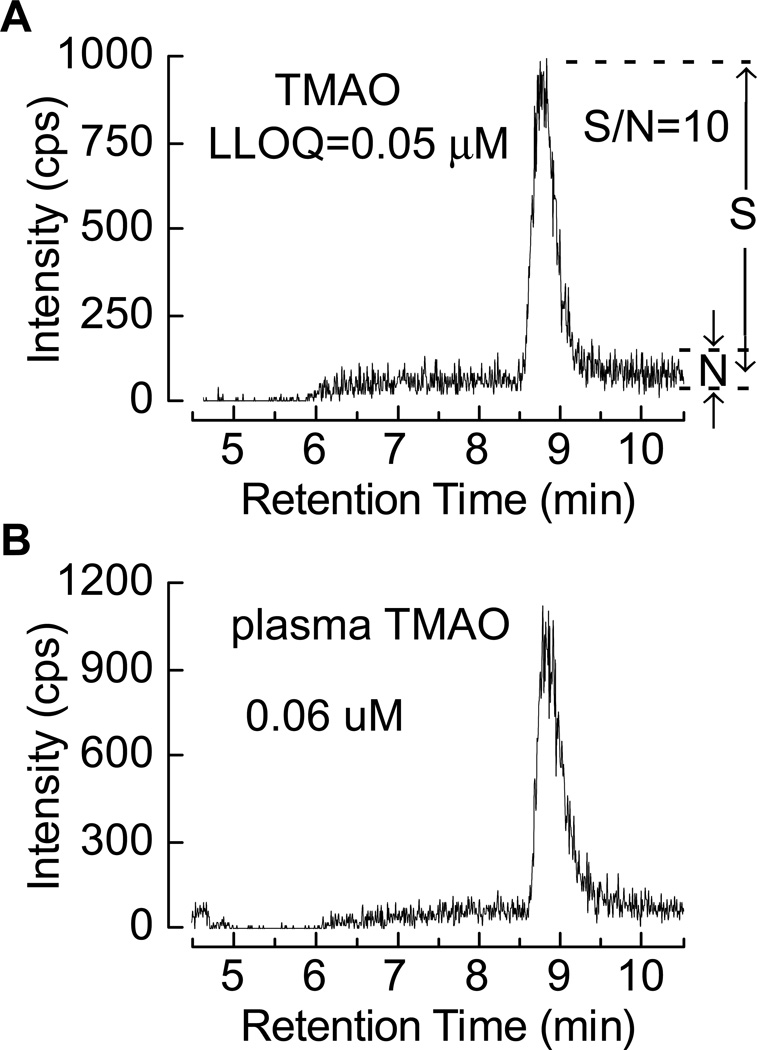
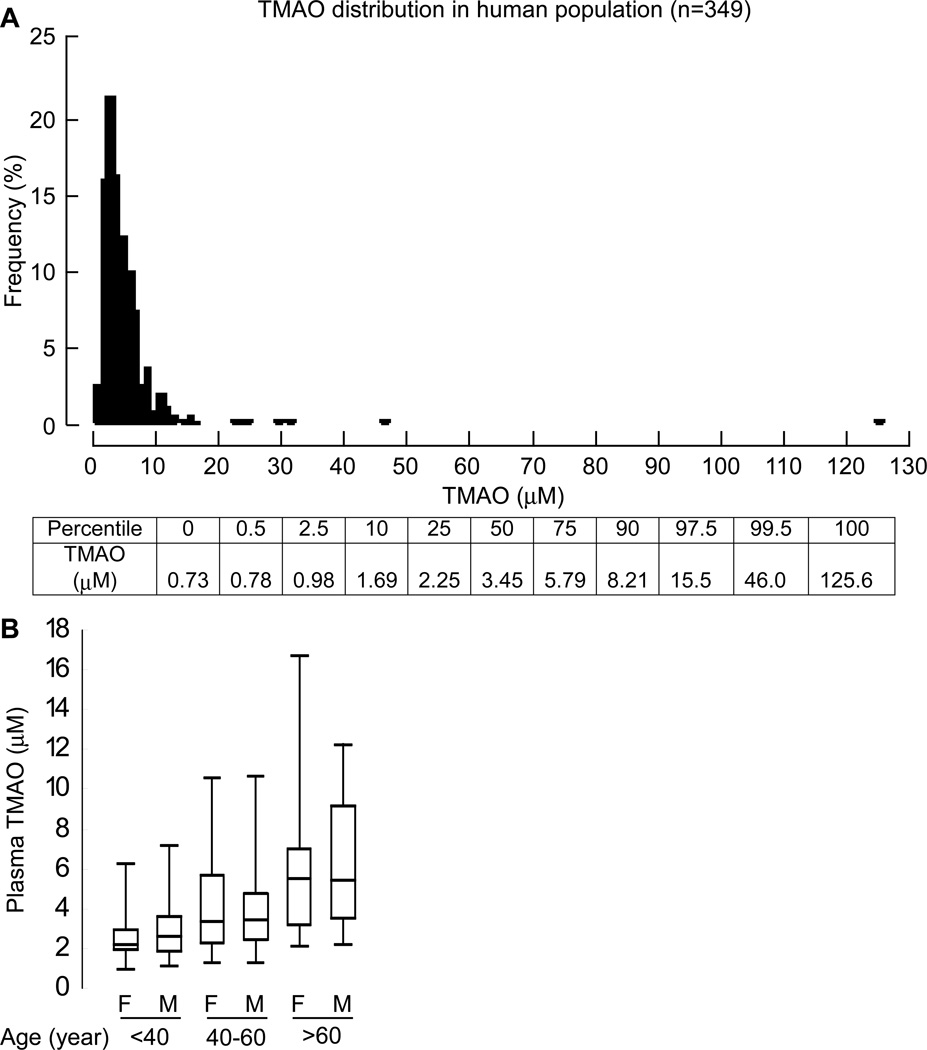
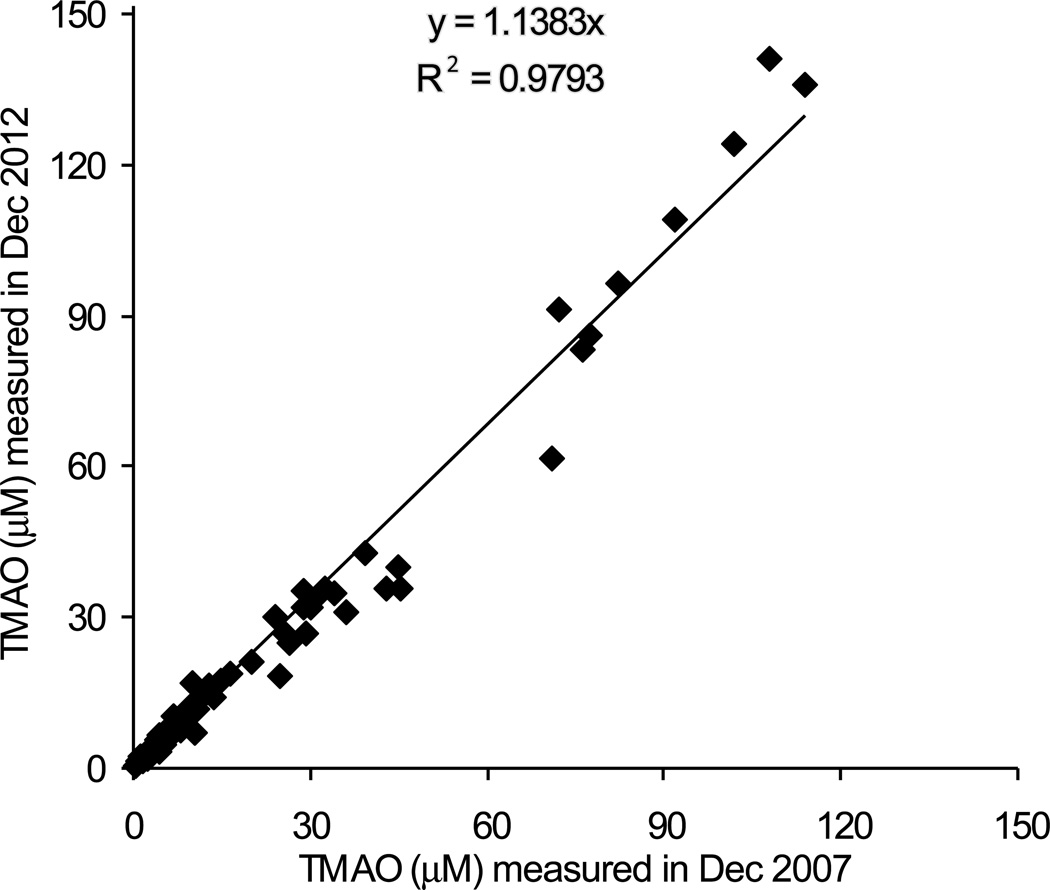
Trimethylamine-N-oxide (TMAO) levels in blood predict future risk for major adverse cardiac events including myocardial infarction, stroke, and death. Thus, the rapid determination of circulating TMAO concentration is of clinical interest. Here we report a method to measure TMAO in biological matrices by stable isotope dilution liquid chromatography tandem mass spectrometry (LC/MS/MS) with lower and upper limits of quantification of 0.05 and >200μM, respectively. Spike and recovery studies demonstrate an accuracy at low (0.5μM), mid (5μM), and high (100μM) levels of 98.2, 97.3, and 101.6%, respectively. Additional assay performance metrics include intraday and interday coefficients of variance of <6.4 and <9.9%, respectively, across the range of TMAO levels. Stability studies reveal that TMAO in plasma is stable both during storage at -80°C for 5years and to multiple freeze thaw cycles. Fasting plasma normal range studies among apparently healthy subjects (n=349) show a range of 0.73-126μM, median (interquartile range) levels of 3.45 (2.25-5.79)μM, and increasing values with age. The LC/MS/MS-based assay reported should be of value for further studies evaluating TMAO as a risk marker and for examining the effect of dietary, pharmacologic, and environmental factors on TMAO levels.

Keywords: Cardiovascular disease; Mass spectrometry; Trimethylamine-N-oxide.


Figures

Fig. 1
Fig. 1
Collision induced dissociation (CID) mass spectra of trimethylamine-N-oxide (TMAO, Panel A) and trimethylamine-N-oxide-d9 (d9-TMAO, Panel B). Proposed pathways for formation of the fragment ions are also shown.
Fig. 2
Fig. 2
Detection of TMAO in biological matrices. Extracted ion LC chromatograms from multiple reaction monitoring in positive ion mode of TMAO (A), d9-TMAO (B) standards and plasma (C and D), spiked with 4 volumes of internal standard, d9-TMAO, at a concentration of 10 µM in methanol. The precursor-to-product transitions were 76→58 amu, 85→66 amu, respectively. Note, prior to data collection, the eluent was diverted to waste for the initial 4.5 minutes of the gradient. The concentrations of TMAO in standard (A) and plasma (C) were 20.0 and 56.9 µM, respectively.
Fig. 3
Fig. 3
Multiplex binary gradient elution profile for quantitation of trimethylamine-N-oxide (TMAO) by LC/MS/MS. Two different solvents, A, 0.1% propanoic acid in water; B, 0.1% acetic acid in methanol, were used to generate the gradient. a1 and a2, time point for sample injection on column 1 and 2 respectively; b1 and b2, time point for start of data collection on column 1 and 2 respectively; c1, c2, time point for data collection to end and column 1 and 2 to be switched to waste, respectively.
Fig. 4
Fig. 4
Standard curves for LC/ESI/MS/MS analysis of TMAO. 80 µl 10 µM d9-TMAO internal standard in methanol was added to 20 µl different concentrations of TMAO standard (A) or 20 µl control plasma spiked with different concentrations of TMAO standard followed by spin-down to remove precipitated protein. Analyses were performed using electrospray ionization in positive-ion mode with multiple reaction monitoring of precursor and characteristic product ions. The transitions monitored were mass-to-charge ratio (m/z): m/z 76 → 58 amu for TMAO; and m/z 85 → 66 amu for d9-TMAO. Standard curves of TMAO were generated by plotting peak area ratio versus the concentration in water or spiked into plasma.
Fig. 5
Fig. 5
(A) Extracted ion LC chromatogram at the LLOQ from multiple reaction monitoring in the positive mode of the 76 amu to 58 amu precursor to product ions from a 0.05 µM TMAO standard spiked to dialyzed plasma, note this gives a signal-to-noise ratio (S/N) of 10 : 1. (B) Extracted ion LC chromatogram recorded as above of the plasma TMAO level at the lowest concentration (0.06 µM) among the more than 4,000 human samples analyzed.
Fig. 6
Fig. 6
(A) Distribution of TMAO concentrations in healthy volunteers (n=349). Lower bar gives the concentrations of TMAO at each percentile. (B) Box whisker plot showing distribution of the TMAO concentration with respect to age and gender in the above population (n=349). The population was segregated by age and gender as shown on lower axis. Horizontal in middle of box = TMAO concentration at median value, top of box at 75th percentile, bottom of box at 25th percentile, top of whisker at 97.5 percentile and bottom of whisker at 2.5 percentile in the specified population.
Fig. 7
Fig. 7
The stability of TMAO in frozen plasma samples after long term storage (5 years at −80 °C). The same set of 124 human plasma samples (randomly selected from Genebank, a large (n = 10,000) and well-characterized tissue repository with longitudinal data from sequential consenting subjects undergoing elective diagnostic left heart catheterization) was measured in Dec 2007 and in Dec 2012 by LC/MS/MS. The plasma samples were collected between Nov 5, 2001 and April 5, 2005, and kept frozen at −80 °C until assay. All plasma samples were defrosted at least 2 times.

References

    1. Wang Z, Klipfell E, Bennett BJ, Koeth R, Levison BS, Dugar B, Feldstein AE, Britt EB, Fu X, Chung YM, Wu Y, Schauer P, Smith JD, Allayee H, Tang WH, DiDonato JA, Lusis AJ, Hazen SL. Gut flora metabolism of phosphatidylcholine promotes cardiovascular disease. Nature. 2011;472:57–63. - PMC - PubMed
    1. Koeth RA, Wang Z, Levison BS, Buffa JA, Org E, Sheehy BT, Britt EB, Fu X, Wu Y, Li L, Smith JD, DiDonato JA, Chen J, Li H, Wu GD, Lewis JD, Warrier M, Brown JM, Krauss RM, Tang WH, Bushman FD, Lusis AJ, Hazen SL. Intestinal microbiota metabolism of Lcarnitine, a nutrient in red meat, promotes atherosclerosis. Nat. Med. 2013;19:576–585. - PMC - PubMed
    1. Tang WH, Wang Z, Levison BS, Koeth RA, Britt EB, Fu X, Wu Y, Hazen SL. Intestinal microbial metabolism of phosphatidylcholine and cardiovascular risk. N. Engl. J. Med. 2013;368:1575–1584. - PMC - PubMed
    1. daCosta KA, Vrbanac JJ, Zeisel SH. The measurement of dimethylamine, trimethylamine, and trimethylamine N-oxide using capillary gas chromatography-mass spectrometry. Anal. Biochem. 1990;187:234–239. - PubMed
    1. Mamer OA, Choiniere L, Treacy EP. Measurement of trimethylamine and trimethylamine Noxide independently in urine by fast atom bombardment mass spectrometry. Anal. Biochem. 1999;276:144–149. - PubMed

Publication types